2275
Investigating early-stage parkinsonism using a dedicated MRI protocol and decision tree1Department of Radiology and Nuclear Medicine, Erasmus MC, Rotterdam, Netherlands, 2Department of Neurology, Erasmus MC, Rotterdam, Netherlands, 3Department of Imaging Physics, TU Delft, Delft, Netherlands
Synopsis
Keywords: Parkinson's Disease, Multi-Contrast
A dedicated MRI protocol and decision tree are presented for differentially diagnosing parkinsonisms. Decision rules are based on existing literature which identified biomarkers with a sensitivity and specificity around or above 80%. Initial in-vivo results from patients are presented, and their MRI findings are partially in agreement with existing literature. Our goal is to test our method on patients at an early-stage when their clinical diagnosis is unclear.Introduction
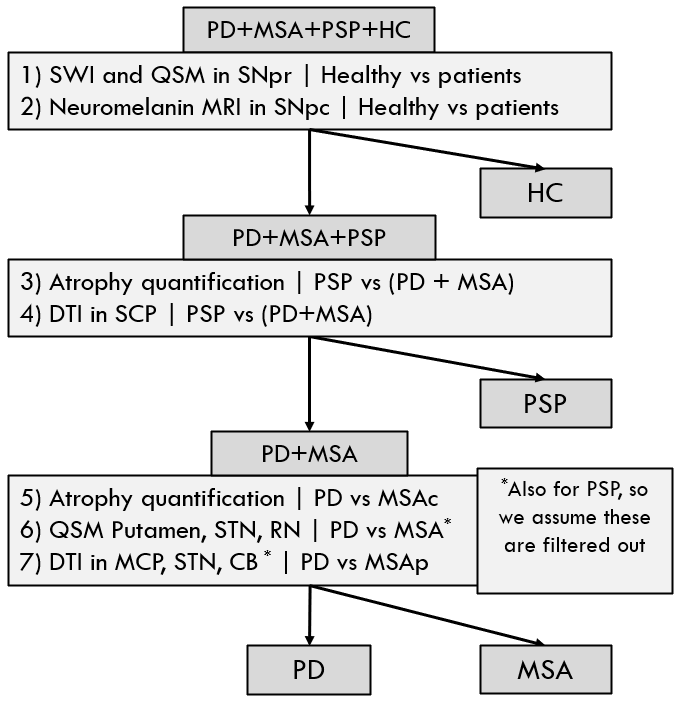
Differentiating between atypical parkinsonisms is a challenge in clinical settings. Quantitative MRI can aid the diagnostic decision making, yet a single quantitative biomarker is unlikely to be sufficiently powerful for differential diagnosis (1). A recent review (2) has identified several MRI-based biomarkers which have sensitivities and specificities around or above 80% for differentiating between Parkinson’s Disease (PD), progressive supranuclear palsy (PSP) and multiple system atrophy (MSA).We developed a decision tree made up of a sequence of decision rules which could perform differential diagnosis, and describe a dedicated multi-contrast MRI protocol to acquire the necessary information. We present a study design to test our novel method for differentially diagnosing parkinsonisms, which we aim to test on early-stage patients with a clinically unclear presentation at the time of scanning.
Methods
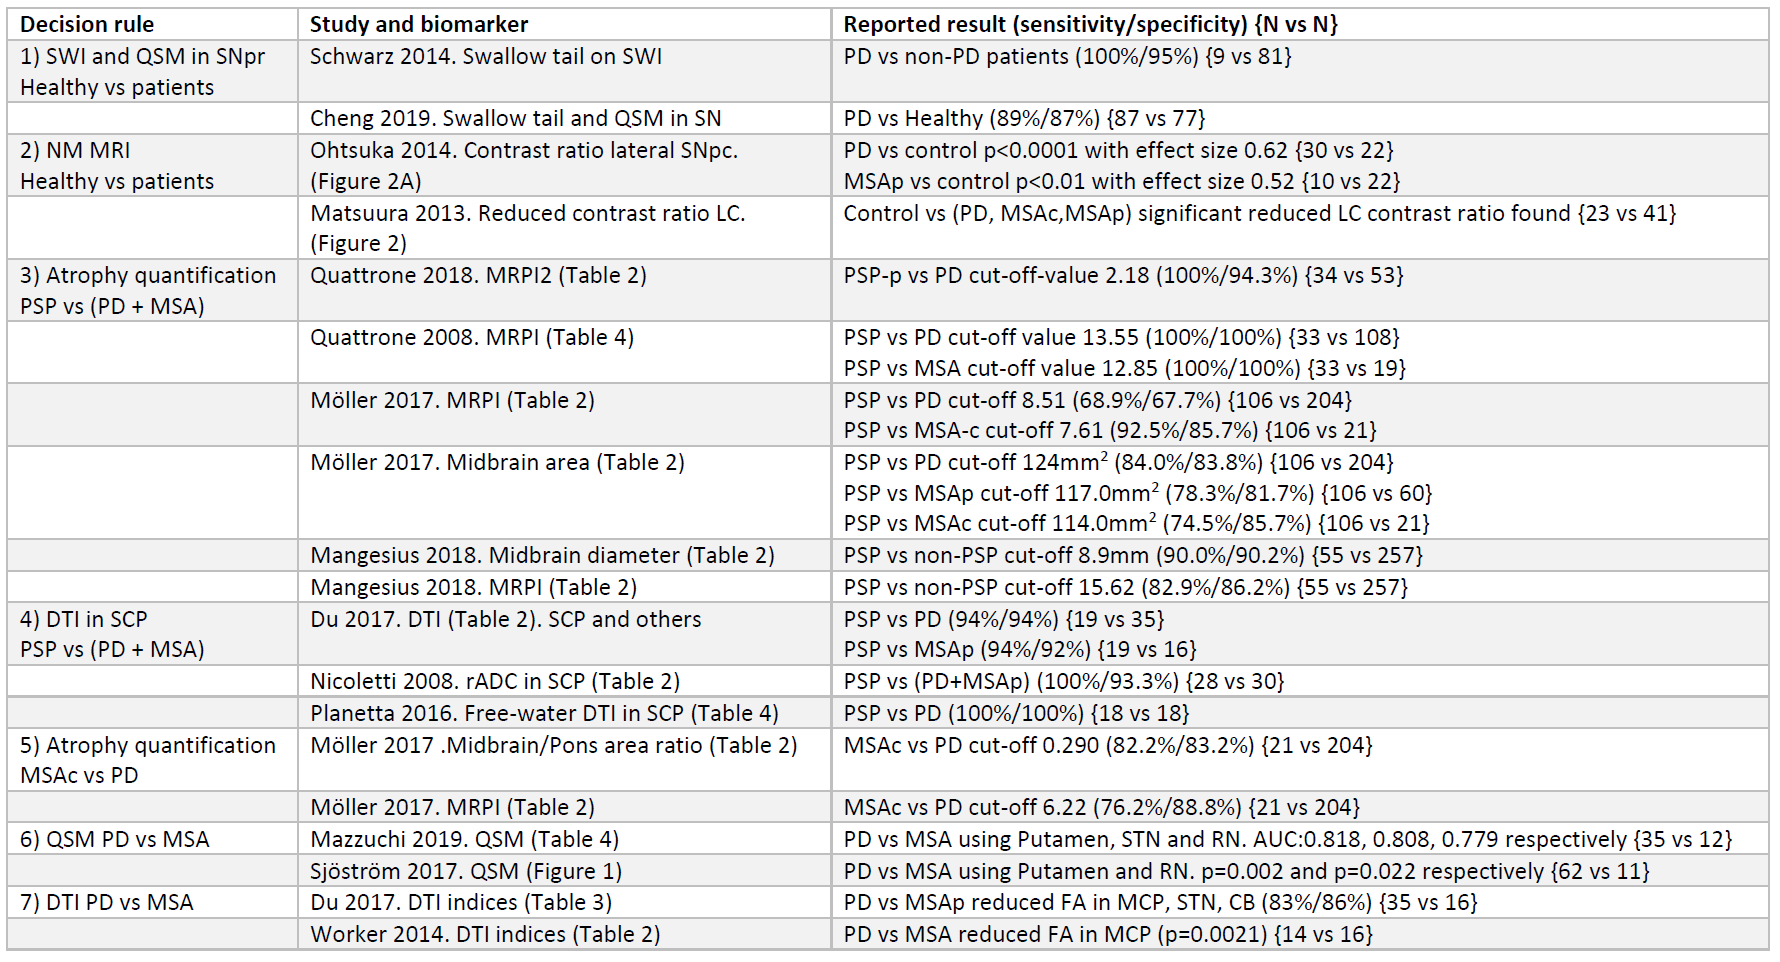
We reviewed the literature surrounding the use of MRI for differentially diagnosing atypical parkinsonisms (3-16). Based on existing techniques and findings, we propose a decision tree with 7 decision rules (Figure 1) and an MRI protocol which are based on published findings, summarised in Figure 2. Such a decision tree could be trained to perform patient outcome prediction, however it would require a population of approximately 50 subjects per cohort. The aim of our study is to test individual decision rules for group differences and report their significance, to justify a larger cohort study.Our study was approved by the local ethics board. To illustrate the study design, three patients were recruited from the movement disorder clinic with PD, MSA, and PSP (2 females, 1 male, aged 64-66, disease duration 1.16-3.39 years) as well as a healthy volunteer (female, 62). After informed consent they were scanned on a 3T system (Signa Premier, GE Healthcare, USA). Whole-brain T1-weighted (0.9mm isotropic) and T2-weighted (1x1x3mm3) were acquired. SWI and QSM were produced from the same 3D multi-echo gradient-echo sequence (0.7x0.7x1mm3, 88 slices, TE=13-37.6ms). FA was produced from a DTI sequence (1.75x1.75x2mm3, 56 slices, TE=77.9ms, SMS2+GRAPPA2, b1000, 64 directions) and neuromelanin MRI to image the substantia nigra (SN) and locus coeruleus (LC) with a 2D MT-weighted sequence (0.4x0.4x3mm3, 12 slices, TE=7.5ms, NEX=3).
QSM processing was performed using the MEDI toolbox (17), and DTI data was corrected for off-resonance effects (18) and fit using FSL dtifit.
Results
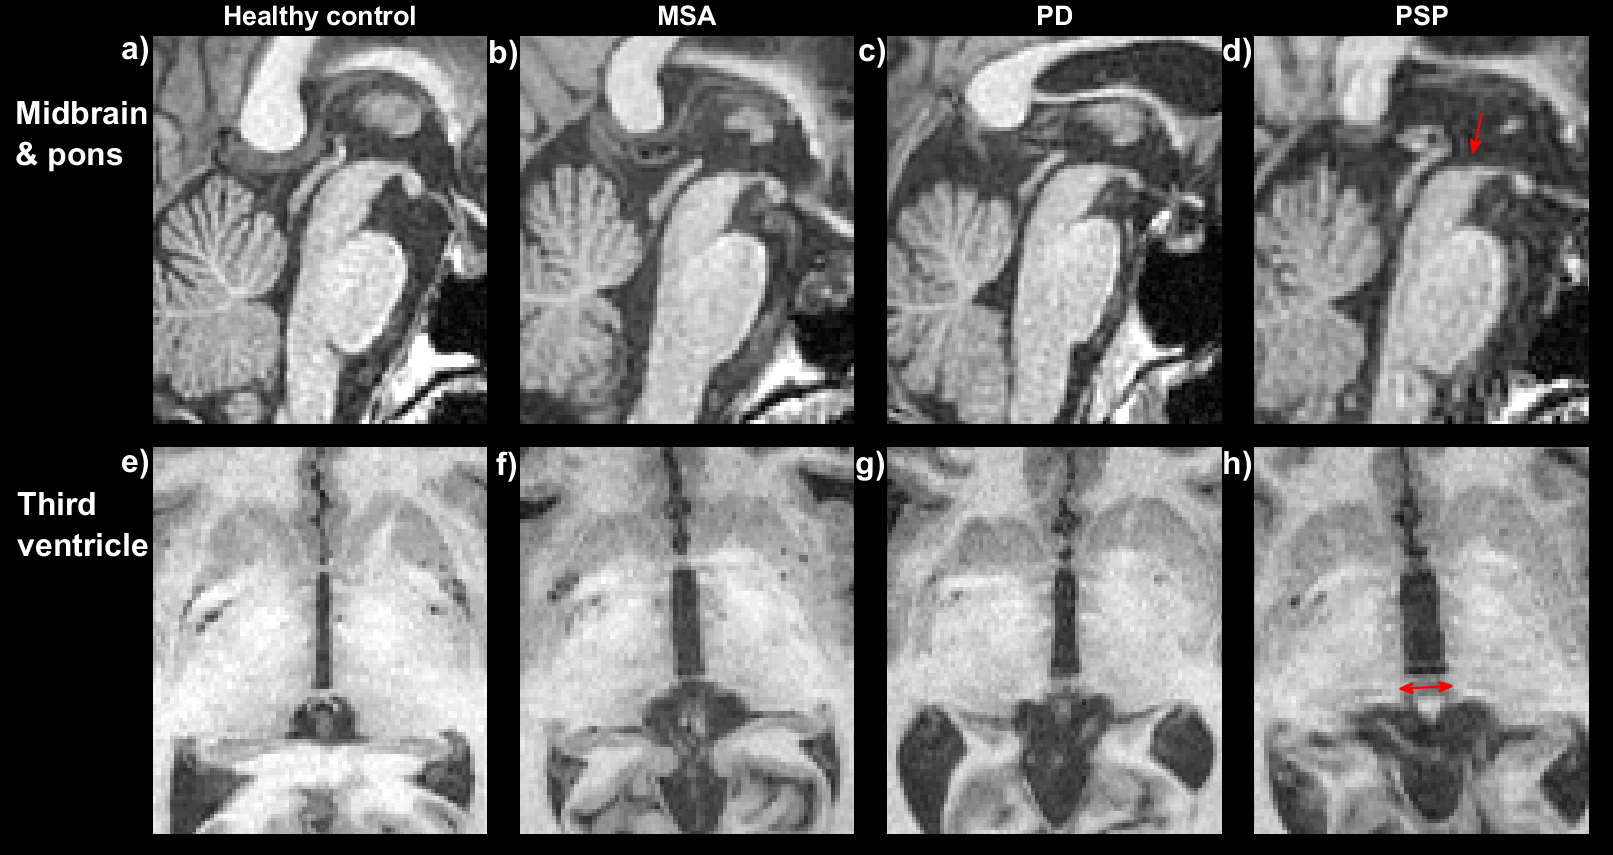
In-vivo data illustrating relevant biomarkers are shown for a healthy control and three patients.Figure 3 shows T1-weighted images about the brainstem and third ventricle, which have shown to be useful for quantifying midbrain and ventricular atrophy for differentiating PSP from PD and MSA patients. Subfigures 3d and 3h show increased atrophy in the PSP patient compared to other subjects, which should aid rule #3.
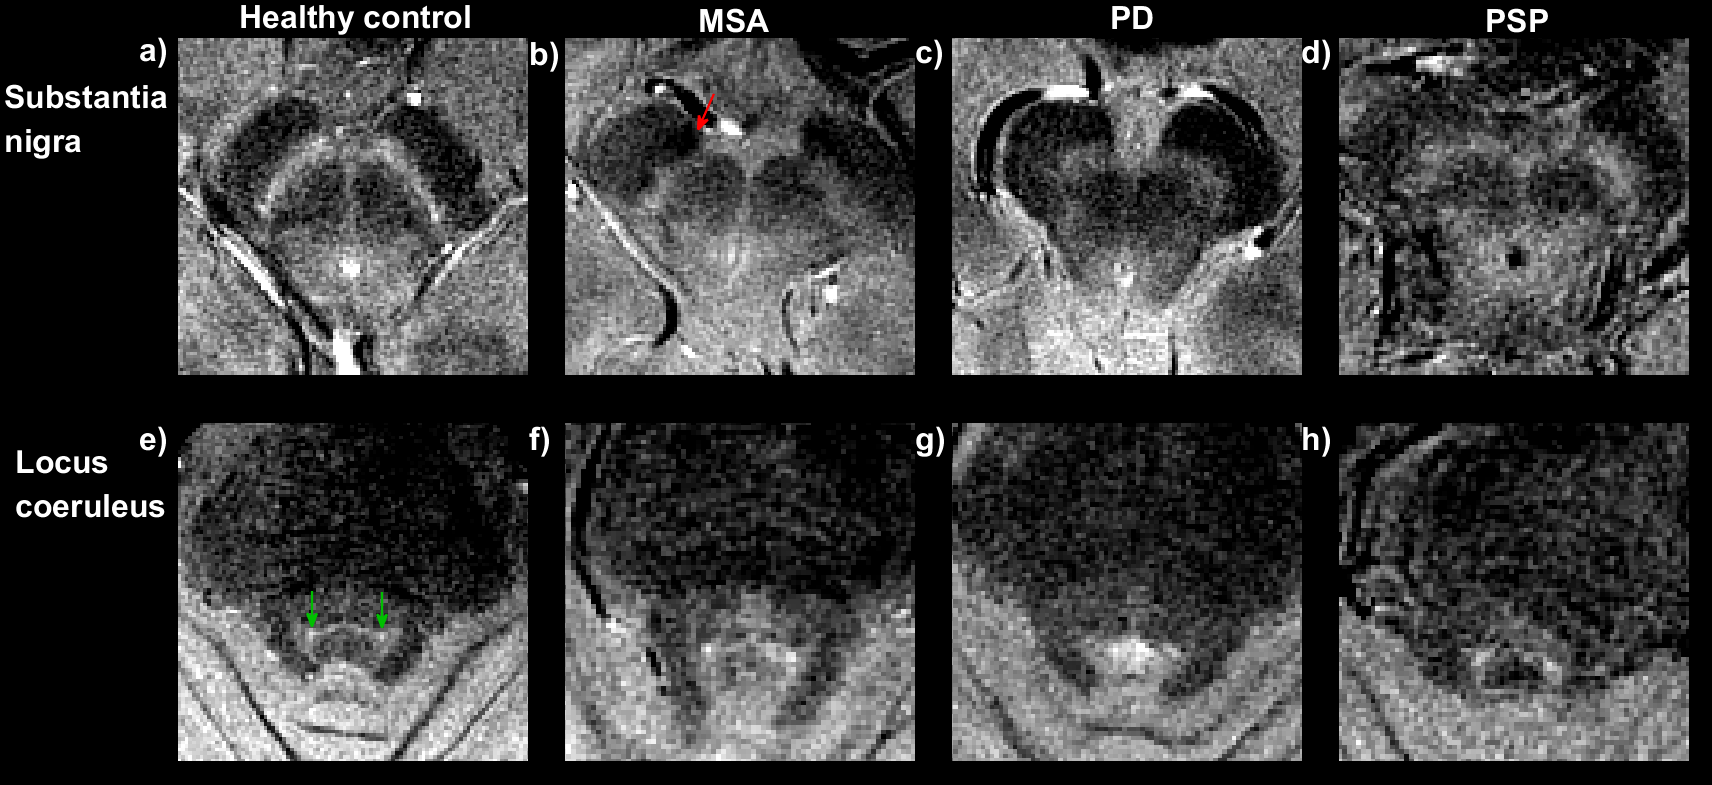
Figure 4 shows neuromelanin MRI at the level of the SN and LC . Reduced neuromelanin can be seen in the SN for all patients compared to the control. The LC seems most visible in the healthy control, but also in the patients (rule #2).
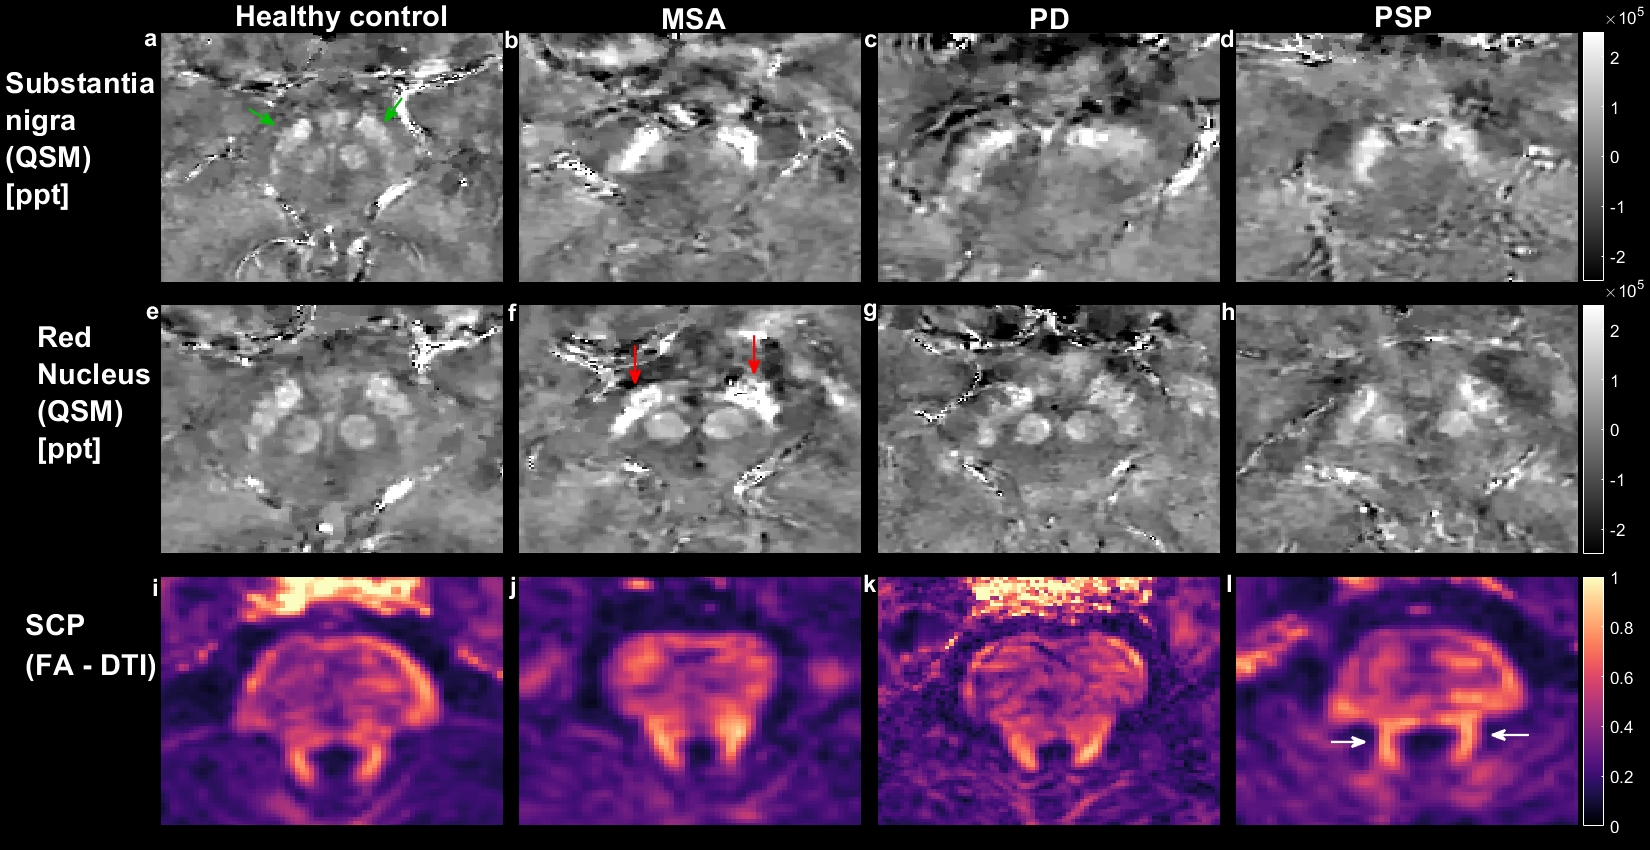
Figure 5 shows QSM and DTI based markers in the brainstem and superior cerebral peduncle (SCP). All window levels are consistent as these are quantitative images. Increased susceptibility can be seen in the substantia nigra (SN) (7,10) of all patients compared to the healthy control (rule #1).
Increased susceptibility in the subthalamic nucleus (STN) (14,15) is seen in the MSA patient in comparison with the healthy control and PD patient, in agreement with decision rule #6. Reduction in FA in the SCP (13) cannot be confirmed without quantitative analysis, (rule #4).
Discussion
We propose a decision tree and an MRI protocol to differentially diagnosing atypical parkinsonisms (Figure 1), based on published literature with sensitivities and specificities around or above 80% (Figure 2). The dedicated parkinsonism protocol will be tested on diagnosed patients as well as patients with an unclear clinical presentation at the time of the MRI scan. Leng et al. (19) showed promising results using a similar stratified approach based using data from diagnosed patients. This work’s novelty is to apply such an approach at an early-stage when the clinical diagnosis is unclear.Initial in-vivo data show promising qualitative results for performing differentiation on diagnosed patients in agreement with existing literature. Future work will compare results on early-stage patients for whom the diagnosis is unclear. Further image analysis is required to report quantitative comparisons.
Conclusion
We present a decision tree, dedicated MRI protocol and example data for differentially diagnosing atypical parkinsonisms using quantitative MRI.Acknowledgements
This project was sponsored by a research grant from Parkinson NL.
This project was funded by Erasmus MC - TU Delft Convergence for health and technology.
References
1. Bae YJ, Kim JM, Sohn CH, Choi JH, Choi BS, Song YS, Nam Y, Cho SJ, Jeon B, Kim JH. Imaging the Substantia Nigra in Parkinson Disease and Other Parkinsonian Syndromes. Radiology 2021;300(2):260-278.
2. Chougar L, Pyatigorskaya N, Degos B, Grabli D, Lehericy S. The Role of Magnetic Resonance Imaging for the Diagnosis of Atypical Parkinsonism. Front Neurol 2020;11:665.
3. Schwarz ST, Afzal M, Morgan PS, Bajaj N, Gowland PA, Auer DP. The 'swallow tail' appearance of the healthy nigrosome - a new accurate test of Parkinson's disease: a case-control and retrospective cross-sectional MRI study at 3T. PLoS One 2014;9(4):e93814.
4. Cheng Z, Zhang J, He N, Li Y, Wen Y, Xu H, Tang R, Jin Z, Haacke EM, Yan F, Qian D. Radiomic Features of the Nigrosome-1 Region of the Substantia Nigra: Using Quantitative Susceptibility Mapping to Assist the Diagnosis of Idiopathic Parkinson's Disease. Front Aging Neurosci 2019;11:167.
5. Ohtsuka C, Sasaki M, Konno K, Kato K, Takahashi J, Yamashita F, Terayama Y. Differentiation of early-stage parkinsonisms using neuromelanin-sensitive magnetic resonance imaging. Parkinsonism Relat Disord 2014;20(7):755-760.
6. Matsuura K, Maeda M, Yata K, Ichiba Y, Yamaguchi T, Kanamaru K, Tomimoto H. Neuromelanin magnetic resonance imaging in Parkinson's disease and multiple system atrophy. Eur Neurol 2013;70(1-2):70-77.
7. Quattrone A, Morelli M, Nigro S, Quattrone A, Vescio B, Arabia G, Nicoletti G, Nistico R, Salsone M, Novellino F, Barbagallo G, Le Piane E, Pugliese P, Bosco D, Vaccaro MG, Chiriaco C, Sabatini U, Vescio V, Stana C, Rocca F, Gulla D, Caracciolo M. A new MR imaging index for differentiation of progressive supranuclear palsy-parkinsonism from Parkinson's disease. Parkinsonism Relat Disord 2018;54:3-8.
8. Quattrone A, Nicoletti G, Messina D, Fera F, Condino F, Pugliese P, Lanza P, Barone P, Morgante L, Zappia M, Aguglia U, Gallo O. MR imaging index for differentiation of progressive supranuclear palsy from Parkinson disease and the Parkinson variant of multiple system atrophy. Radiology 2008;246(1):214-221.
9. Moller L, Kassubek J, Sudmeyer M, Hilker R, Hattingen E, Egger K, Amtage F, Pinkhardt EH, Respondek G, Stamelou M, Moller F, Schnitzler A, Oertel WH, Knake S, Huppertz HJ, Hoglinger GU. Manual MRI morphometry in Parkinsonian syndromes. Mov Disord 2017;32(5):778-782.
10. Mangesius S, Hussl A, Krismer F, Mahlknecht P, Reiter E, Tagwercher S, Djamshidian A, Schocke M, Esterhammer R, Wenning G, Muller C, Scherfler C, Gizewski ER, Poewe W, Seppi K. MR planimetry in neurodegenerative parkinsonism yields high diagnostic accuracy for PSP. Parkinsonism Relat Disord 2018;46:47-55.
11. Du G, Lewis MM, Kanekar S, Sterling NW, He L, Kong L, Li R, Huang X. Combined Diffusion Tensor Imaging and Apparent Transverse Relaxation Rate Differentiate Parkinson Disease and Atypical Parkinsonism. AJNR Am J Neuroradiol 2017;38(5):966-972.
12. Nicoletti G, Tonon C, Lodi R, Condino F, Manners D, Malucelli E, Morelli M, Novellino F, Paglionico S, Lanza P, Messina D, Barone P, Morgante L, Zappia M, Barbiroli B, Quattrone A. Apparent diffusion coefficient of the superior cerebellar peduncle differentiates progressive supranuclear palsy from Parkinson's disease. Mov Disord 2008;23(16):2370-2376.
13. Planetta PJ, Ofori E, Pasternak O, Burciu RG, Shukla P, DeSimone JC, Okun MS, McFarland NR, Vaillancourt DE. Free-water imaging in Parkinson's disease and atypical parkinsonism. Brain 2016;139(Pt 2):495-508.
14. Mazzucchi S, Frosini D, Costagli M, Del Prete E, Donatelli G, Cecchi P, Migaleddu G, Bonuccelli U, Ceravolo R, Cosottini M. Quantitative susceptibility mapping in atypical Parkinsonisms. Neuroimage Clin 2019;24:101999.
15. Sjostrom H, Granberg T, Westman E, Svenningsson P. Quantitative susceptibility mapping differentiates between parkinsonian disorders. Parkinsonism Relat Disord 2017;44:51-57.
16. Worker A, Blain C, Jarosz J, Chaudhuri KR, Barker GJ, Williams SC, Brown RG, Leigh PN, Dell'Acqua F, Simmons A. Diffusion tensor imaging of Parkinson's disease, multiple system atrophy and progressive supranuclear palsy: a tract-based spatial statistics study. PLoS One 2014;9(11):e112638.
17. Liu J, Liu T, de Rochefort L, Ledoux J, Khalidov I, Chen W, Tsiouris AJ, Wisnieff C, Spincemaille P, Prince MR, Wang Y. Morphology enabled dipole inversion for quantitative susceptibility mapping using structural consistency between the magnitude image and the susceptibility map. Neuroimage 2012;59(3):2560-2568.
18. Andersson JLR, Sotiropoulos SN. An integrated approach to correction for off-resonance effects and subject movement in diffusion MR imaging. Neuroimage 2016;125:1063-1078.
19. Leng Y, Liu X, Geng D, Liu F, Wu P-Y, Li Y, Yang L. Stratified Parkinsonism classification based on multi-modality MRI. Proc. Intl. Soc. Mag. Reson. Med. 30. 2951. 2022.
Figures