2271
Accurate and quantitative assessment of rheumatoid joint synovitis based on DCE-MRI pixel-level analysis
Jinling Mao1, Zhongqi Zhu1, Yinghao Li1, Hongzhi Wang1, and Jie Shi2
1East China Normal University, Shanghai, China, 2Shanghai Guanghua Hospital of Integrated Traditional Chinese and Western Medicine, Shanghai, China
1East China Normal University, Shanghai, China, 2Shanghai Guanghua Hospital of Integrated Traditional Chinese and Western Medicine, Shanghai, China
Synopsis
Keywords: Vessels, Inflammation, synovitis;Pannus;Wrist joint
In this paper, 18 cases of wrist magnetic resonance enhancement were collected, a pixel-by-pixel time-intensity curves (TIC) analysis method was proposed, four types of enhancement curves were customized, and compared with the synovitis score, the results showed that the area of the rapidly rising and descending pixel area was extremely correlated with the synovitis score (r=0.812).Introduction
Rheumatoid arthritis (RA) is a chronic systemic autoimmune disease characterized by synovitis that primarily affects peripheral joints1. Failure to treat in time can lead to advanced articular cartilage destruction, bone erosion, joint space narrowing or even disappearance to form joint rigidity and disability2. Villi, or vascular pannus, is the pathological basis for joint destruction, joint deformity, and dysfunction. According to the degree of activity or vascularization of RA synovitis, it can be divided into inflammatory pannus, mixed pannus and fibrous pannus3. MRI signal and intensification of synovial pannus are highly related to the degree of internal vascularization and fibrosis, and the shape and number of pannus are related to the severity of disease. So, Quantitative evaluation on synovitic pannus benefits assessing the severity of patients with RA and subsequent treatment.Methods
Wrist joints of eighteen patients with clinically pathologically confirmed RA were examinated using DCE-MRI, and the augmented image of the fourth time phase was uniformly profiled for ROI. Spearman correlation analysis was used to evaluate the correlation between the time-intensity curves (TIC) parameters ((early enhancement rate (MSI), reinforcement amplitude difference (MSD), peak time (TTP), and tail tangent slope of the fitted curve (RelFs)) to determine their independent characteristics. These features were used to customize the Type 4 curve (Figure 1). The pannus area of the 4 curves was calculated and compared with the gold standard method of RAMIS score to determine TIC curve characteristics that were most correlated with the synovitis scores4,5.Results
There was a significantly positive correlation between MSI and MSD, and the pixel area with the rapidly rising and descending features showed an high correlation with the synovitis score (r=0.812) (Table 1). That is, for the dynamic enhanced MRI image, the TIC with the rapidly rising and descending area just reflects the synovitis vascular pannus type. The vascular pannus area was calculated for three types of cases (Table 2), and two-dimensionally visualized (figure 3).Conclusion
For dynamic enhanced MRI images, TIC with rapidly rising and descending area has a high correlation with synovitis score, reflecting the type of synovitic pannus. Our Pixel-level TIC method can be utilized to quantify inflammatory pannus area, benefiting the diagnosis of disease severity and medication treatment of RA patients.Acknowledgements
This project is supported by National Natural Science Foundation of China(61731009)and Budgeted project of Shanghai University of Traditional Chinese Medicine(2020LK085)References
1, Zhang B, Xiao L, Zhou H, et al. Application of Dynamic Contrast-Enhanced MRI in the Diagnosis of Rheumatoid Arthritis [J]. Contrast Media & Molecular Imaging, 2022, 2022.2, FU Lihui, LI Hui, WANG Bo, et al. Value of 3D LAVA dynamic enhancement in determining the disease progression of rheumatoid arthritis[J]. Chinese Journal of Clinical Medical Imaging, 2014, 25(2): 5.
3, König H, Sieper J, Wolf K-J. Rheumatoid arthritis: evaluation of hypervascular and fibrous pannus with dynamic MR imaging enhanced with Gd-DTPA [J]. Radiology, 1990, 176(2): 473-7.
4, McQueen F, Lassere M, Edmonds J, et al. OMERACT Rheumatoid Arthritis Magnetic Resonance Imaging Studies. Summary of OMERACT 6 MR Imaging Module [J]. The Journal of rheumatology, 2003, 30(6): 1387-92.
5, Østergaard M, Edmonds J, McQueen F, et al. An introduction to the EULAR–OMERACT rheumatoid arthritis MRI reference image atlas [J]. Annals of the rheumatic diseases, 2005, 64(suppl 1): i3-i7.
Figures
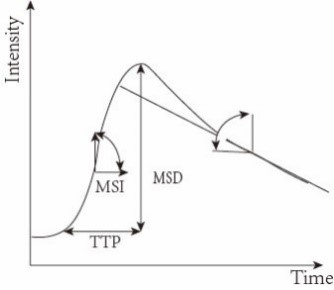
Figure 1 Feature parameter definition
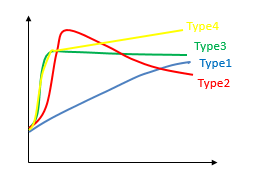
Figure 2 TIC classification diagram

Fig. 3 (a), (b), (c) are the ROI vascular pannus of the case 121611, (d), (e), (f) are the ROI vascular pannus of the case 271455, (g), (h), (i) are the ROI vascular pannus of the case 275245, where the area occupied by each type and the RAMIS score are given in Table 5, and it can be seen from the table and graph that with the higher the RAMIS score, the more area occupied by the red area, that is, type 2 inflammatory pannus.
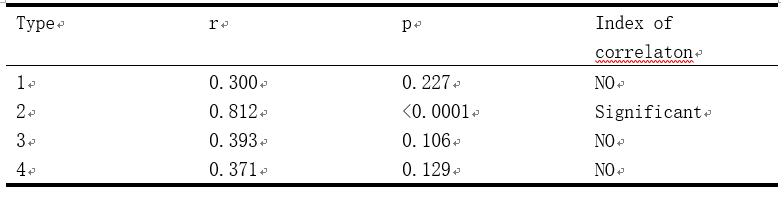
Table 1 Correlation analysis table between each curve and RAMIS score diagram
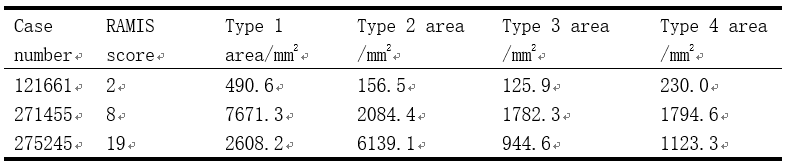
Table 2 The area occupied by each type of vascular pannus is displayed
DOI: https://doi.org/10.58530/2023/2271