2266
Evaluating age-related changes of vascular function and oxidative energy metabolism in the lower leg during a plantar flexion exercise
Alfredo Liubomir Lopez Kolkovsky1, Béatrice Matot1, Harmen Reyngoudt1, Benjamin Marty1, Ericky Caldas de Almeida Araujo1, and Yves Fromes1
1NMR Laboratory , Neuromuscular Investigation Center, Institute of Myology, Paris Cedex 13, France
1NMR Laboratory , Neuromuscular Investigation Center, Institute of Myology, Paris Cedex 13, France
Synopsis
Keywords: Muscle, Aging, Multi-contrast, Metabolism, Non-proton, Spectroscopy
The age-related loss of muscle mass, strength and quality is a multifactorial process whose mechanisms are incompletely understood. NMR allows investigating numerous physiological and biochemical variables in vivo dynamically. Here, 51 physically active subjects performed a normalized plantar flexion exercise to evaluate vascular response (blood flow, T2*, water compartmentalization), tissue oxygenation and oxidative energy metabolism (pH, mitochondrial oxidative capacity, work to [ADP] ratio). Results showed that the vascular and metabolic function was preserved in old subjects relative to young and middle-aged participants. We conclude that vascular and oxidative metabolism impairments are not a necessary condition of old age.Purpose
The age-related loss of muscle mass, strength and quality is a multifactorial process whose mechanisms are incompletely understood. NMR allows investigating numerous physiological and biochemical variables in vivo during a dynamic paradigm. For instance, tissue blood flow and blood oxygen level dependent contrast effects can be mapped dynamically, and tissue oxygenation and high-energy phosphates turnover can be monitored using 1H and 31P MRS, respectively. Mitochondrial ATP production rate and ADP-control can also be monitored by quantifying the work performed. Here, we applied a multi-nuclear interleaved measurements to evaluate age-related changes of these functional parameters in the lower leg and performed multi-compartment T2 measurements to evaluate changes in water compartments in response to an exerciseMethods
Experimental SetupExperiments were done at 3T on 51 healthy volunteers (28 women, aged from 20 to 81 y.o). The RF coil used (RAPID Biomedical) combined a 1H birdcage transmitter, a 18Rx phased-array receiver and a 31P 1Tx/3Rx semi-cylindrical transceiver.
Exercise paradigm
Plantar flexions were performed every 2.5 s for 13 min, increasing the load every minute from 10% to 25% of the maximum voluntary torque. An ergometer interfaced with LabView (v2014, National Instruments) was employed and work values were recorded. Dynamic NMR lasted 25 min, starting 2 min before the exercise onset.
Interleaved NMR
An interleaved 1H/31P pulse sequence1 (fig.2A) consecutively acquired, every 2.5 s, a non-localized 31P spectrum, a 1H spectrum for desaturated myoglobin (dMb) detection, followed by colocalized radially-encoded Golden-Angle perfusion-weighted2 and T2*-weighted images.
Multi-compartment T2
A fat-suppressed ISIS-CPMG acquisition measured the water T2 decay3 (150 echoes, 2.5 ms inter-echo spacing, 35x35x35 mm3 voxel, TR=9 s, 2m42s acquisition time) before the exercise and at the 10th minute of recovery in the gastrocnemius medialis.
Data Analysis
Interleaved NMR
Data analysis was performed in Matlab as described elsewhere1. No motion correction was applied. T2* values were calculated using an exponential decay of the multi-echo GRE data. The rephosphorylation rate of phosphocreatine (PCr), τPCr, was estimated with an exponential function during exercise recovery. Adenosine diphosphate (ADP) was calculated assuming creatine kinase equilibrium4 (KCK):
[ADP]=[ATP]*([TCr]/[PCr]-1)/([H+]KCK))
where total creatine (TCr) and ATP were assumed 42.5 and 8.2 mM, respectively and KCK=1.66x10⁹ M-1.
A normalized work output per minute was calculated by dividing the measured work to the gastrocnemius muscle surface at its thickest section.
Multi-compartment T2
Water T2 times (T2-H2O) and their relative fractions were estimated using a non-negative least squares algorithm3 (480 ms upper limit). A short (<50 ms) and a long (>50 ms) T2-H2O component are reported.
Statistical analysis
Subjects were divided into groups: Young (GY, 20-35 y.o., n=13), Middle-aged (GM, 35-60 y.o., n=24) and Old (GO, above 60 y.o., n=14). Wilcoxon tests were used for pairwise group mean comparisons.
Results
Fig.1 shows the participants’ demographics. Fig.2 shows the time courses of the gastrocnemius and soleus blood perfusion and T2*; intracellular pH; PCr and Pi; and dMb signals. dMb was detected in 43±3% of the subjects in each group, consistent with a mild-to-moderate aerobic exercise. Few significant differences were found, notably the maximum pH reached during exercise was higher in GY than in GM; and resting T2* in soleus was higher in GY than in GO (fig.3A,B). No differences in τPCr were found (fig.3C). The end-of-exercise PCr depletion was borderline(p=0.057) lower in GO than in GM. For blood perfusion and T2* in the gastrocnemius, no age differences were found for peak recovery or end-of-exercise values. To evaluate the coupling between work and mitochondrial stimulation, the ratio between normalized work and [ADP] was estimated (fig.4). The Work/[ADP] ratio during the first minute was systematically higher, as expected from the initial PCr breakdown as energy buffer and early glycolytic pathway activation during exercise. For the remainder of the exercise, GM and GO showed stable values, while GY showed a trend of continuous decline until the 10th minute of exercise (fig.4). No significant Work/[ADP] differences were observed among the groups, suggesting no impaired control of oxidative activity with age4. The relative fractions of the long T2-H2O, the short T2-H2O and the long T2-H2O, showed no significant differences before and after exercise (fig.5A,B,C, respectively). Only the long T2-H2O fractions were larger in GO than in GY, both at rest and after exercise. By ignoring the extreme long T2-H2O that reached the model’s upper limit, then a significant increase of long T2-H2O in GO is found (fig.5D). This result should nevertheless be considered with caution.Discussion and Conclusion
Our results show that despite a tendency for a higher PCr depletion during exercise in GO relative to GY, no significant differences in vascular compartments, blood perfusion or oxydative energy metabolism were found between age groups during an aerobic, moderate and normalized exercise paradigm. In particular, no mitochondrial functional impairments were found, as shown by the similar τPCr and work/[ADP] ratios. This is in agreement with a previous study evaluating blood flow, tissue oxygenation and energy metabolism5 but in disagreement with a study evaluating energy metabolism and carnosine concentration7. Unlike the cited study6, our participants were physically active and no BMI differences were found, which correlates to aerobic capacity. Our results point that blood flow and oxidative energy metabolism impairments are not a necessary condition of ageing.Acknowledgements
No acknowledgement found.References
1.Lopez Kolkovsky et al., MRM. 2021; 86(1):115-130
2.Raynaud JS, Duteil S et al. MRM. 2001; 46: 305-311.
3.Araujo ECA et al., Biophys J. 2014; 106: 2267–2274
4.Kemp GJ, Ahmad RE, et al. Acta Physiol 2015, 213, 107-144
5.Hart CR et al., JGerontol A Biol Sci Med Sci. 2015; 70(9): 1067-76.
6.Krumpolec P et al., Front Physiol. 2020; 11: 644.
Figures
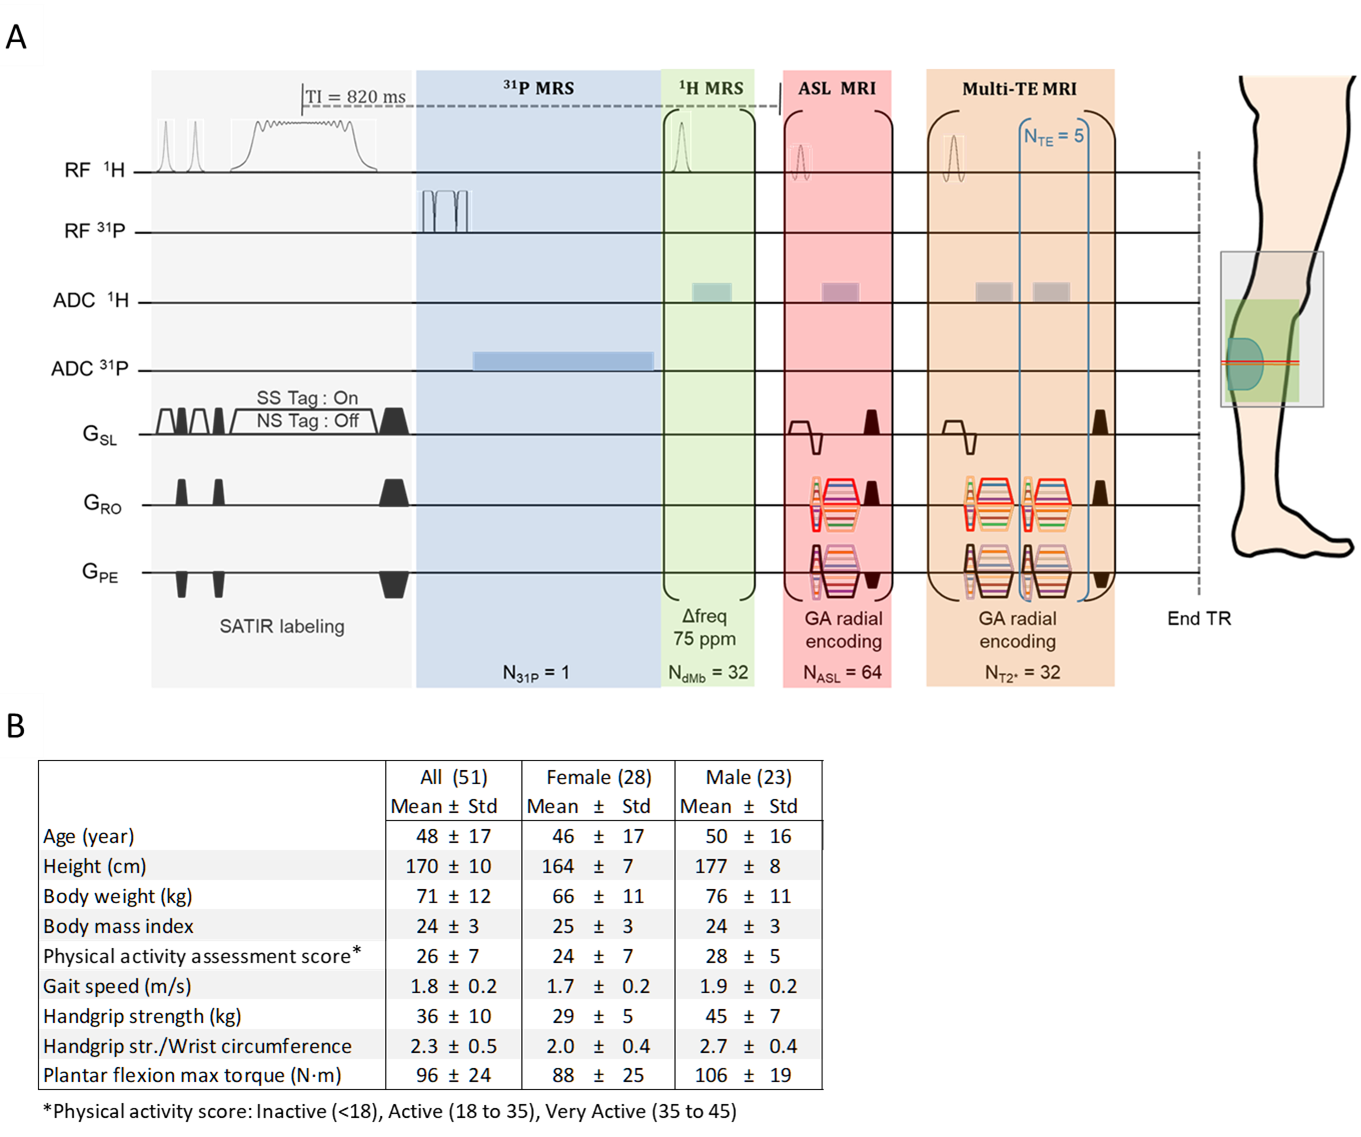
Figure 1. A) Interleaved pulse sequence diagram. Acquisition
parameters: TR= 2.5 s, 31P MRS: Pulse-acquire (FID), 1024
points, 4 kHz BW; 1H MRS: Pulse-acquire (FID), 32 averages,
256 points, 20 kHz BW, -75 ppm shift); 1H MRI:
8 mm slice thickness. Perfusion MRI: TE=2.59 ms, 1.6x1.6 mm² resolution,
128 points, 64 spokes; T2*-weighted MRI: TE:1.72/6.72/11.72/16.72/21.72/26.72
ms, 3.2x3.2 mm² resolution, 64 points, 32 spokes per TE. B) Participant demographics shown by gender. Physical
activity score was determined from a clinical questionnaire by a physician.
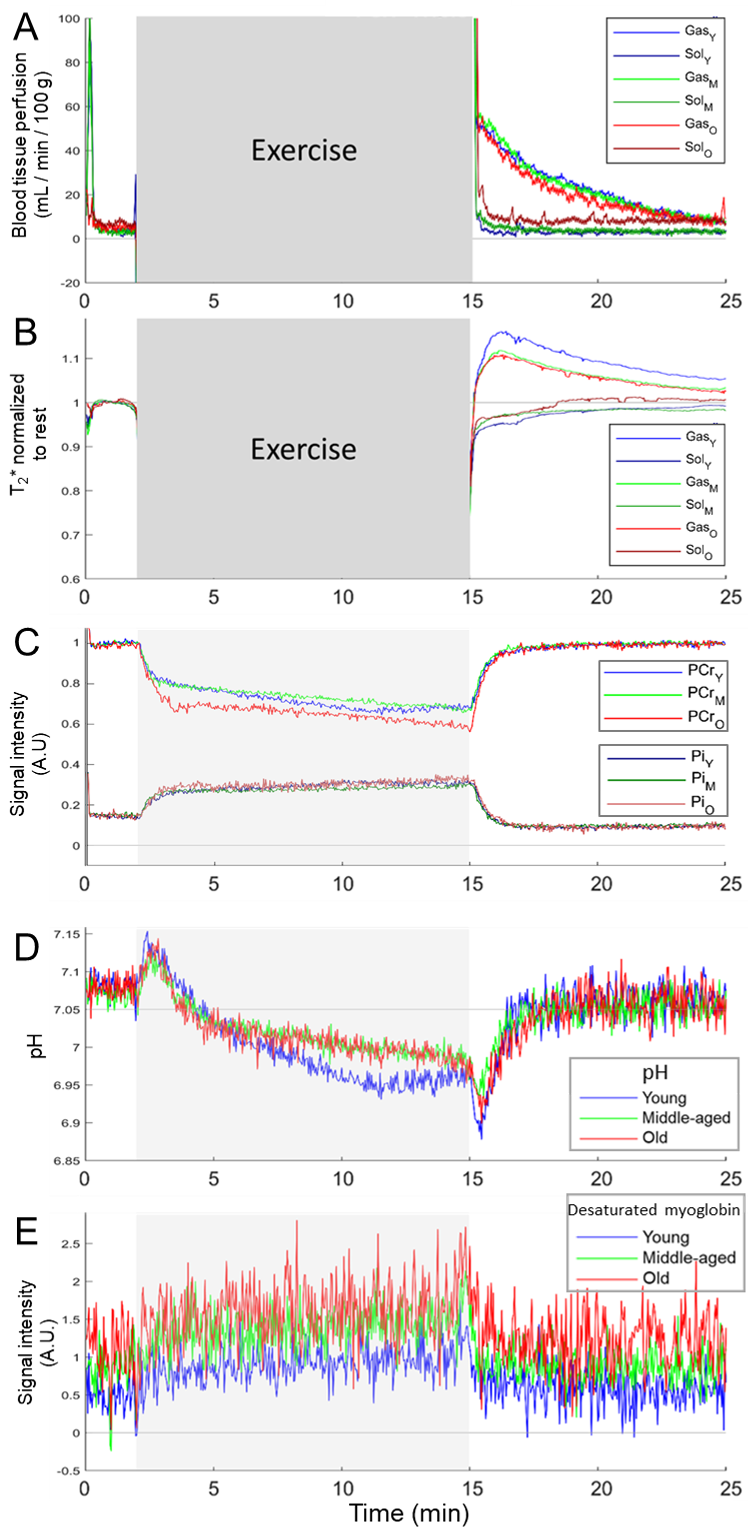
Figure 2. Multi-parametric
measurements in the lower leg shown for each age group. The exercise period is
shaded. Average A) blood perfusion and B)
T2* in the soleus and gastrocnemius; C) phosphocreatine
(PCr) and inorganic phosphate (Pi) signals normalized to baseline values; D)
Intracellular pH; E) deoxy-myoglobin signal. In E), only time courses where dMb was observed (43% of subjects) were included. Blood perfusion and T2* values measured during exercise
were considered unreliable and are not shown. For clarity, error bars are not
shown. Y = young, M =
middle-aged, O = old.
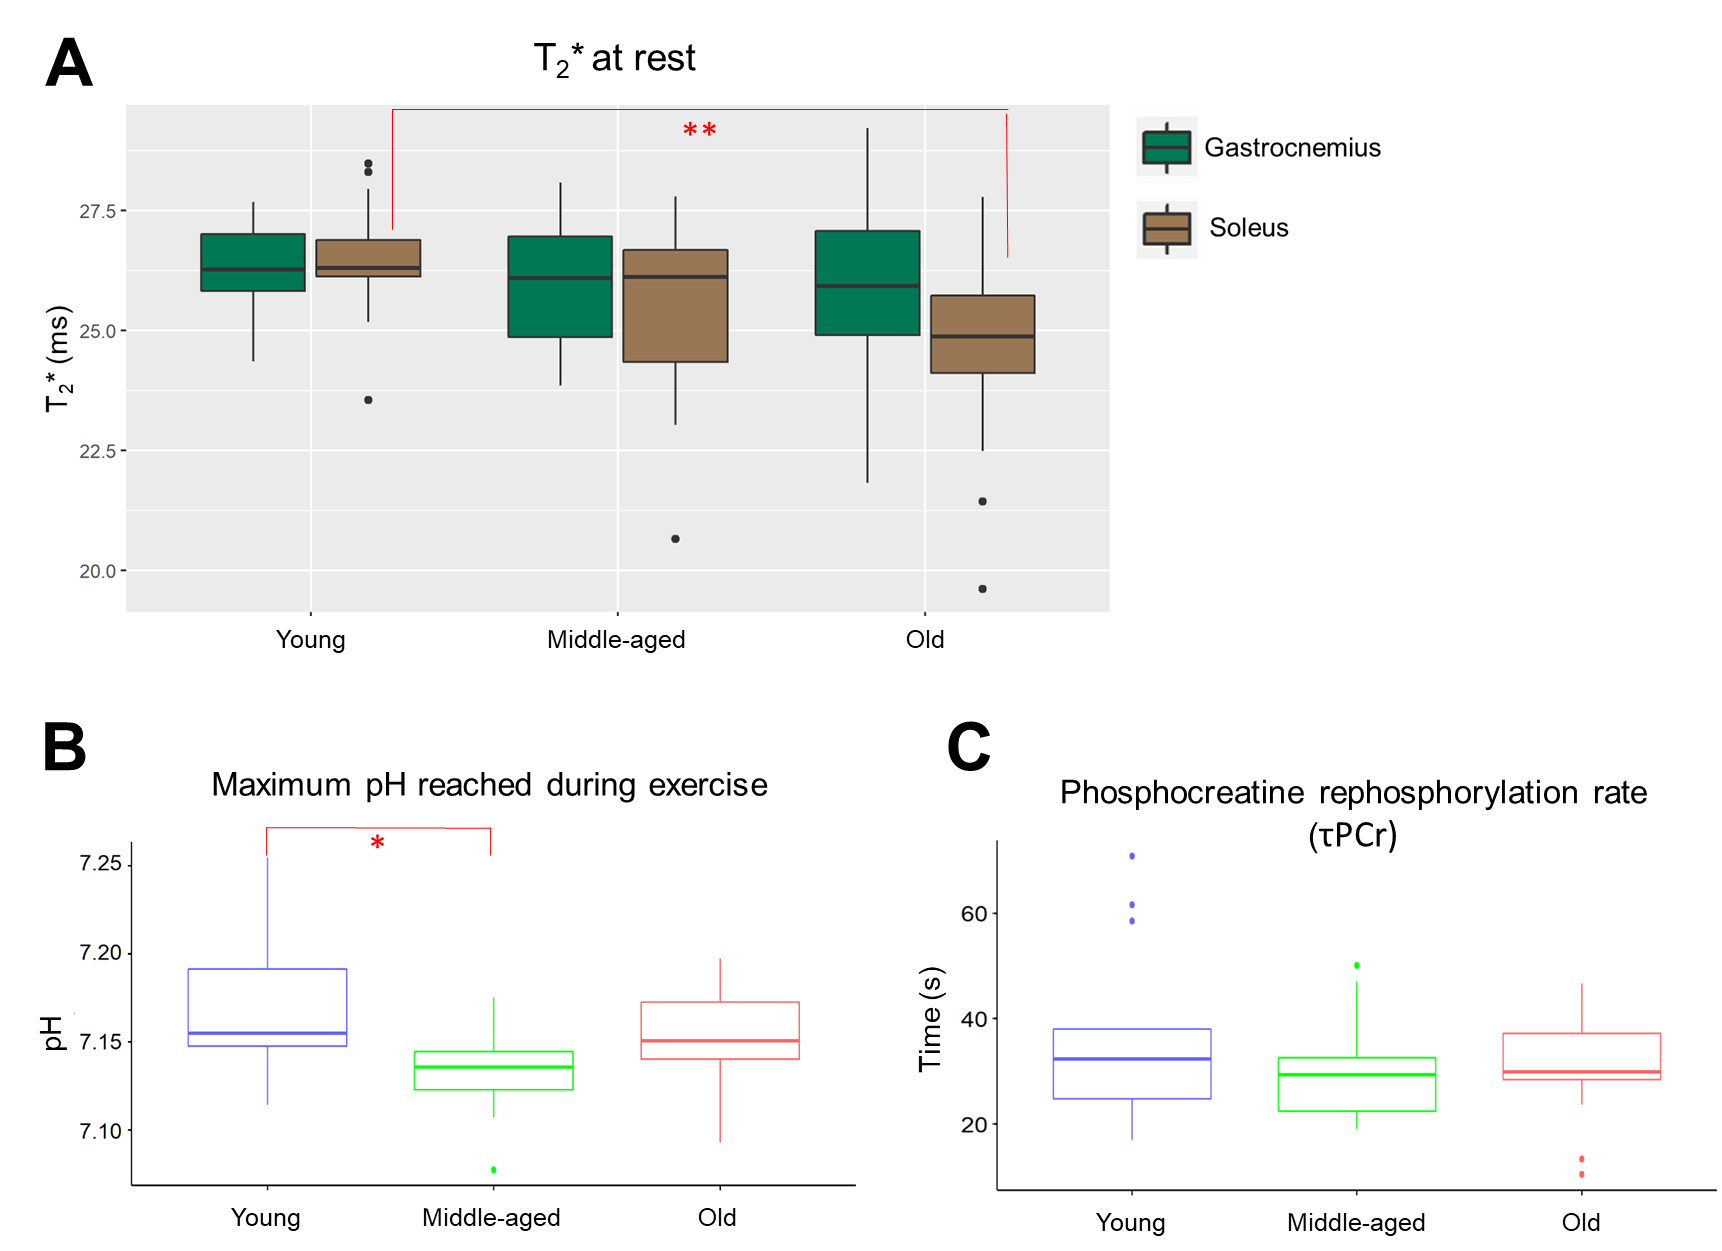
Figure 3. A) Boxplot of the average
T2* measured at rest in the gastrocnemius (GAS, dark green) and
soleus (SOL, brown) for each age group. For each group, no statistical
difference were found between GAS and SOL. A significant T2*
decrease was found between young and old in SOL. Boxplots of the (B) maximum pH reached during exercise
and the (C) rephosphorylation rate
of phosphocreatine (τPCr) per age group. *P <0.05, **P <0.005
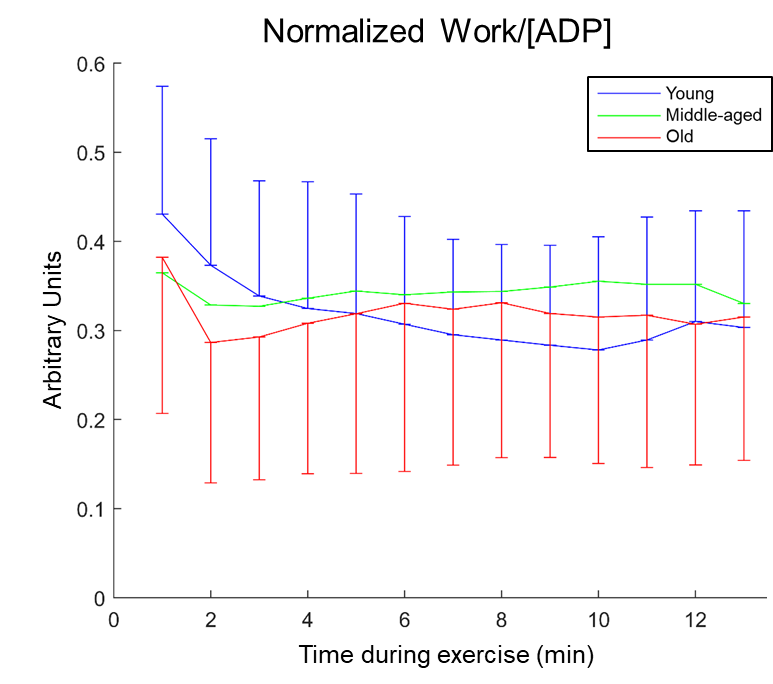
Figure 4. Ratio between the work normalized
to gastrocnemius surface area and the calculated adenosine diphosphate (ADP)
concentration, averaged for each minute of exercise. For clarity,
one-sided error bars (standard deviation) are shown only for the young and old
groups. No
significant differences were found. Y = young (blue), M = middle-aged (green), O = old
(red).
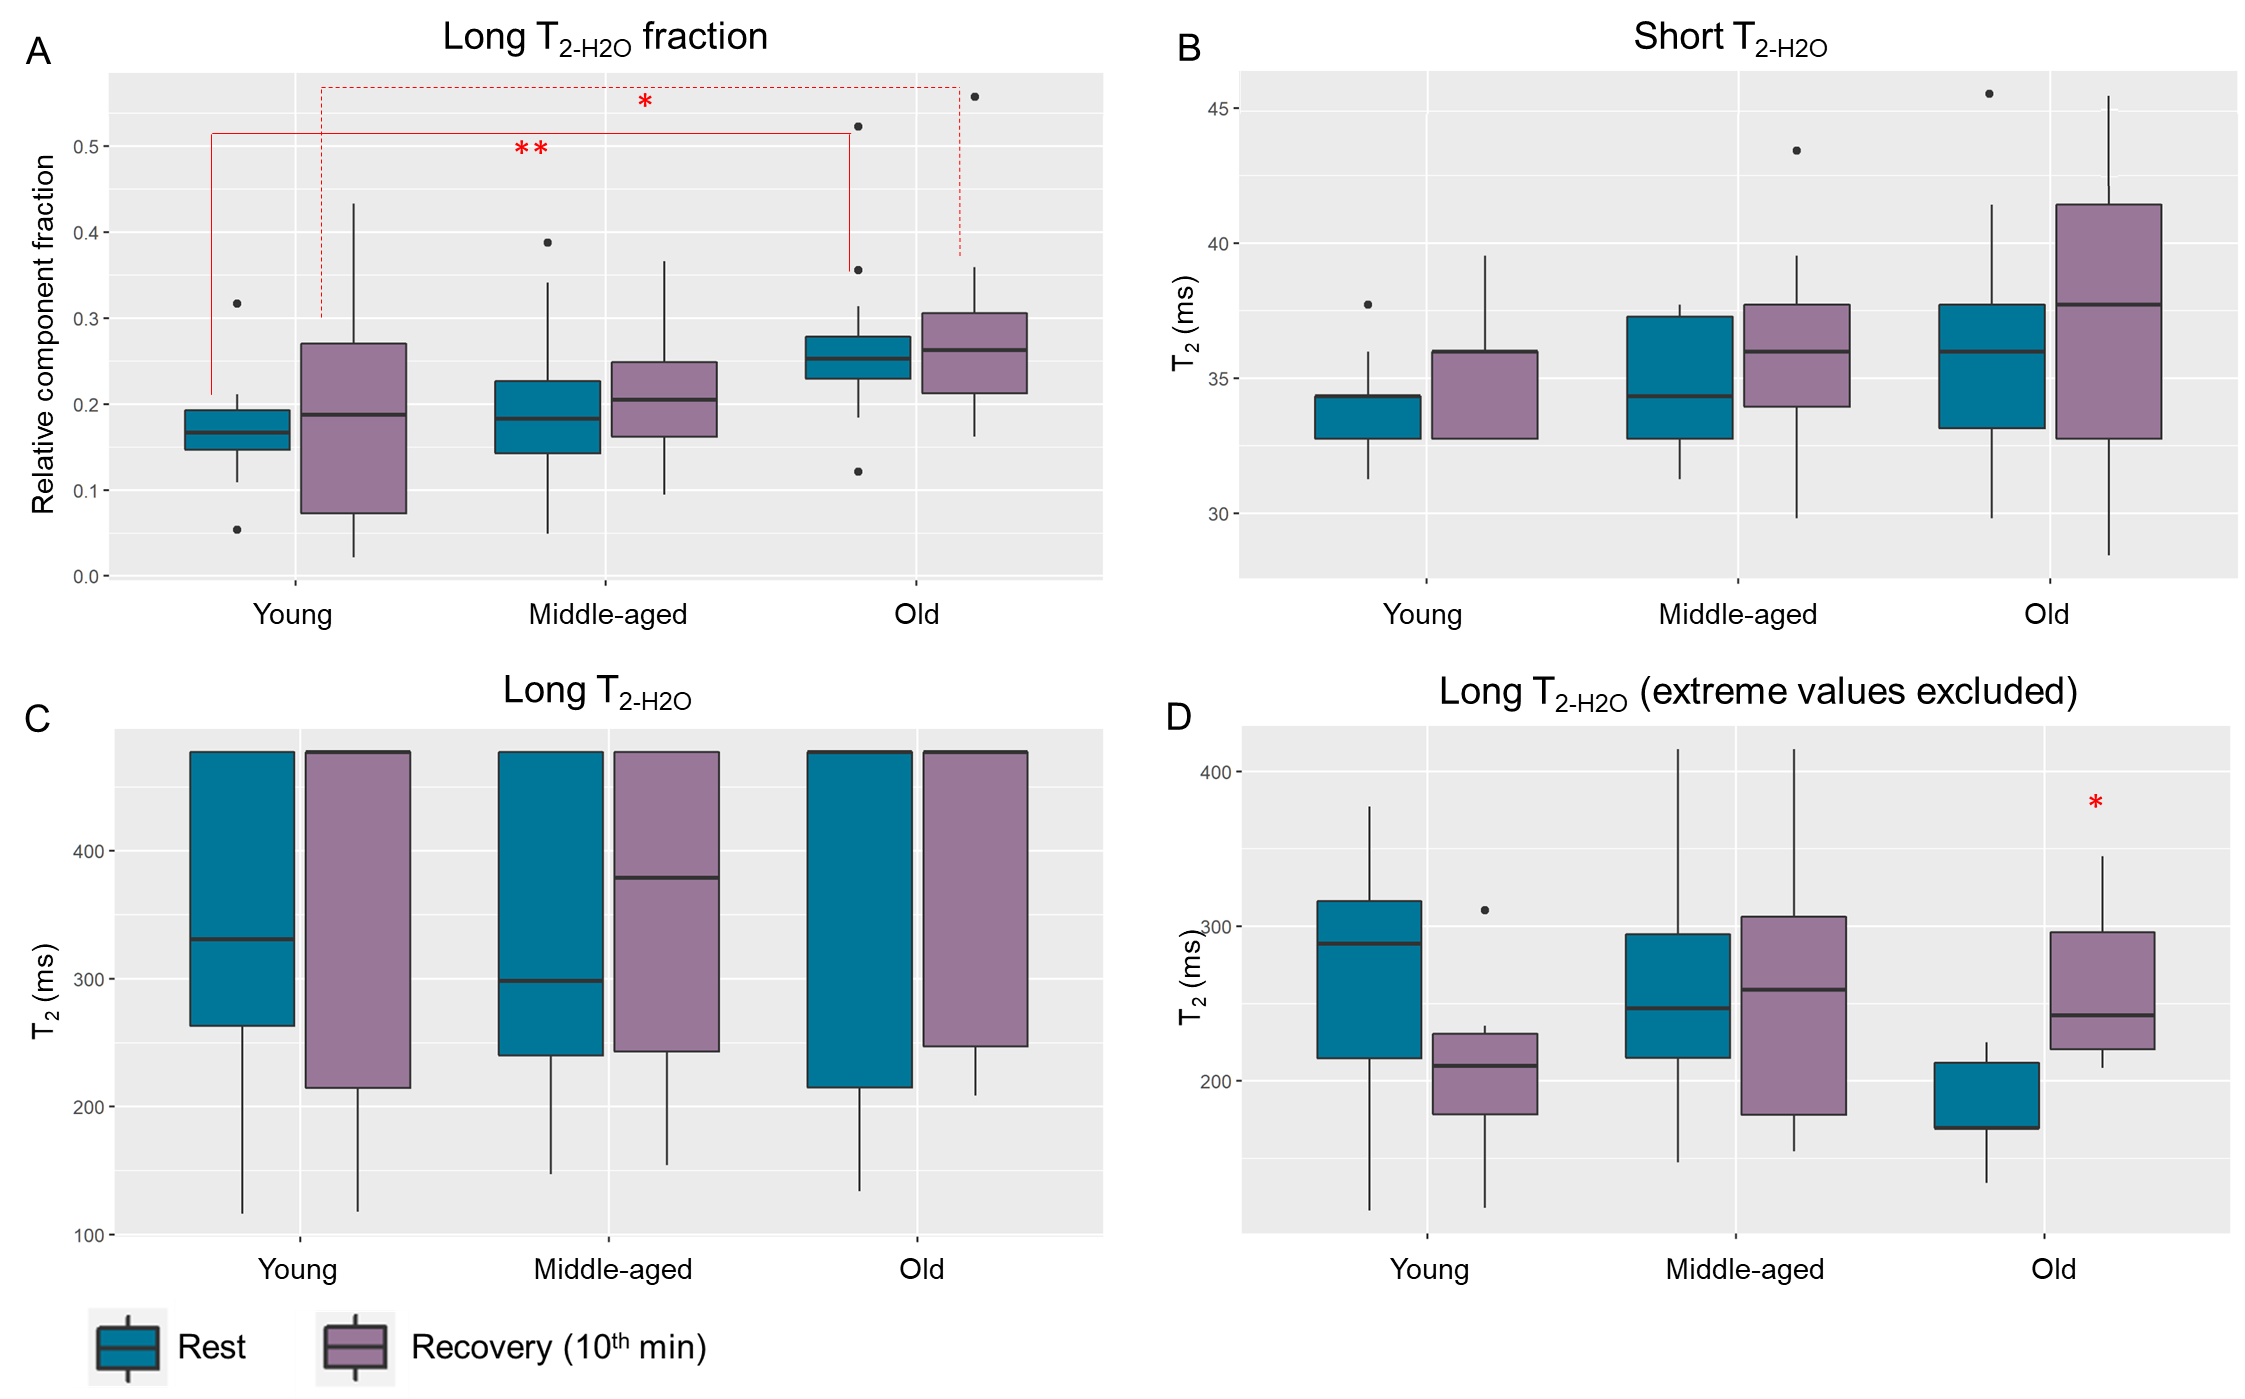
Figure 5. Boxplots of the (A)
relative fraction of the long T2-H2O-MRS component, the fitted (B) short and (C) long T2-H2O-MRS values, measured in the
gastrocnemius medialis during rest (green) and 10 minutes after the end of
exercise (brown). In (D), the analysis
done in (C) is repeated but the long T2-H2O-MRS values reaching the
upper limit of the fit (480 ms) were excluded. Significant differences were
found in (A) between young and old subjects (resting, recovery); and in D for
old subjects (resting vs recovery). *P <0.05, **P <0.005.
DOI: https://doi.org/10.58530/2023/2266