2263
Comparison of Penalty-based IVIM analysis Methods for Predicting Response to Neoadjuvant Chemotherapy in Osteosarcoma1Indian Institute of Technology Delhi, New Delhi, India, New Delhi, India, 2All India Institute of Medical Sciences, New Delhi, India, New Delhi, India
Synopsis
Keywords: MSK, Cancer, Intravoxel Incoherent motion, Chemotherapy response prediction, Performance comparison
Predictive performance of penalty-based IVIM analysis methodologies BE+TV and BE+HPF for response to Neoadjuvant Chemotherapy have been evaluated using clinical dataset with osteosarcoma in comparison with existing IVIM analysis methods. IVIM datasets before and after chemotherapy were analyzed using 5 IVIM analysis methods – Bi-exponential model and two of its segmented variants and penalty-based BE+TV and BE+HPF methods. Results showed, IVIM parameters estimated by BE+TV and BE+HPF methods produced improved prediction of response to chemotherapy in osteosarcoma than the existing IVIM analysis methods at both the time-points, before and after chemotherapy.Introduction
Penalty-based intravoxel incoherent motion (IVIM) analysis methods; bi-exponential model with adaptive Total Variation(TV) penalty function (BE+TV) and bi-exponential model with adaptive Huber penalty(HPF) function (BE+HPF); have shown improved IVIM parameters estimation in comparison to the conventional bi-exponential model1 and its variants using simulation datasets and empirical clinical datasets of bone tumor2. In this study, performance of BE+TV and BE+HPF methodologies for predicting response to neoadjuvant chemotherapy (NACT) has been compared with existing conventional IVIM analysis methodologies using clinical dataset of osteosarcoma.Materials and Methods
Dataset: IVIM MRI datasets of 35 patients (N=35,Age=17.6±2.4 years,M:F=25:10) with osteosarcoma were analyzed. All patients underwent 3 cycles of NACT consisting of Cisplatin and Doxorubicin at every 3 weeks3 followed by surgery. IVIM datasets were acquired at 1) Baseline and 2) after completion of chemotherapy(follow-up) using a 1.5 T Philips Achieva® scanner. IVIM MRI was acquired using free breathing Spin Echo-Echo Planar imaging at 11 b-values (0,10,20,30,40,50,80,100,200,400,800 s/mm2), with TR/TE=7541/67 msec, matrix-size=192×192 and slice thickness/Gap=5 mm/0.5 mm, field-of-view=250×250 mm2. Region of interest (ROI) for tumor volume was demarcated an expert radiologist (>12 years of experience in cancer imaging) thoroughly across the slices of DWI with b=800 covering the whole tumor.Gold standard for NACT response: Histological necrosis was evaluated in resected tumor. ≥50 necrosis was considered as good-responder and <50 necrosis was considered as poor-responder to chemotherapy according to Picci et al4.
Quantitative IVIM analysis: Quantitative IVIM parameters Diffusion coefficient (D), Perfusion coefficient (D*) and Perfusion fraction (f) were estimated in tumor volume at baseline and follow-up. Five different IVIM methodologies were used for parameter estimation as: exiting IVIM analysis methods a) Bi-exponential (BE) model, b) Segmented BE method with two-parameter fitting (BEseg-2), c) Segmented BE method with one-parameter fitting (BEseg-1) and penalty based IVIM methods d) BE+TV and e) BE+HPF. Apparent diffusion coefficient was estimated in tumor volume for completion.
Statistical analysis: Average values of quantitative parameters ADC,D,D*,f were evaluated in responder and non-responder groups at baseline and follow-up and compared using student-t test for statistical significance. Inter-scan comparison (between baseline and follow-up) of absolute mean of the quantitative parameters (ADC,D,D*,f) in tumor volume was performed using paired t-test. Receiver operating characteristics(ROC) curve analysis was used to evaluate the predictive performance of all five IVIM methods for NACT response in osteosarcoma at baseline and follow-up. Reproducibility of IVIM methodologies was evaluated using coefficient of variation(CV). A p-value<0.05 was considered as statistically significant.
Results
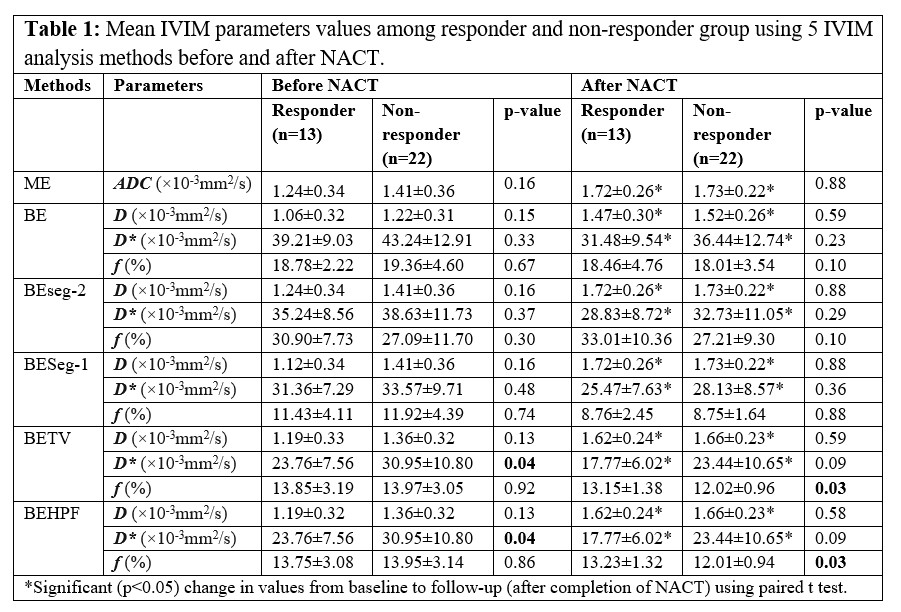
Table1 present the average parameter values in tumor volume evaluated using these five IVIM methodologies among responder and non-responder groups at baseline and follow-up. In responder group average D in tumor were comparatively lower than the non-responders (1.06-1.24×10⁻³mm2/s vs. 1.22-1.41×10⁻³mm2/s) at baseline and significantly increased after NACT (1.47-1.72×10⁻³mm2/s & 1.52-1.73×10⁻³mm2/s respectively). D values between responder and non-responder groups were not significantly different (p>0.05) at baseline and follow-up.At baseline, average D* in tumor among non-responders were comparatively higher than responders (30.95-42.24×10⁻³mm2/s vs. 23.76-39.21×10⁻³mm2/s) and significantly reduced after NACT (23.44-36.44×10⁻³mm2/s & 17.77-31.48×10⁻³mm2/s respectively). D* values between responder and non-responder groups were not significantly different (p>0.5) for all other methods except BE+TV and BE+HPF at baseline (23.76±7.56×10⁻³mm2/s vs 30.95±10.80×10⁻³mm2/s;p=0.04).
In responder and non-responder groups average f in tumor at baseline were in the range 11.43%-30.9% and 11.92%-19.36% respectively and did not change significantly after NACT (8.76%-33.01% and 8.75%-27.21% respectively). Average f values between responder and non-responder groups were not significantly different (p>0.5) for all other methods except BE+TV and BE+HPF at follow-up (13.2±1.3% vs 12.0±0.9%;p=0.03).
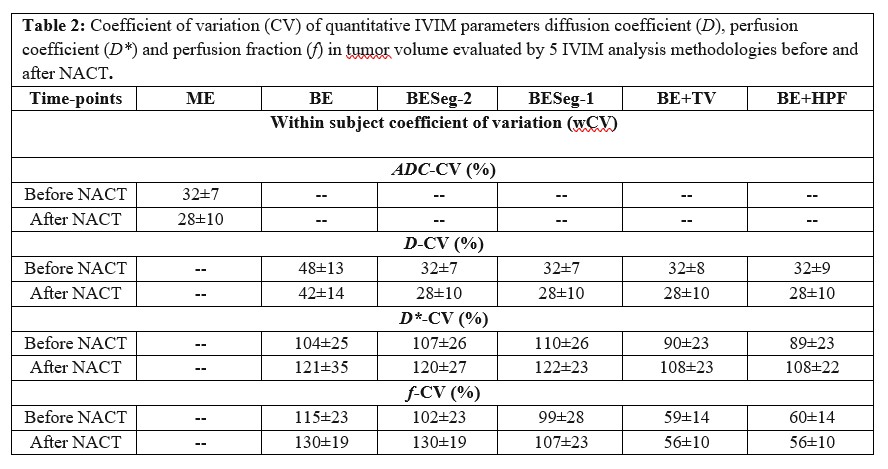
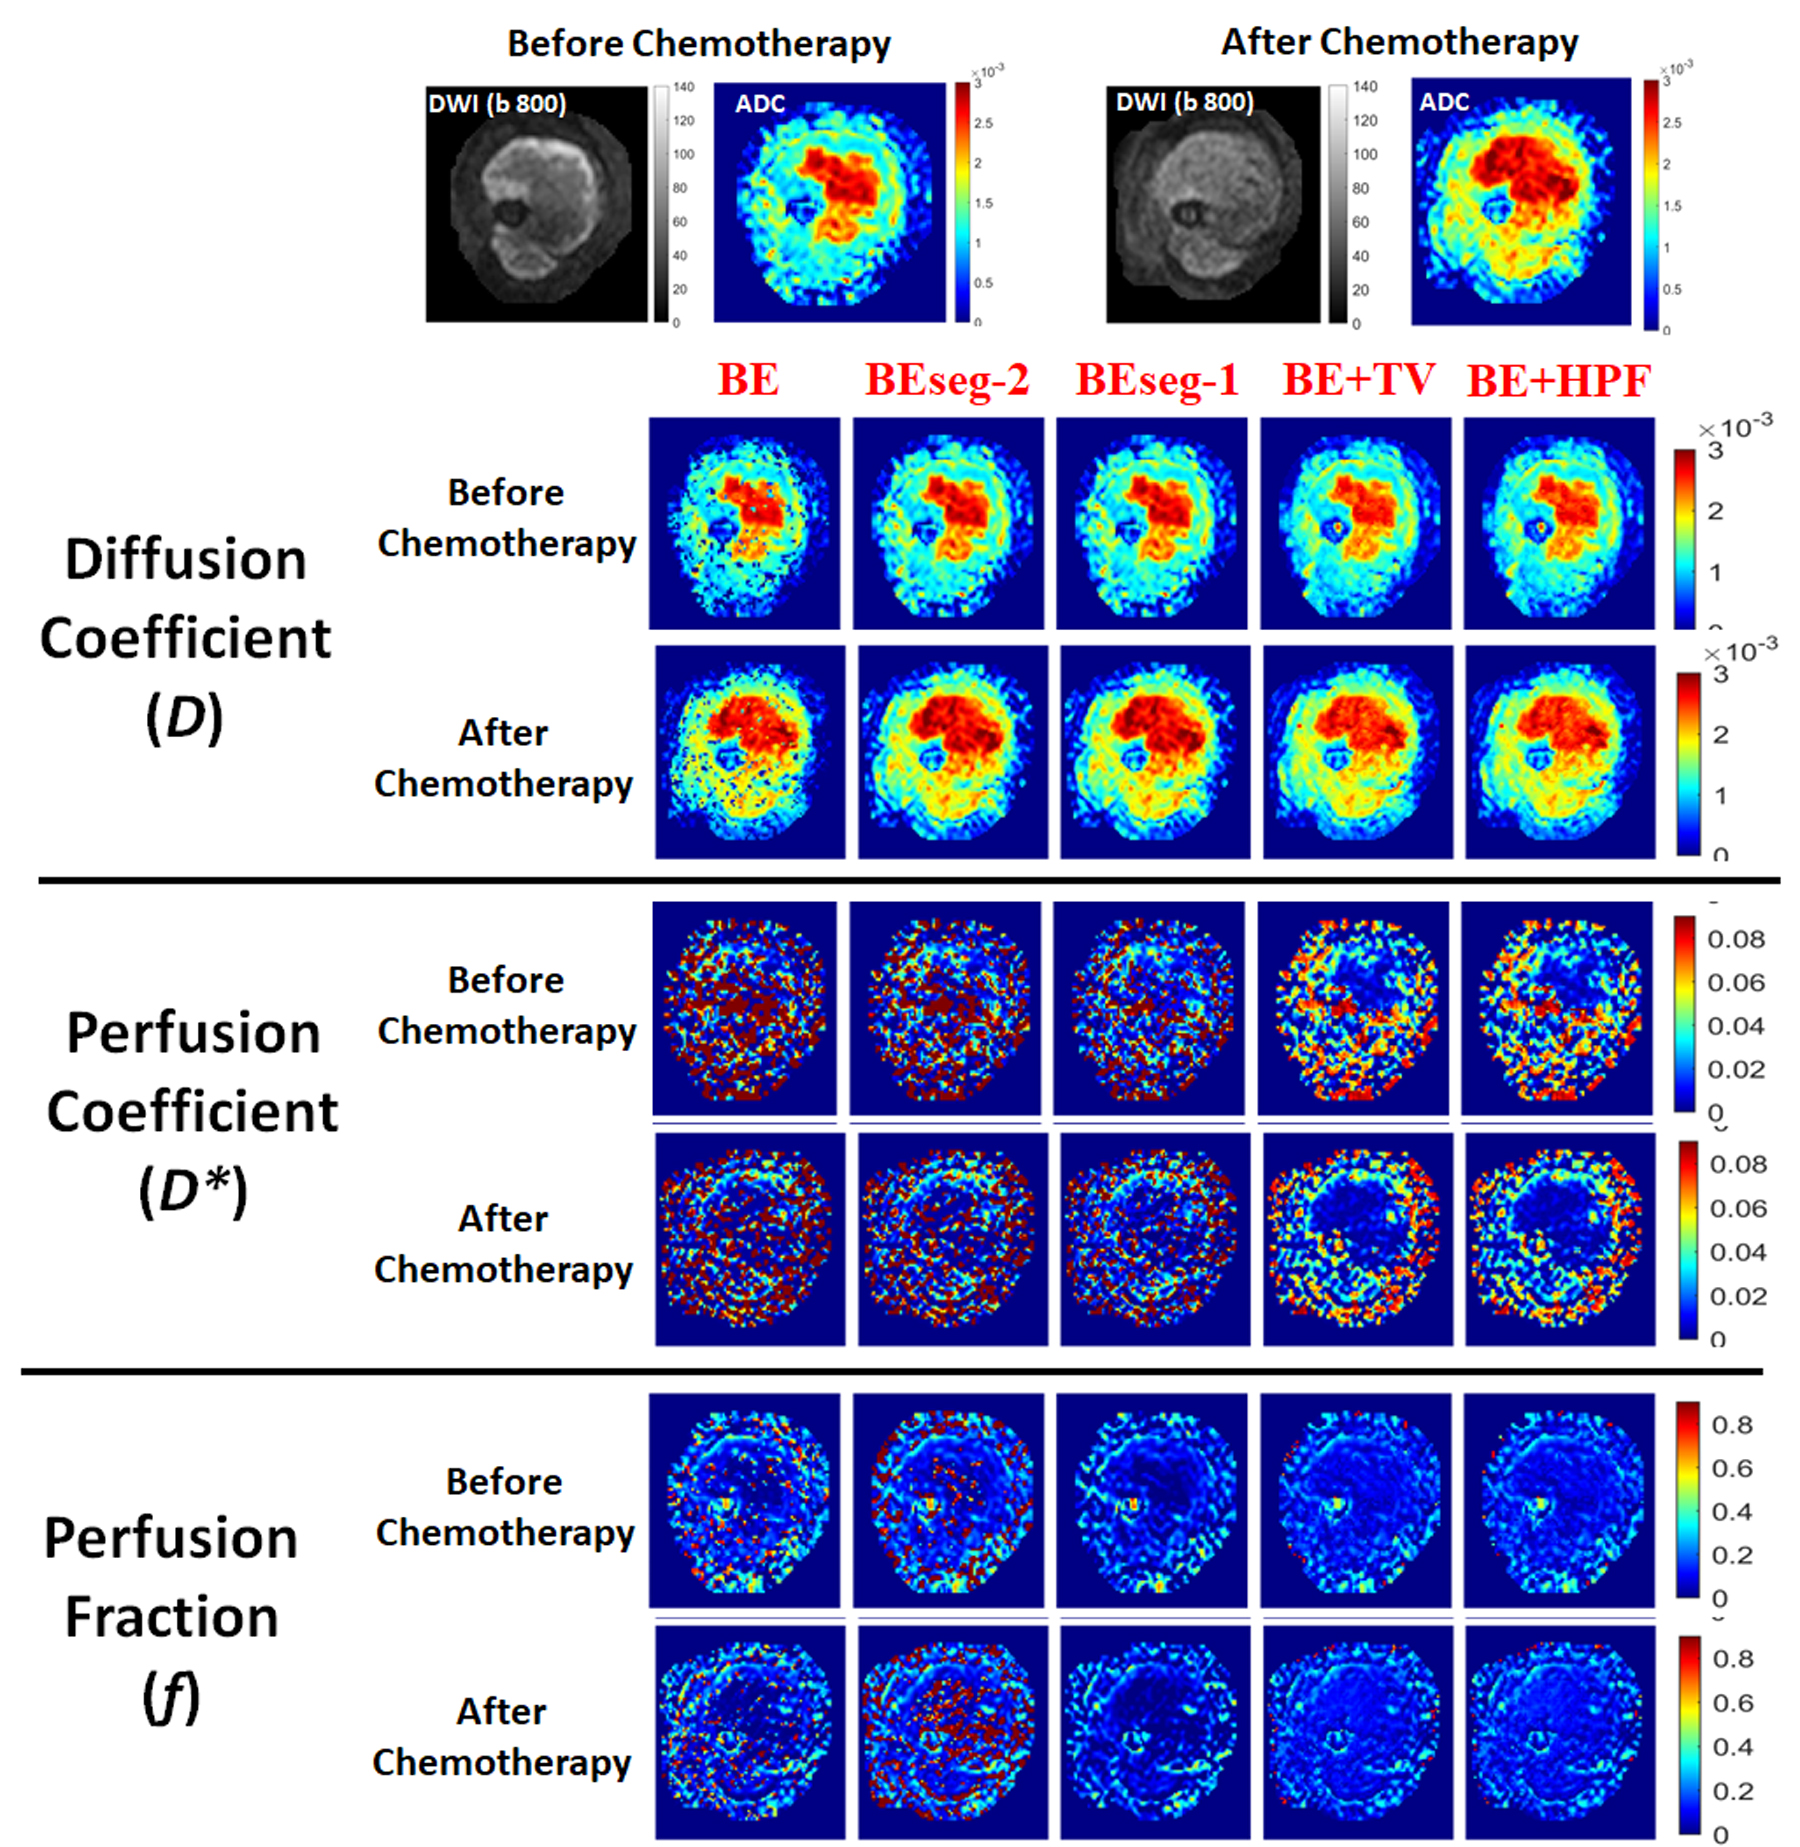
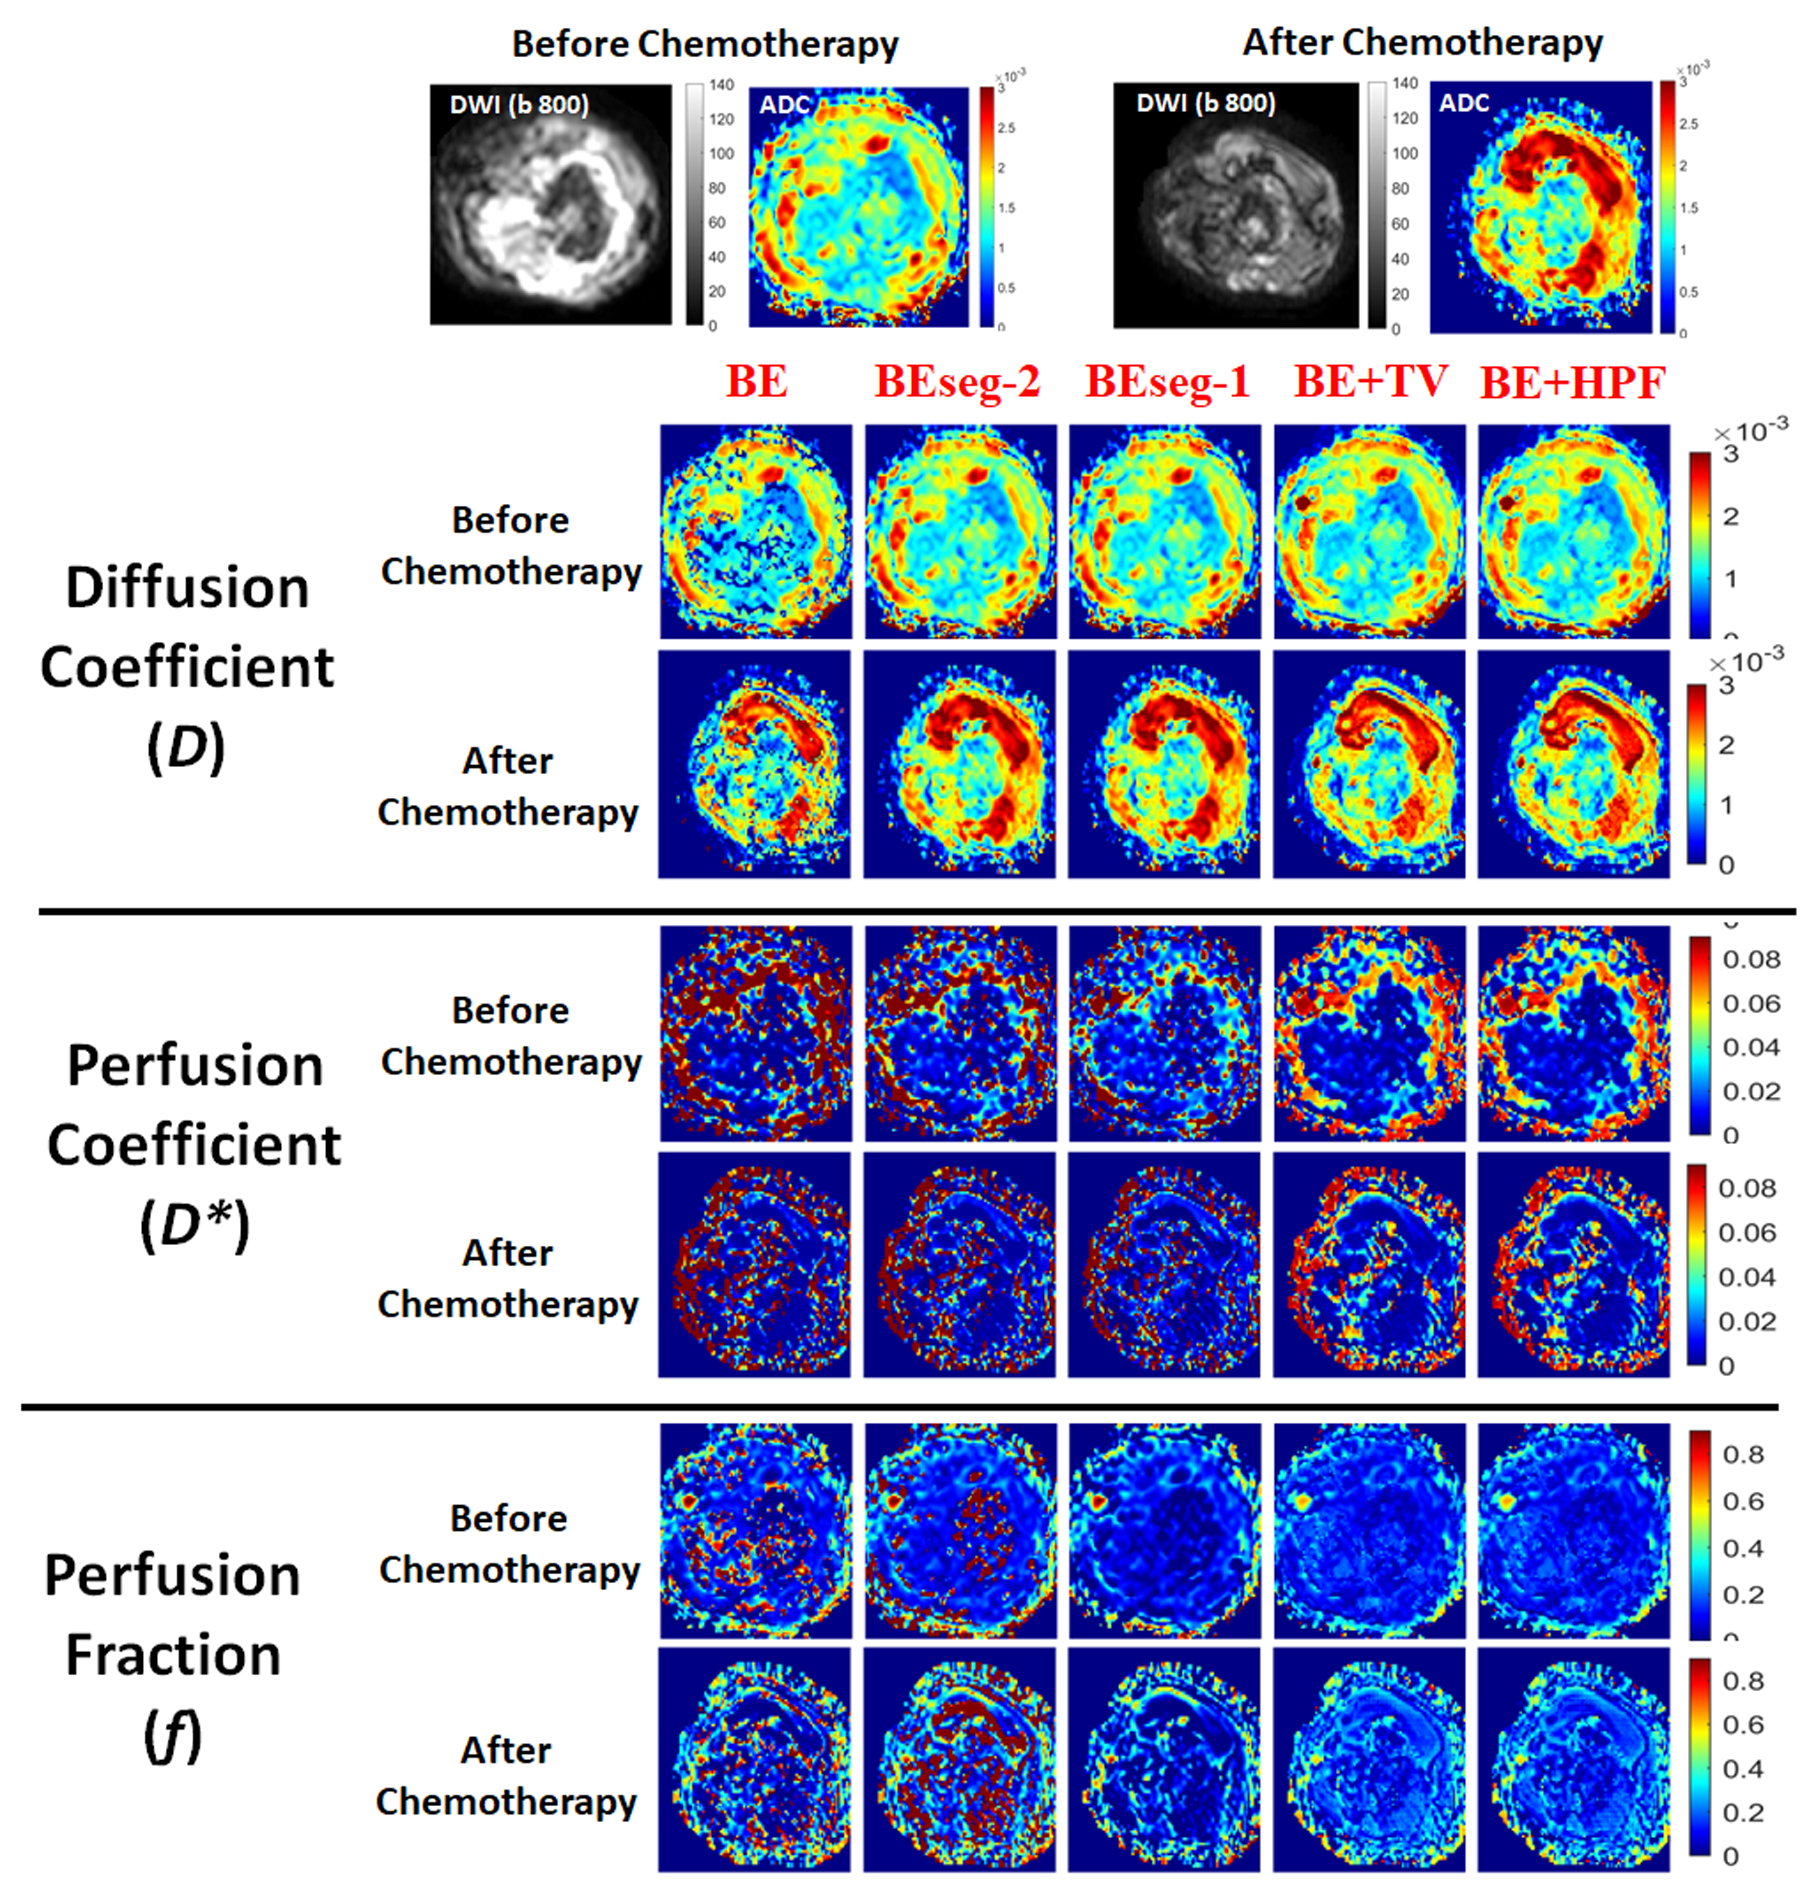
Table2 shows the CV values for IVIM parameters for 5 analysis methods at baseline and follow-up. Figure1 and Figure2 depict the IVIM parametric maps evaluated using 5 analysis methods at baseline and follow-up for a representative patient each from responder and non-responder group.
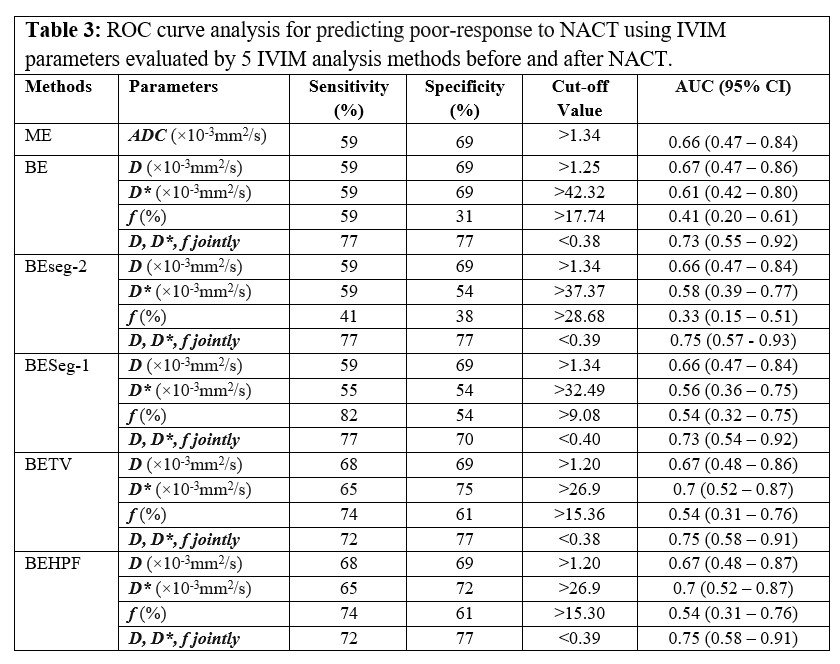
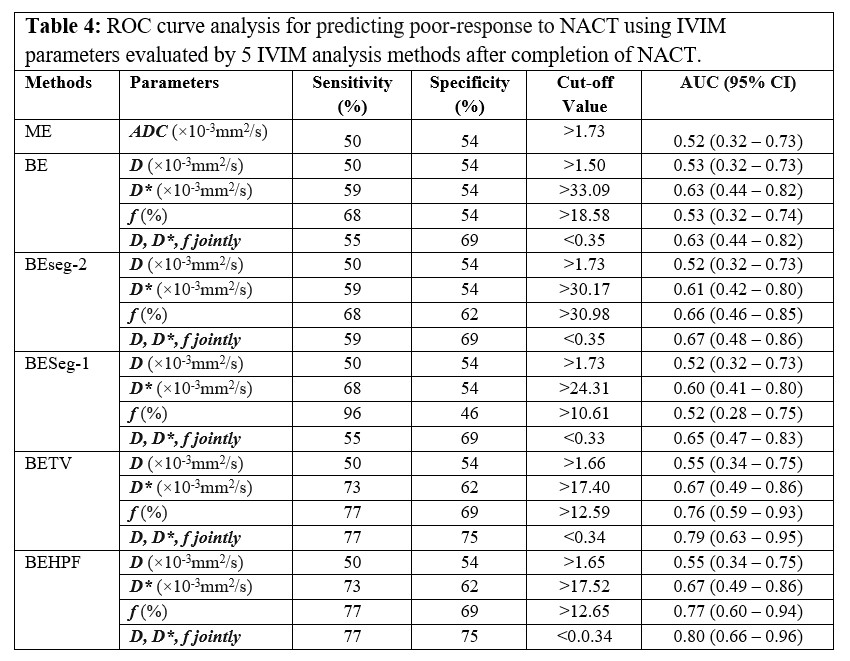
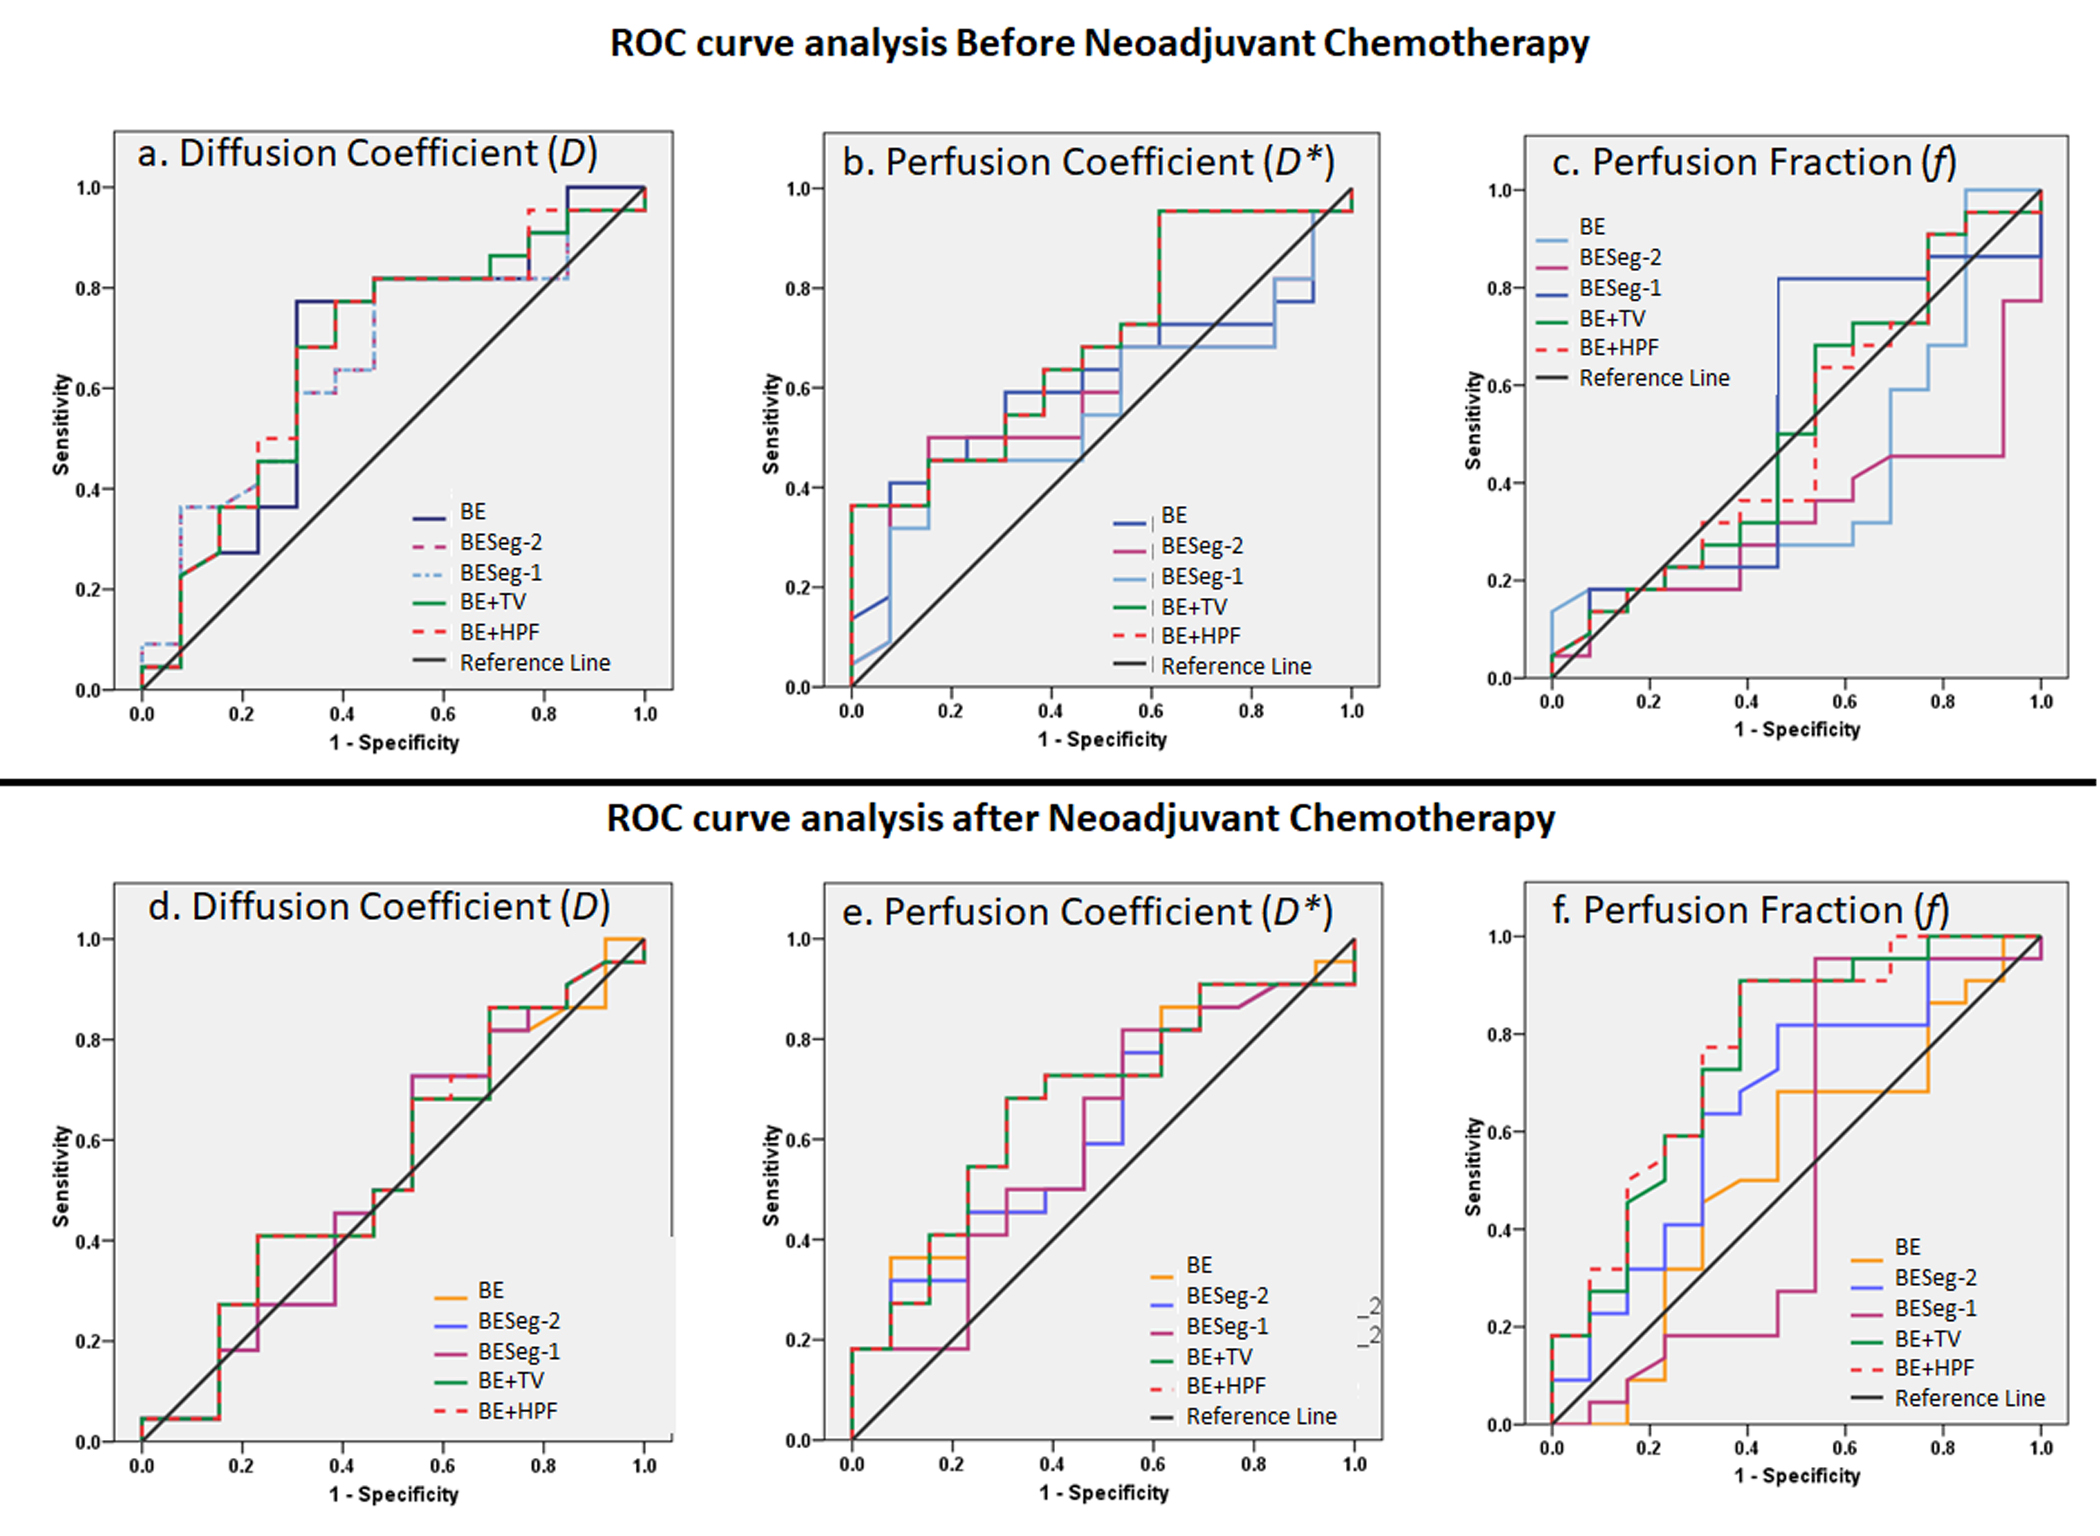
ROC curve analysis for NACT response prediction using 5 analysis methods has been summarized in Table3 and Table4 at baseline and follow-up respectively. At baseline, D* evaluated using BE+TV and BE+HPF methods showed highest AUC=0.7 with sensitivity=65%, specificity=75% at a threshold value of >26.9×10⁻³mm2/s. At follow-up, f values evaluated using BE+TV and BE+HPF methods showed highest AUC=0.76,0.77 respectively with sensitivity=77%, specificity=69% at a threshold value of >15.30%. D,D*,f evaluated using BE+TV and BE+HPF method combinedly produced highest AUC=0.75,0.8 with sensitivity=72%,77%, specificity=77%,75% for predicting NACT response at baseline and follow-up respectively. Figure3 demonstrates the ROC curve analysis for predictive performance of 5 analysis methods for NACT response at baseline and follow-up.
Discussion
Estimated CV for BE+TV/BE+HPF methods were comparatively lower than BE, BESeg-2 and BESeg-1 methods and were comparable with the other spatial constraint methods5,6. Because of the adaptive nature of penalty functions TV/HPF, the parametric images evaluated by the BE+TV and BE+HPF methods are comparatively less noisy and observed to have higher reproducibility for D* and f parameters as well as improved predictive performance for NACT response than the existing IVIM analysis methods. There was no significant statistical difference between BE+TV and BE+HPF methods. The results were evaluated on limited number of clinical datasets; however, experiment on larger datasets is desirable.Conclusion
Penalty-based IVIM analysis methods BE+TV and BE+HPF demonstrated improved predictive performance for NACT response using osteosarcoma datasets in comparison to the existing BE, BESeg-2 and BESeg-1 methods.Acknowledgements
No acknowledgement found.References
1. Merisaari H, Movahedi P, Perez IM, et al. Fitting methods for intravoxel incoherent motion imaging of prostate cancer on region of interest level: repeatability and gleason score prediction. Magn Reson Med. 2017;77:1249–1264.
2. Baidya Kayal E., Kandasamy D., Khare K., Alampally J.T., Bakhshi S., Sharma R., Mehndiratta, A. Quantitative Analysis of Intravoxel Incoherent Motion (IVIM) Diffusion MRI using Total Variation and Huber Penalty Function. Med Phys. 2017 Nov;44(11):5849-5858. doi: 10.1002/mp.12520.
3. The ESMO / European Sarcoma Network Working Group, Bone sarcomas : ESMO clinical practice guidelines for diagnosis, treatment and follow-up, Ann. Oncol. 23 (2012), https://doi.org/10.1093/annonc/mds254 vii100–vii109.
4. Picci P, Bacci G, Campanacci M, et al. Histologic Evaluation of Necrosis in Osteosarcoma Induced by Chemotherapy. Regional mapping of viable and nonviable tumor. Cancer. 1985;56(7):1515-1521.
5. Doudou NR, Liu Y, Kampo S, Zhang K, Dai Y, Wang S. Optimization of intravoxel incoherent motion (IVIM): variability of parameters measurements using a reduced distribution of b values for breast tumors analysis. Magn Reson Mater Physics, Biol Med [Internet]. 2019;33(2):273–81. Available from: https://doi.org/10.1007/s10334- 019-00779-7
6. Taimouri V, Afacan O, Perez-rossello JM, Callahan MJ, Mulkern R V, Warfield SK, et al. Spatially constrained incoherent motion method improves diffusion-weighted MRI signal decay analysis in the liver and spleen. Med Phys [Internet]. 2015;42(4):1895–903. Available from: http://dx.doi.org/10.1118/1.4915495
Figures