2262
Exercise-stimulated muscle hyperemia: a preliminary investigation with diffusion tensor imaging on calf muscles
Xin Mu1, Meng Tian2, Huahui Xu3, Chang Ni1, Yanbin Li4, Xiangwei Kong1, Xiaoli Gu3, and Jeff L Zhang1
1Vascular and Physiologic Imaging Research (VPIR) Lab, School of Biomedical Engineering, ShanghaiTech University, Shanghai, China, 2School of Biomedical Engineering, Shanghai Jiao Tong University, Shanghai, China, 3Department of Radiology, Shanghai Guanghua Hospital of Integrative Medicine, Shanghai, China, 4Central Research Institute, UIH Group, United Imaging Healthcare, Shanghai, China
1Vascular and Physiologic Imaging Research (VPIR) Lab, School of Biomedical Engineering, ShanghaiTech University, Shanghai, China, 2School of Biomedical Engineering, Shanghai Jiao Tong University, Shanghai, China, 3Department of Radiology, Shanghai Guanghua Hospital of Integrative Medicine, Shanghai, China, 4Central Research Institute, UIH Group, United Imaging Healthcare, Shanghai, China
Synopsis
Keywords: Skeletal, Muscle
Diffusion tensor imaging (DTI) has been shown to be highly sensitive to subtle pathological alterations caused by multiple diseases. Utilizing this capability of DTI, in this study we characterized post-exercise hyperemic responses of calf muscles. We found that multiple DTI measures, including ADC, λ1-3, and RD, increased significantly in activated muscles, and more than in those in non-activated muscles. Of particular interest was the significant increase in λ3 and RD of the activated muscle, indicating a relatively higher degree of increase in water diffusion along the cross-section direction of muscle fibers.Introduction
Clinical T1- and T2-weighted MRI are capable of detecting significant changes in skeletal muscles induced by inflammation, trauma or atrophy, but not earlier pathological alterations on cellular or fascicular level1. Diffusion tensor imaging (DTI) has been shown to be sensitive to changes in the tissue microstructure, and enables the characterization of muscle fiber architecture1. Herein, we aimed to explore the value of DTI in quantifying exercise-induced changes in calf muscles, so as to better understand exercise-stimulated muscle hyperemia from the perspective of water diffusion.Methods
The study was approved by our institutional review board. We recruited 6 healthy subjects (male, age 22±3 years, weight 75±13 kg), and informed consent was signed before the experiment. On a 3T MRI scanner (United Imaging Healthcare, China), the subject was positioned head-first, with a 12-channel flex coil wrapping around one calf. With a custom-built apparatus, the subject performed plantar flexion with a frequency of 1 Hz for 6 minutes and a load of 18 lbs. Before and immediately after the exercise, DTI based on echo planar sequence was performed with following parameter values: b values 0 and 400 s/mm2, TE/TR 70/4000 ms, 6 directions, FOV 250×250×64 mm, average number 9.With each set of the acquired DTI data, voxelwise fitting of exponential decay was performed to obtain maps of apparent diffusion coefficient (ADC), three eigenvalues (λ1, λ2, λ3) and radial diffusivity (RD), and 3D tractography was constructed to visualize muscle fibers. On the image of b = 0 s/mm2, regions of interest (ROI) were manually drawn to include lateral gastrocnemius (LG) and soleus (SOL), respectively. For each ROI, cautions were taken to exclude fascia, blood vessels. The ROIs were applied to the above parameter maps to obtain the averaged unweighted (b = 0 s/mm2) signal intensity (S0), ADC, λ1-3 and RD for each muscle group. To quantitatively characterize diffusivity anisotropy in skeletal muscles, we computed ellipsoid eccentricity (e) as (1-λ3/λ1)-1/2 for each muscle group. Here λ1, λ2, and λ3 represent the diffusive transport along the long axis of a muscle fiber, within the endomysium perpendicular to the long axes of the muscle fibers, and within the cross-section of a muscle fiber, respectively3. Hence, an increased value of e corresponds to a change in muscle morphology from a spherical to a more longitudinal shape.
Results
Representative maps for S0, λ1-3, ADC and tractography before and after exercise are shown in Fig. 1. Before exercise, LG and SOL did not show any significant difference between their S0 values, or between their ADC values (P>0.50). With exercise, S0 of LG increased significantly from 74.1±9.0 to 121.4±32.3 (64.51% on average, P=0.01), while S0 of SOL did not change significantly (84.36±31.33 to 95.68±30, P=0.47) (Fig. 2a). Similar patterns of exercise-induced responses were observed for the ADC values (Fig. 2b): ADC of LG increased significantly from 1813.0±166.5 to 2145.0±268.4 µm2/s (15.4% on average, P=0.04), and for SOL, from 1722.0±94.5 to 1807.0±218.4 µm2/s (P=0.45).None of the eigenvalues (λ1-3) was significantly different between LG and SOL prior to exercise (P>0.57). All eigenvalues of the two muscle groups increased with exercise, but only the increase of λ3 in LG was significant (1376.0±122.1 to 1655.0±134.5 µm2/s, 20.5%, P =0.008) (Fig. 3a). The percentage increases in λ1-3 are shown in Fig. 3b, where obviously increases in LG (14.5%, 18.3%, 20.5%) were significantlysignificiantly higher than the corresponding increases in SOL (3.6%, 4.9%, 7.1%)。The exercise-induced changes in the three eigenvalues were also reflected in the estimates of RD and ellipsoid eccentricity (Fig. 3c and 3d). For LG with exercise, its RD increased significantly from 1600.0±135.0 to 1907.0±223.6 µm2/s, P=0.03) and ellipsoid eccentricity had a trend of decrease. Neither of the two parameters changed significantly for SOL with exercise.Discussion
In this work, we explored how intensive plantar flexion would impact the DTI metrics in calf muscles. It was found that ADC, λ1-3 and RD increased significantly in the activated gastrocnemius muscle, but not in the soleus. In skeletal muscles, myofilaments inside muscle cells are organized in a geometry that restricts water diffusion4. With exercise to induce hyperemia and thus significant enlargement of muscle intracellular space6, water diffusion along all directions may be accelerated. This may explain the increase of λ1 (the principal direction) and λ2-3 (the perpendicular directions)5. The increase of T2-weighted signal intensity S0 also supports the increase of water content in such a scenario. The relatively more increase in λ3 led to a decrease in ellipsoid eccentricity for both LG and SOL with exercise. This indicates a transition of muscle diffusion from a highly anisotropic state (mostly along the muscle fibers) at rest to a less anisotropic state in exercise. A possible explanation for the such trend may be the increased exchange of water and oxygen along the cross-section direction of muscle fibers, more than that along the long axis of a muscle fiber.Conclusion
DTI revealed significant differences in diffusion between activated and non-activated muscles, and the difference between along the long axis of muscle fiber and perpendicular to it, which is highly related to the functional structure of muscle fibers. Such a phenomenon demonstrates that DTI has a promise for monitoring subtle changes in muscle pathology.Acknowledgements
This work was supported by the National Natural Science Foundation of China (Grant No. 82171924).References
- Oudeman J, Nederveen A J, Strijkers G J, et al. Techniques and applications of skeletal muscle diffusion tensor imaging: a review[J]. Journal of Magnetic Resonance Imaging, 2016, 43(4): 773-788.
- Chianca V, Albano D, Messina C, et al. Diffusion tensor imaging in the musculoskeletal and peripheral nerve systems: from experimental to clinical applications[J]. European radiology experimental, 2017, 1(1): 1-8.
- Takao S, Kaneda M, Sasahara M, et al. Diffusion tensor imaging (DTI) of human lower leg muscles: correlation between DTI parameters and muscle power with different ankle positions[J]. Japanese journal of radiology, 2022: 1-10.
- Cermak N M, Noseworthy M D, Bourgeois J M, et al. Diffusion tensor MRI to assess skeletal muscle disruption following eccentric exercise[J]. Muscle & nerve, 2012, 46(1): 42-50.
- Galban C J, Maderwald S, Uffmann K, et al. Diffusive sensitivity to muscle architecture: a magnetic resonance diffusion tensor imaging study of the human calf[J]. European journal of applied physiology, 2004, 93(3): 253-262.
- Okamoto Y, Kemp G J, Isobe T, et al. Changes in diffusion tensor imaging (DTI) eigenvalues of skeletal muscle due to hybrid exercise training[J]. Magnetic resonance imaging, 2014, 32(10): 1297-1300.
Figures
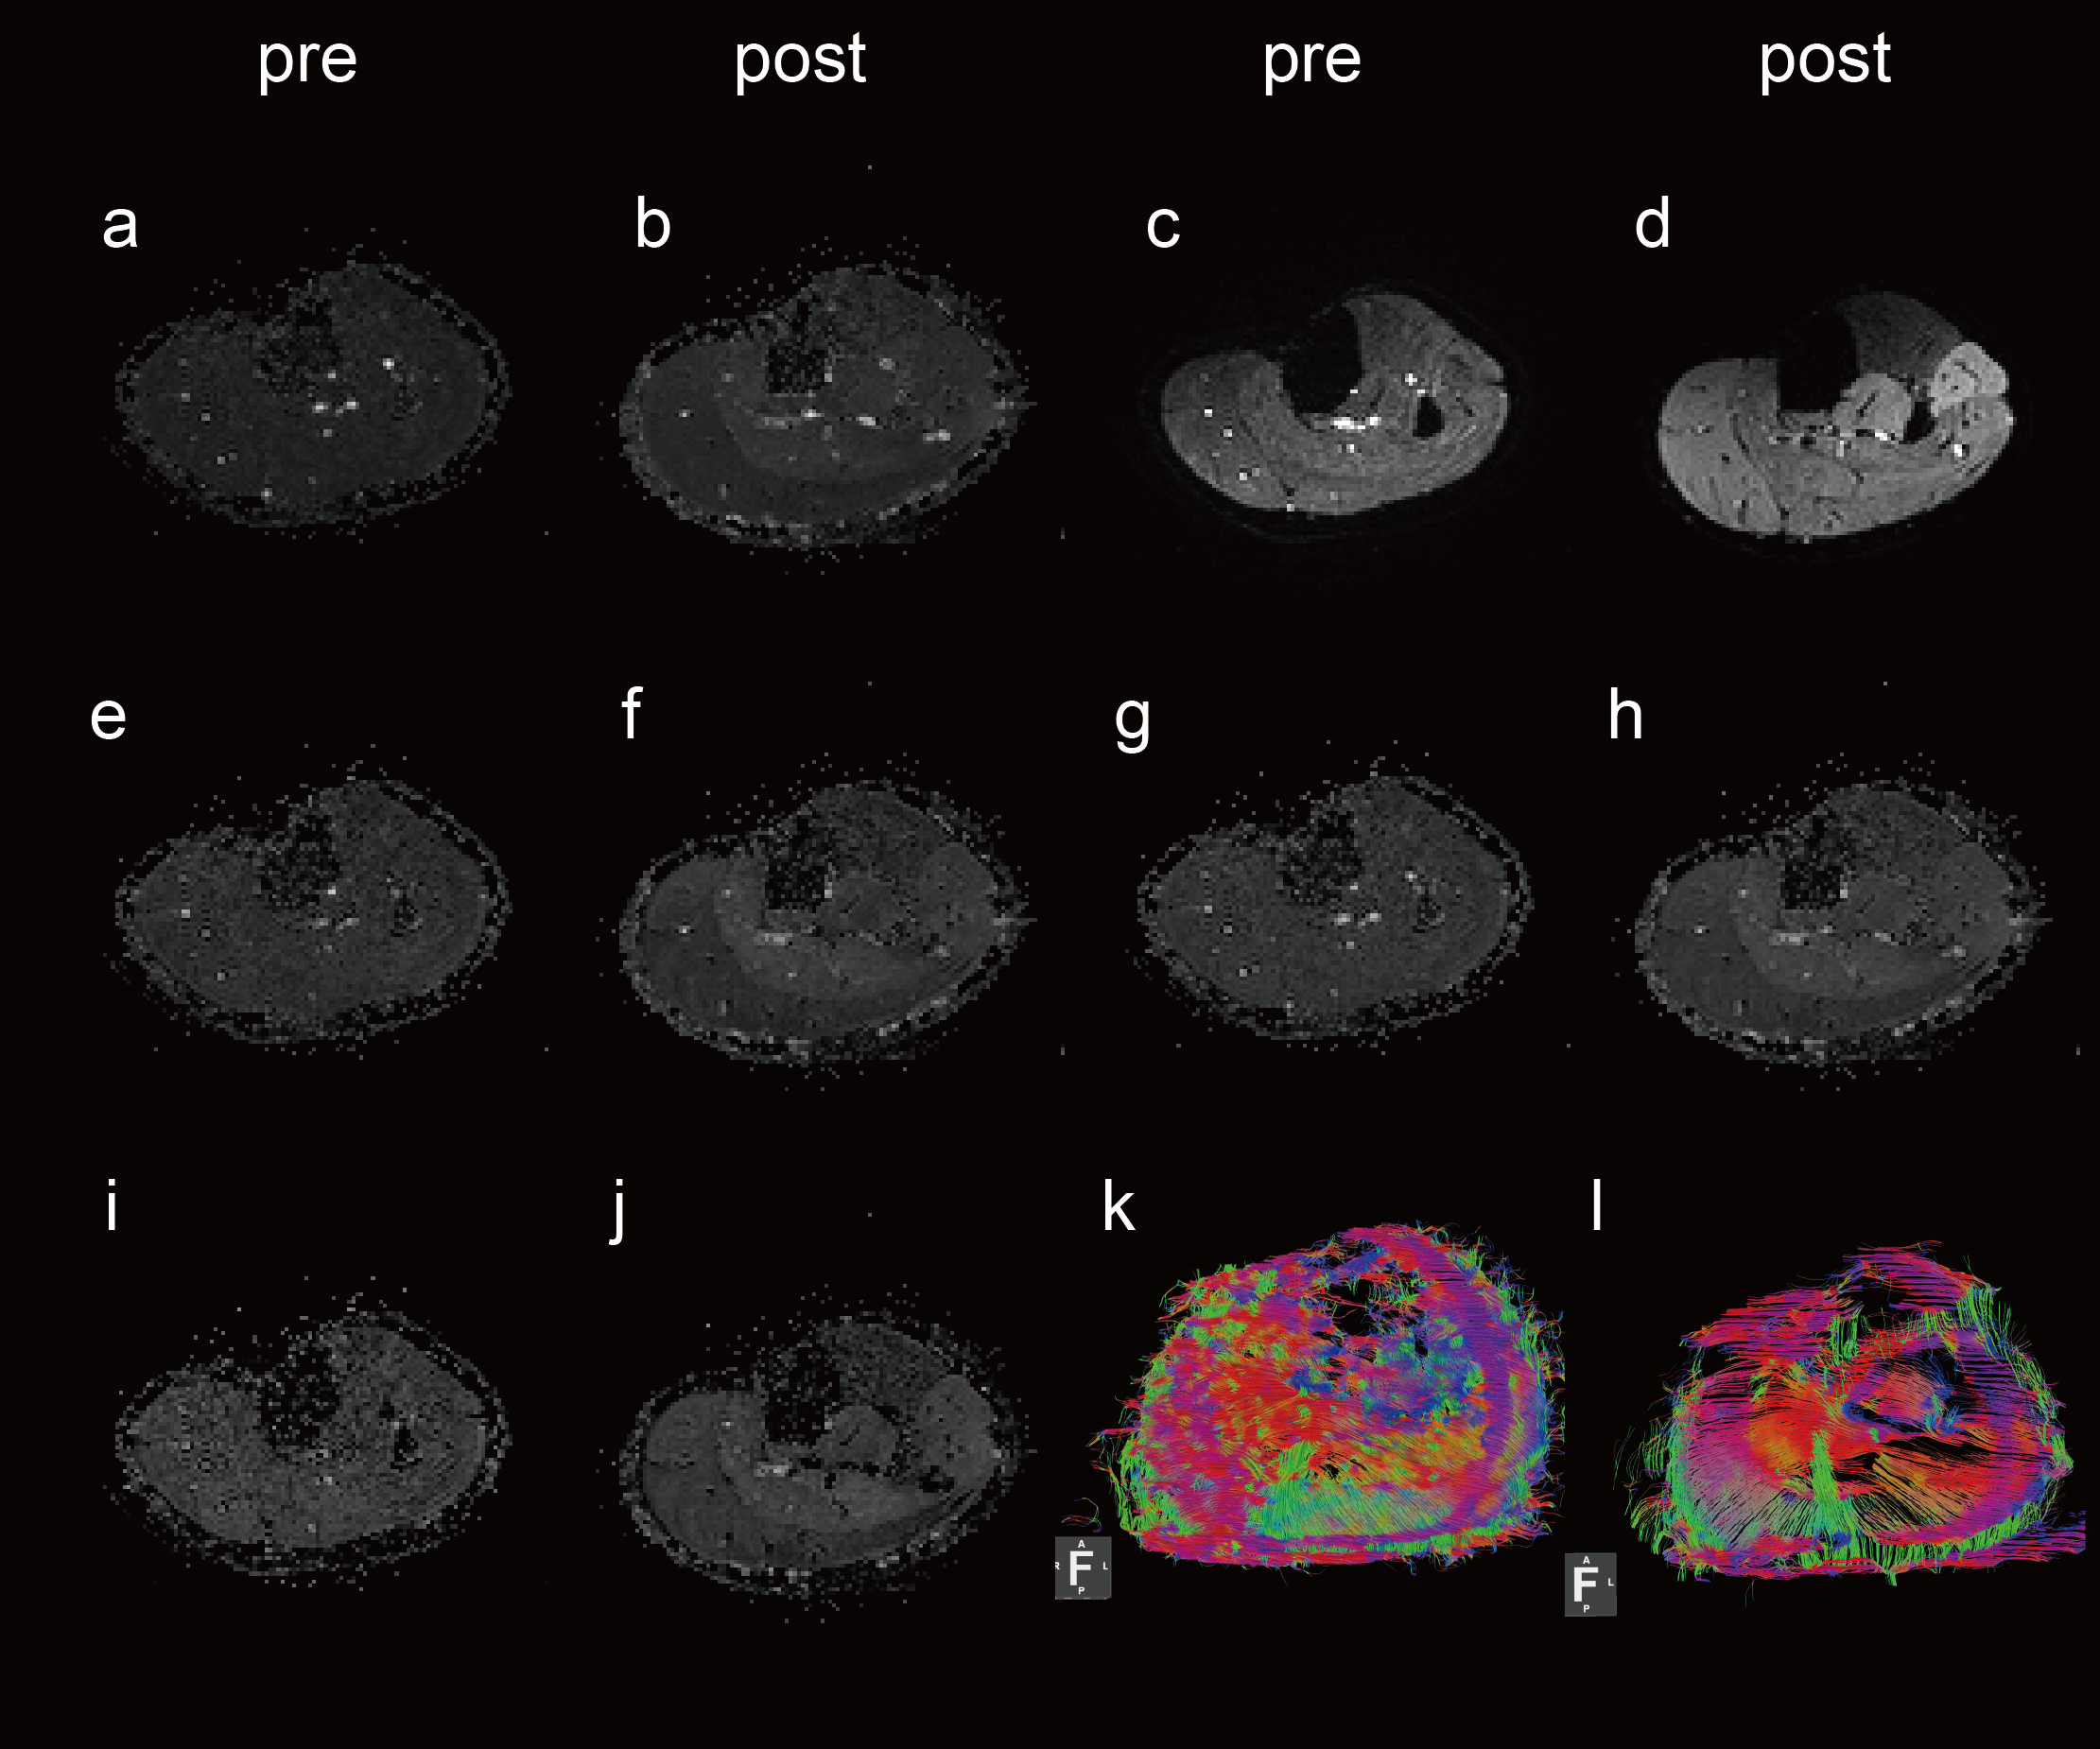
Fig. 1. Representative maps for the DTI metrics before and after exercise. (a,b) λ1; (e,f) λ2; (i,j) λ3; (c,d) the images of b = 0 s/mm2 or S0; (g,h) ADC; (k,l) DTI tractography.
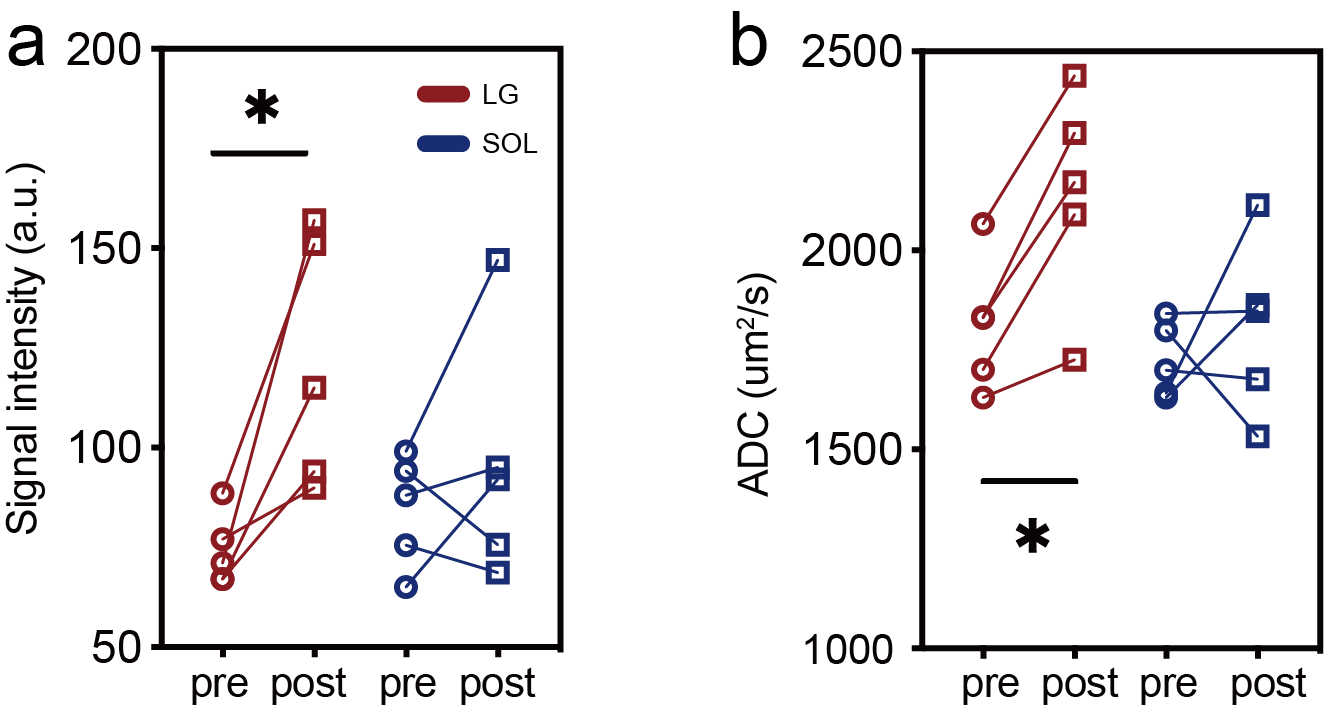
Fig. 2. Exercise-induced changes in signal intensity at b=0 (S0) (a) and in ADC (b). Results of lateral gastrocnemius (LG) are shown in red, and soleus (SOL) in blue. Label * indicates a significant difference.
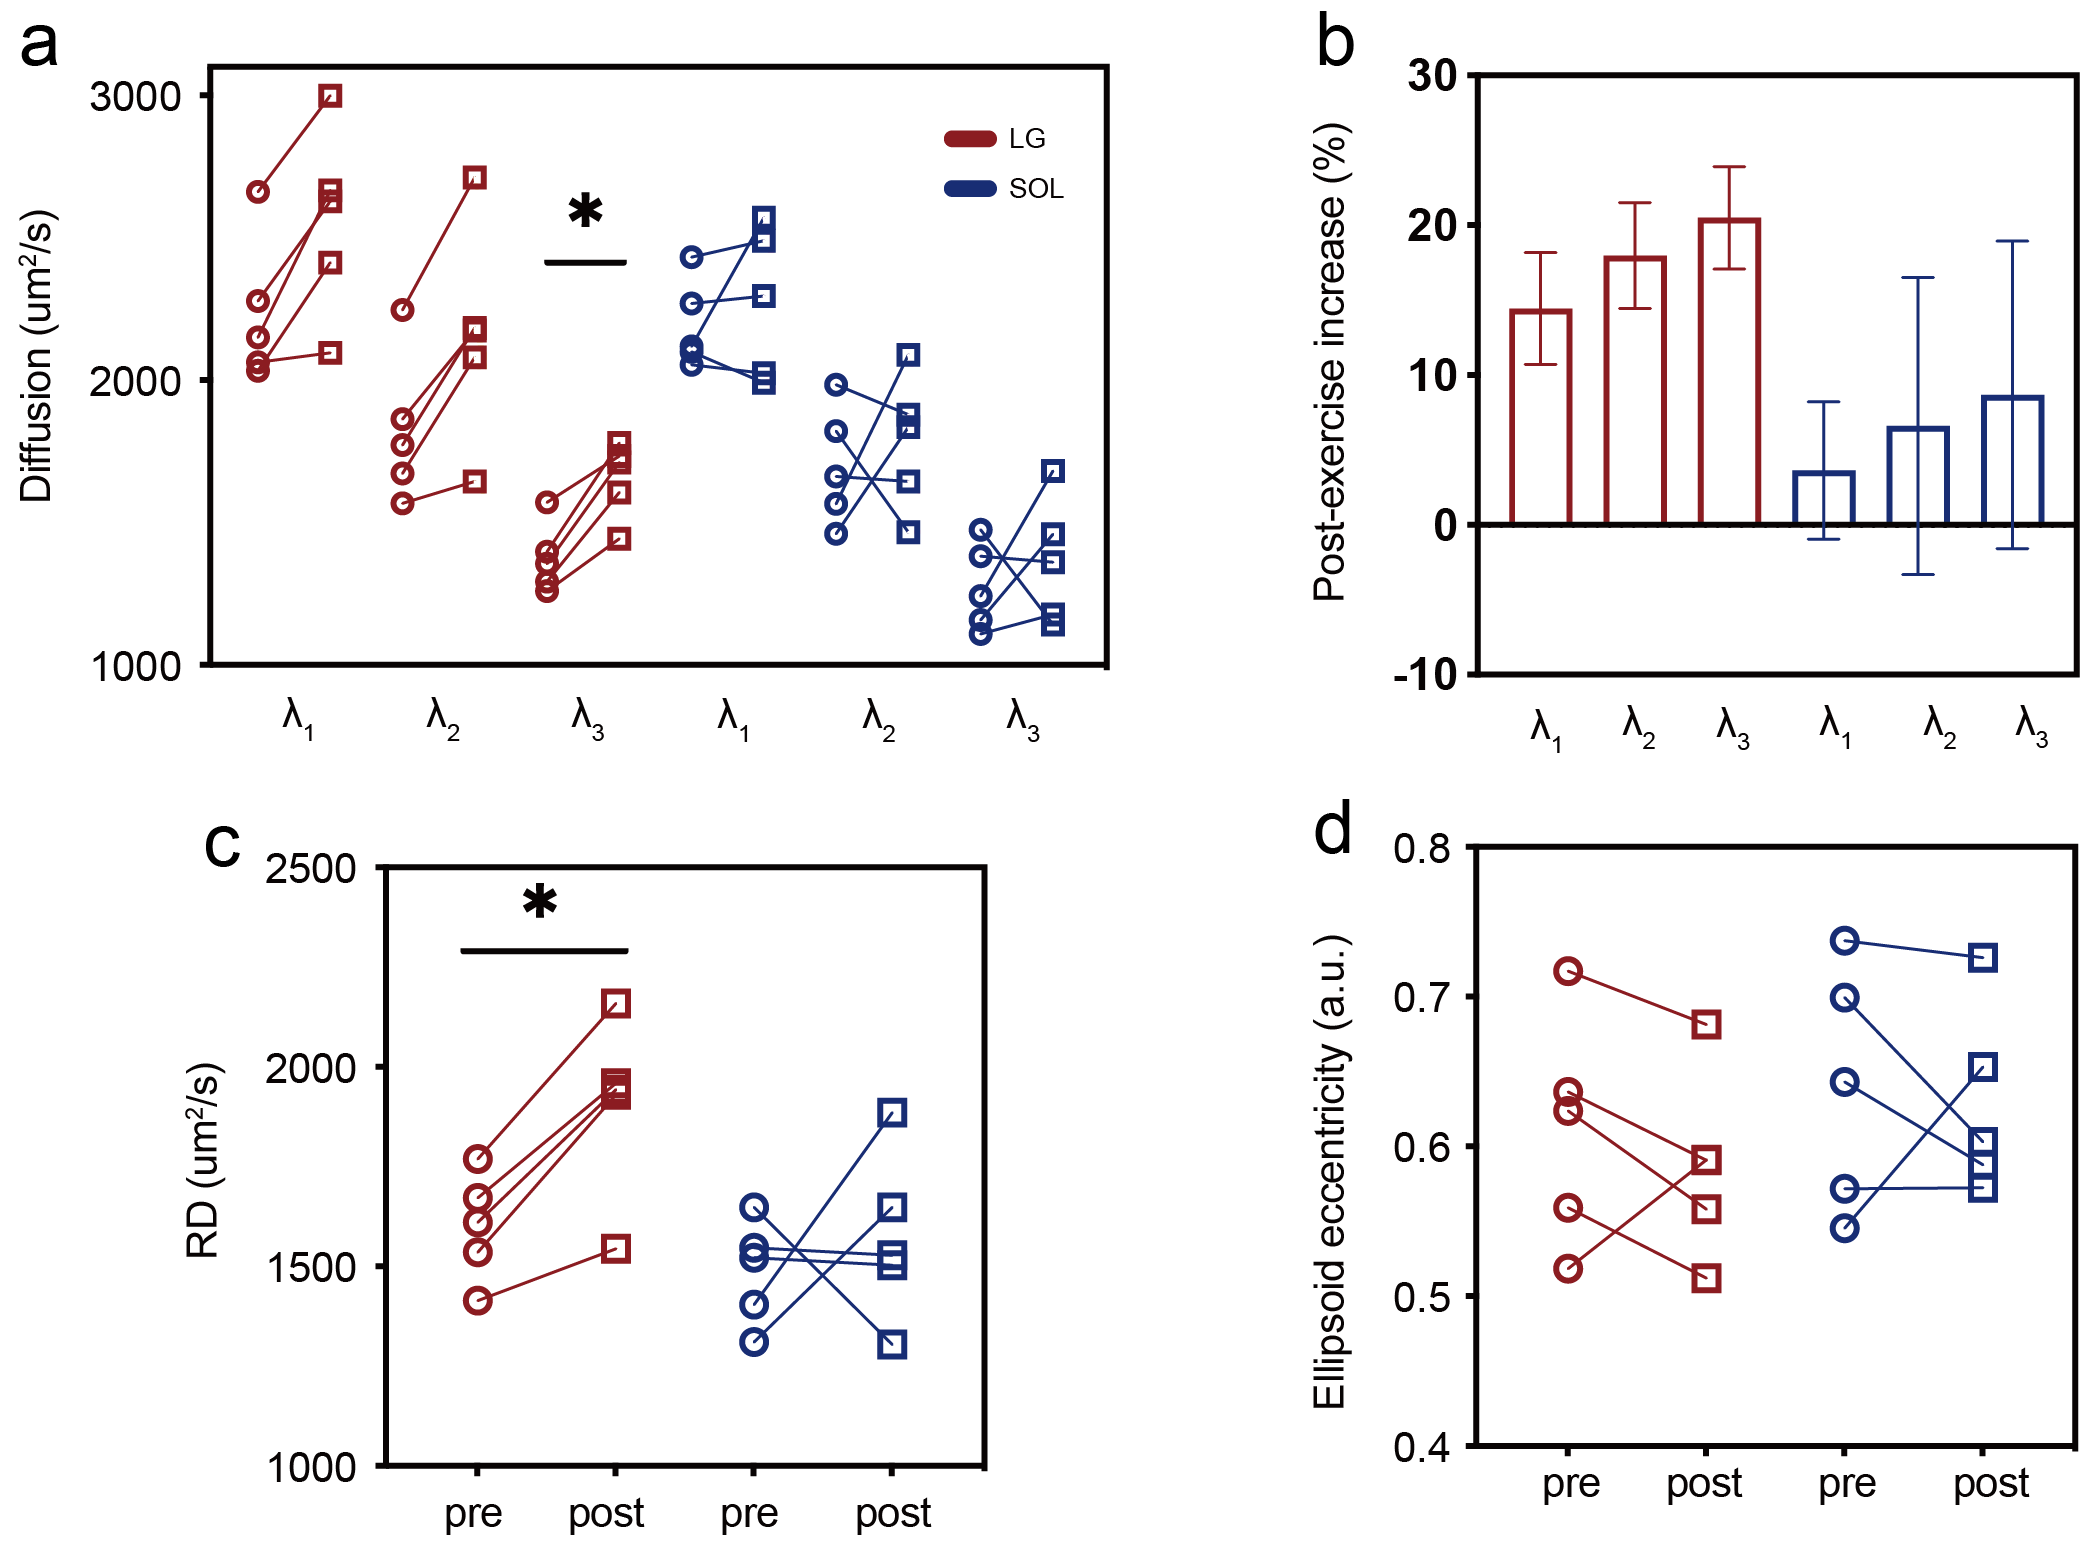
Fig. 3. Exercise-induced changes in diffusion eigenvalues (a), their percentage changes (b), radial diffusivity (RD, c), and ellipsoid eccentricity (d). Results of lateral gastrocnemius (LG) are shown in red, and soleus (SOL) in blue. Label * indicates a significant difference.
DOI: https://doi.org/10.58530/2023/2262