2259
Intravoxel incoherent motion and dynamic contrast-enhanced magnetic resonance imaging for neoadjuvant chemotherapy response evaluation in patients with osteosarcoma1Department of Radiology, Peking University People's Hospital, Beijing, China
Synopsis
Keywords: MSK, Multimodal, Osteosarcoma
In this study, we simultaneously compared the predictive value of ADC, IVIM and semi-quantitative and quantitative DCE-MRI parameters for the efficacy of NACT. We found that D-Bi, D*-Bi, and f-Bi post-NACT and ΔD-Bi had statistical differences between the good response group and the poor response group. ROC curve showed that f-Bi post-NACT had the best performance in all parameters, with AUC of 0.769, sensitivity of 1, and specificity of 0.538. Correlation analysis showed that the efficacy of NACT was negatively correlated with D-Bi, D*-Bi post-NACT and ΔD-Bi, and was significantly positively correlated with f-Bi post-NACT.
Abstract
Background: In recent decades, further improvement of the therapeutic effect of osteosarcoma (OS) has fallen into a bottleneck period, one of the important reasons is the widespread existence of chemotherapy tolerance [1]. The role of the OS tumor stroma microenvironment plays a significant part in the development and dissemination of this disease [2]. Multiparametric magnetic resonance imaging provides additional information to that provided by the conventional sequences, including cellularity, vascularity, fat content and metabolism [3].Objectives: This study aimed to explore the role of quantitative intravoxel incoherent motion (IVIM) and dynamic contrast-enhanced magnetic resonance imaging (DCE-MRI) parameters in characterizing changes in osteosarcoma (OS) receiving neoadjuvant chemotherapy (NACT).
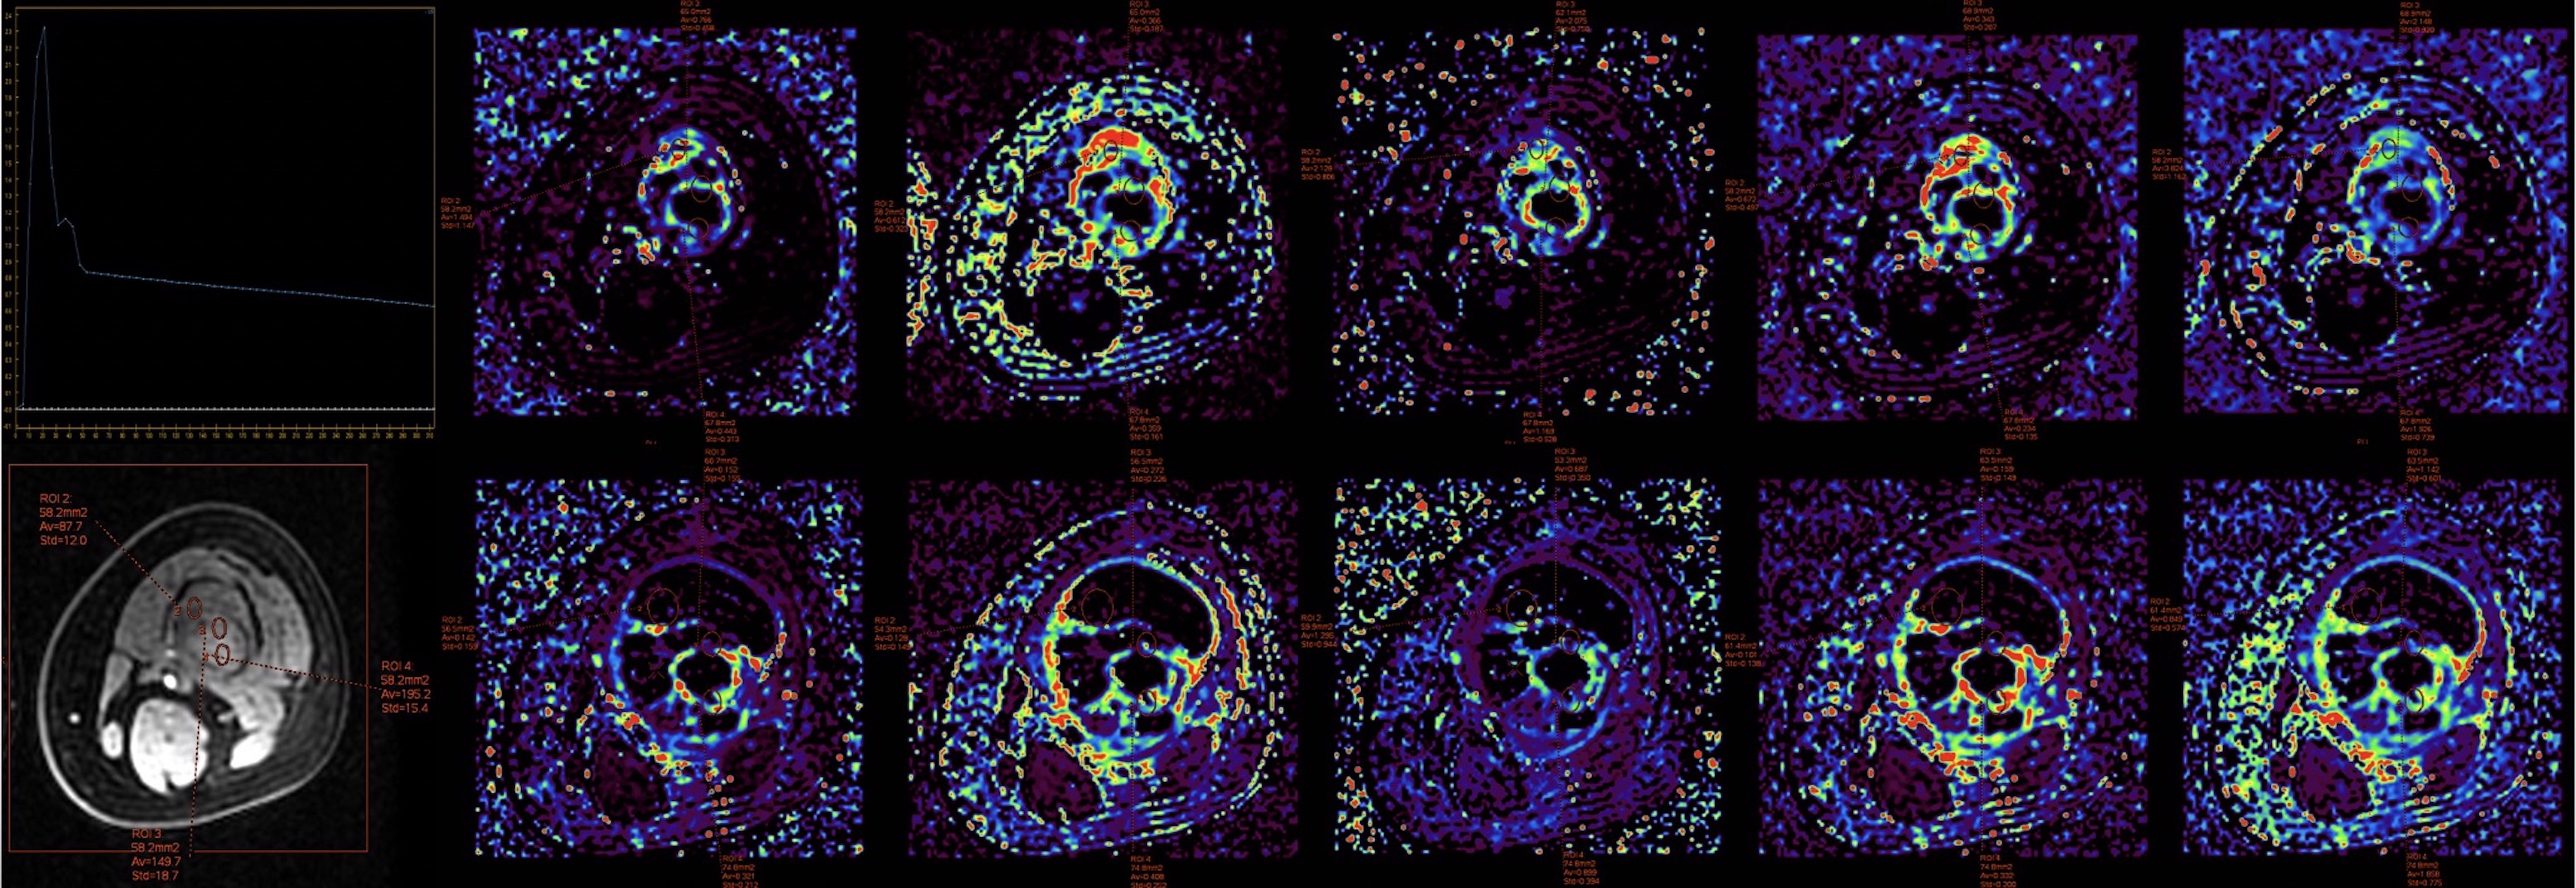
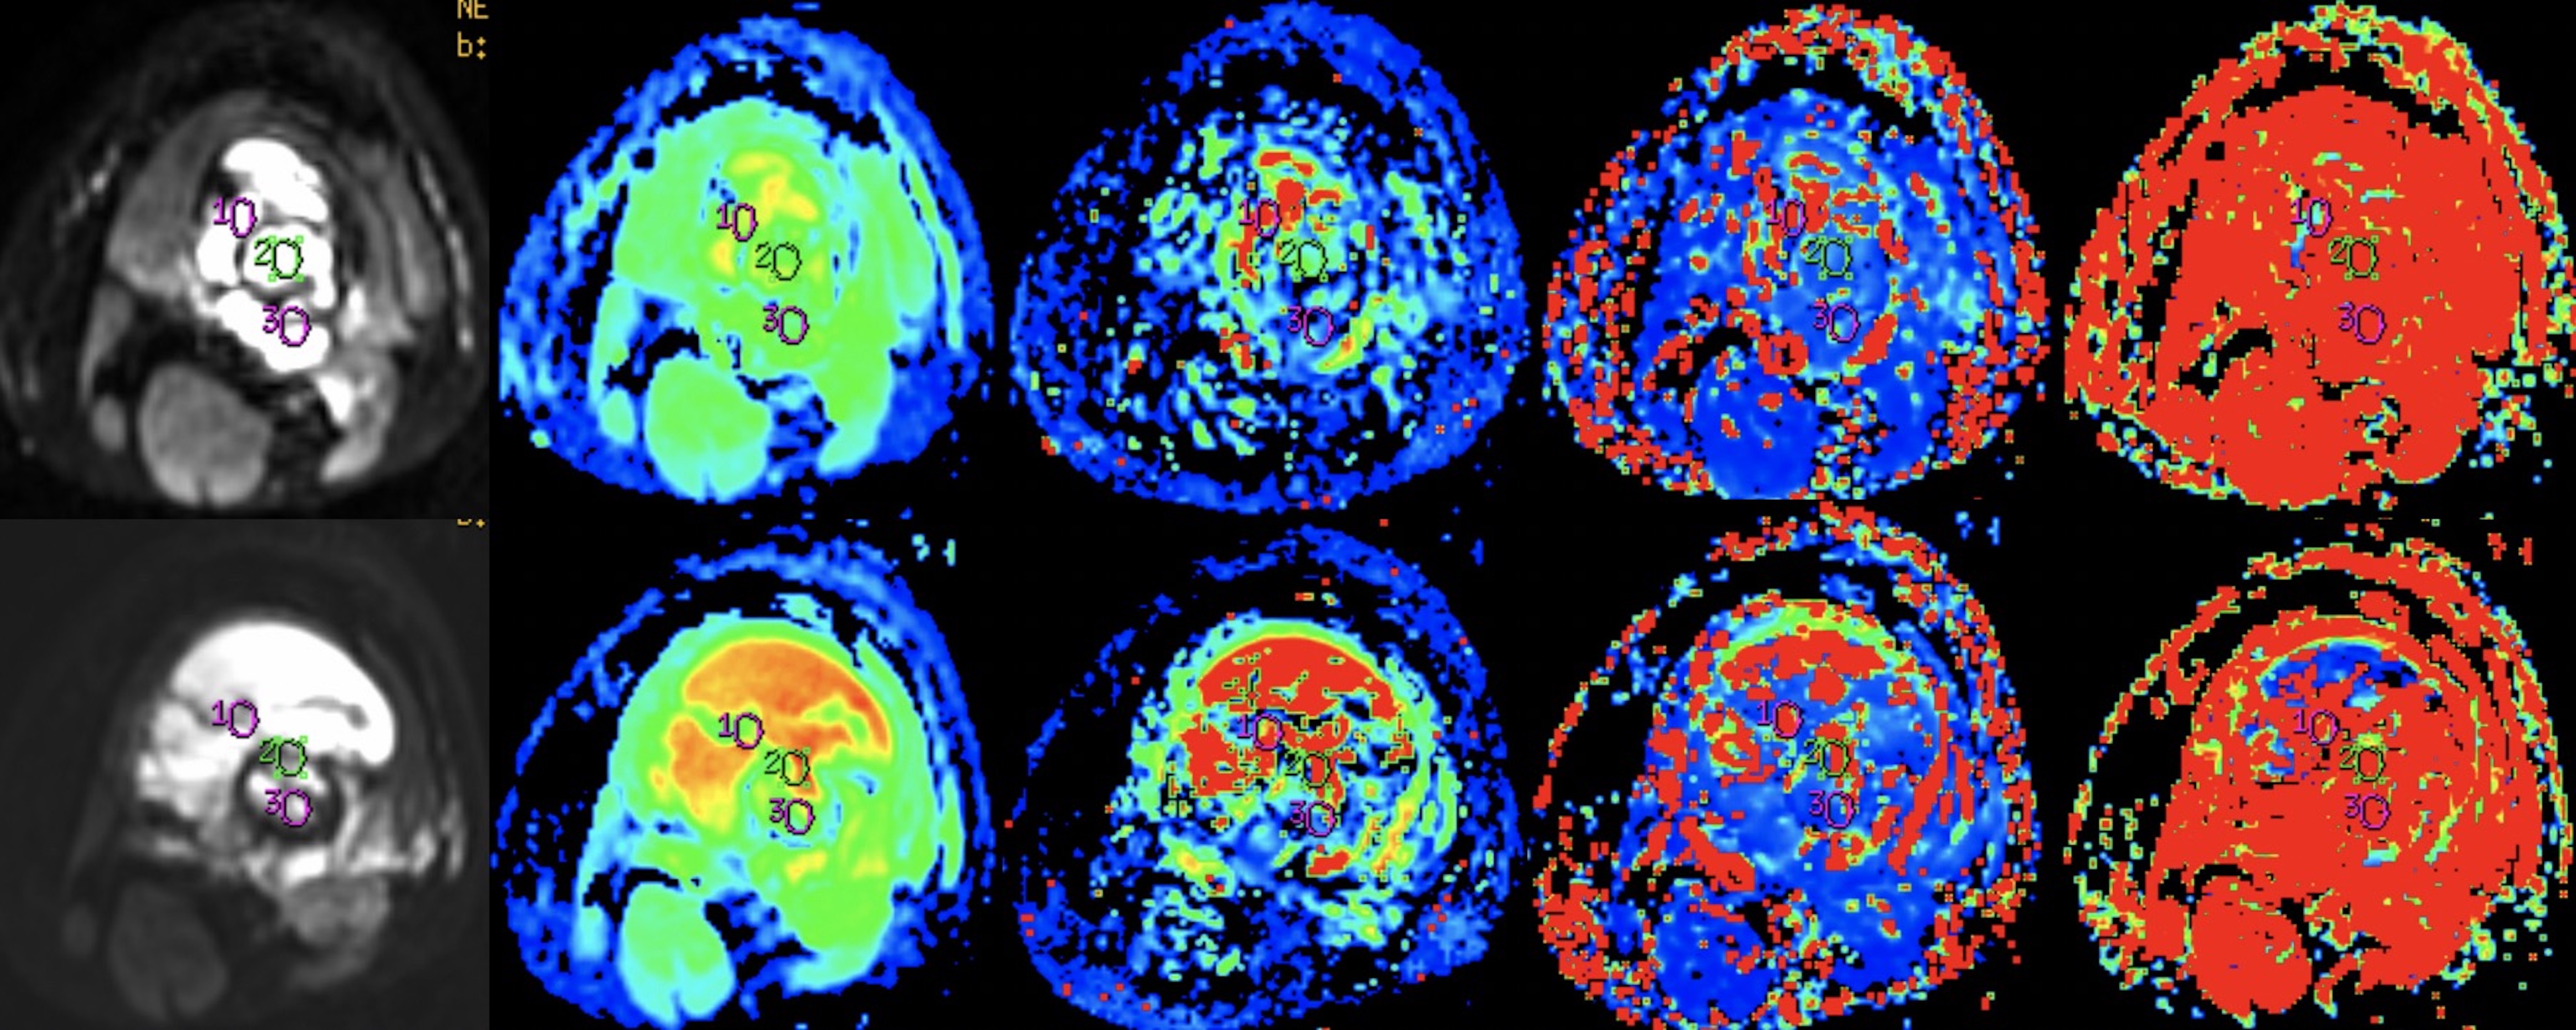
Material and Methods: Twenty-seven patients (14 males, 13 females; median age of 13.0 [10.0, 15.0] years, range 5–31 years) with histologically proven OS treated with 3-cycles of NACT were analyzed prospectively and divided into good response group (n = 14) and poor response group (n = 13). IVIM and DCE-MRI sequences were performed at baseline (pre-NACT) and after NACT (post-NACT). Apparent diffusion coefficient (ADC) and IVIM bi-exponential model parameters, including diffusion coefficient (D-Bi), perfusion coefficient (D*-Bi), and perfusion fraction (f-Bi) were evaluated. DCE-MRI parameters, including quantitative parameters (volume transfer constant [Ktrans], reflux rate [Kep], volume fraction of the extravascular extracellular matrix [Ve]) and semi-quantitative parameters (initial area under the gadolinium curve [IAUGC], and contrast enhancement rate [CER]) were also measured. Correlation analyses were conducted by using Spearman correlative analyses to investigate relations among imaging biomarkers and response to chemotherapy. Receiver operating characteristic curve (ROC) was drawn for all parameters to obtain the best diagnostic threshold, area under the curve (AUC), sensitivity and specificity, so as to clarify the value of IVIM and DCE-MRI parameters in differentiating the efficacy of NACT.
Results: No statistically significant differences occurred in age, sex, tumor size and tumor location between the two groups (P > 0.05). D-Bi, D*-Bi and f-Bi post-NACT and ΔD-Bi were statistically different between the good response and poor response groups (Z1 = -3.348, Z2 = -2.572, Z3 = -2.378, t = 2.235, P < 0.05). ADC, f-Bi, Ktrans, IAUGC, Kep, CER post-NACT were statistically different from those pre-NACT (P < 0.05). ROC curve showed that f-Bi post-NACT had the best performance in all parameters, with AUC of 0.769, sensitivity of 1, and specificity of 0.538. Correlation analysis showed that the efficacy of NACT was negatively correlated with D-Bi, D*-Bi post-NACT and ΔD-Bi (r1 = -0.530, r2 = -0.411, r3 = -0.434, P1 = 0.008, P2 = 0.046, P3 = 0.034), and was significantly positively correlated with f-Bi post-NACT (r = 0.482, P = 0.017).
Conclusions: IVIM quantitative parameters D-Bi, D*-Bi, and f-Bi post-NACT and ΔD-Bi could be used to evaluate and predict the response to NACT in OS. Compared with judging the effect of chemotherapy by the rate of tumor necrosis after surgery, IVIM parameters after chemotherapy can help judge the effect in advance and make appropriate treatment plan in time. In addition, compared with DCE-MRI parameters, IVIM parameters have better predictive value for NACT response in OS patients, and contrast agent injection is not required, which may be more helpful for some patients who are unwilling or unable to do enhanced examination.
Acknowledgements
NoReferences
[1]. Gorlick R, Janeway K, Lessnick S, Randall RL, Marina N. Children’s oncology Group’s 2013 blueprint for research: bone tumors. Pediatr Blood Cancer. 2013;60:1009–15.
[2]. Cersosimo F, Lonardi S, Bernardini G, Telfer B, Mandelli GE, Santucci A, Vermi W, Giurisato E. Tumor-Associated Macrophages in Osteosarcoma: From Mechanisms to Therapy. Int J Mol Sci 2020;21(15):5207. doi: 10.3390/ijms21155207.
[3]. Inarejos Clemente EJ, Navarro OM, Navallas M, Ladera E, Torner F, Sunol M, et al. Multiparametric MRI evaluation of bone sarcomas in children. Insights Imaging. 2022;13(1):33. doi: 10.1186/s13244-022-01177-9.
Figures