2258
Sex differences in subcutaneous fat thickness and bone marrow fat area and their relationship to BMI and age1Advanced Imaging Research Center, University of Texas Southwestern Medical Center, Dallas, TX, United States, 2Department of Radiology, University of Texas Southwestern Medical Center, Dallas, TX, United States
Synopsis
Keywords: Bone, Fat, Metabolism, diabetes
This study evaluated the sex factor in affecting fat distribution in bone marrow and subcutaneous tissue in human lower extremity. Bone marrow fat (BMF) was characterized by the cross-sectional area in the fibula bone and subcutaneous fat (SF) was measured by the thickness of SF (SFT) in the periphery of calf muscle. It is found that SFT and BMF are statistically significantly correlated to BMI and age, respectively, in women (n = 43), but not in men (n = 59). For a subgroup of subjects with thinner SFT (<15 mm, n = 87), SFT is negatively correlated to BMF.Introduction
The distribution of body fat has a causative impact on metabolic health1. It is well known that women compared to men, deposit more fat in hip and thigh, whereas men have a higher tendency to accumulate abdominal visceral fat compared to pre-menopausal women2. Sex differences in local fat distribution in and surrounding skeletal muscle, however, has not been well established, despite its potential role in metabolic regulation and development of diseases3-5. However, a recent study has found a linear correlation of sex specific calf girth with the prevalence of peripheral artery disease, suggesting a gender interaction effect in calf fat metabolism3. A relationship between visceral fat and bone marrow fat (BMF) has also been suggested, and both are considered to be potential detrimental factors related to osteoporosis, a major health concern amongst the elderly. In this work, we show that there is a strong negative linear correlation between BMF and subcutaneous fat thickness (SFT) for subjects with low SFT, and that SFT and BMF in women are statistically significantly correlated to BMI and age, respectively, but not in men.Methods
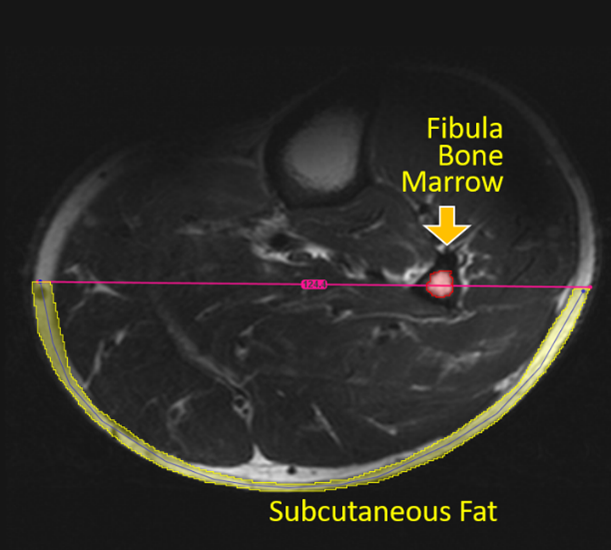
Axial T2w MR images acquired at 7T from 103 subjects (43 female / 59 male, 7 consecutive cross-sectional slices each, slice thickness 5 mm) were retrieved from the institutional database to evaluate BMF area in fibula bone and SFT in the periphery of calf muscle. Manual segmentation and quantification of the bone marrow area in fibula bone and subcutaneous fat (SF) area was performed in the Multi-image Analysis GUI (Mango) viewer. The SF thickness (SFT) was obtained by dividing the SF area with the central length of SF curvature. P-value less than 0.05 was considered to be statistically significant.Results
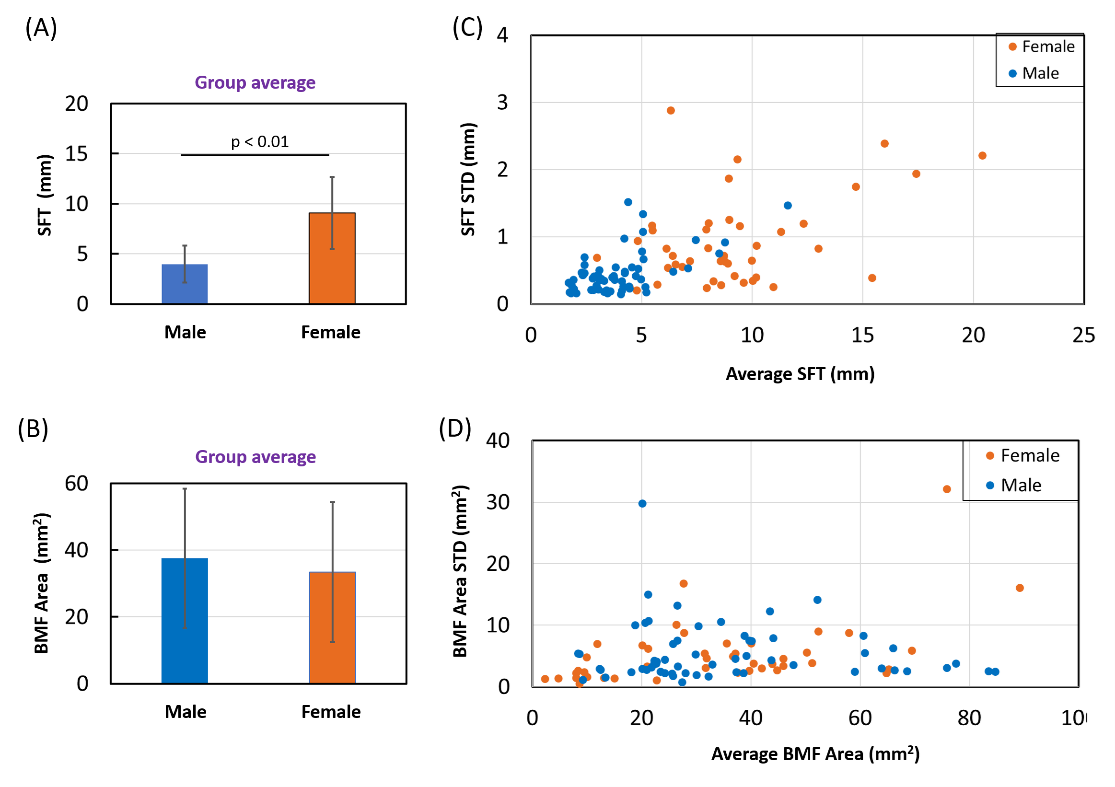
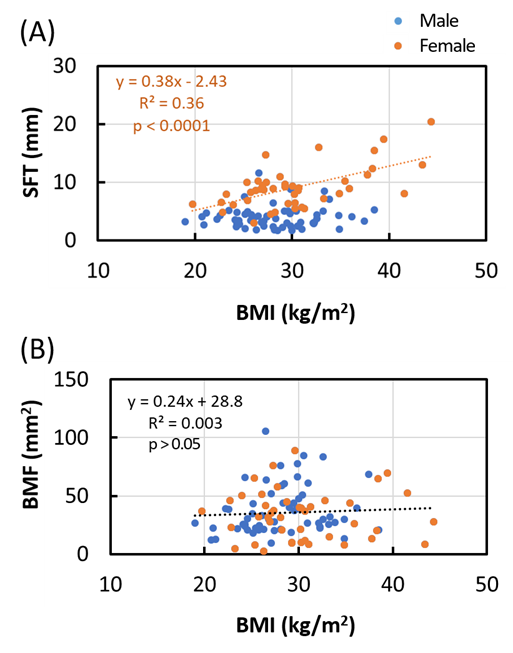
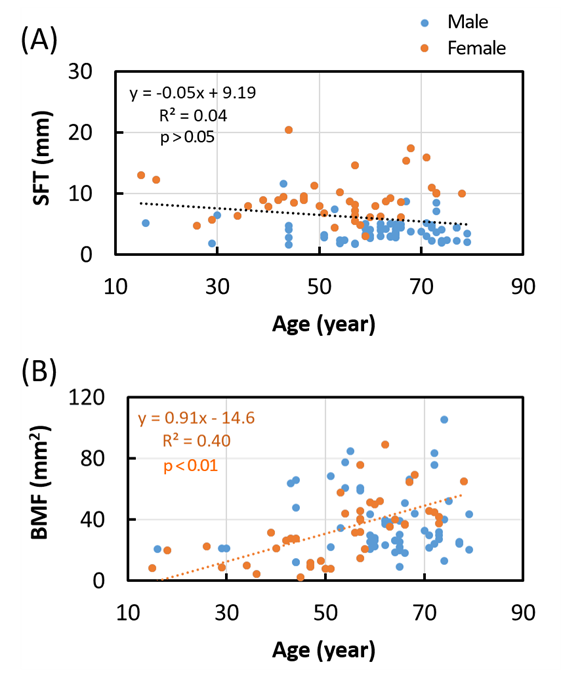
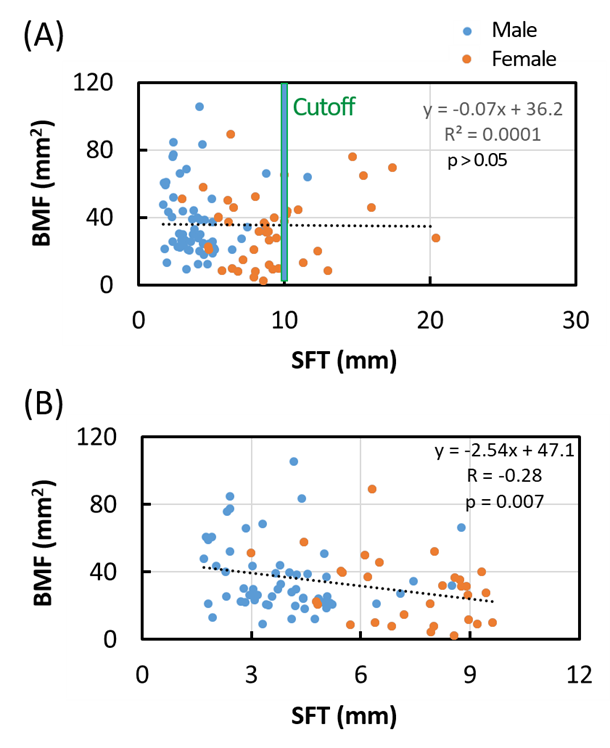
Figure 1 shows a cross-sectional segmentation of bone marrow fat (BMF) and subcutaneous fat (SF) in an example T2w MR image. Figure 2 shows the data averages for the group and for the individual measurements on BMF area and SF thickness (SFT). A statistically significant difference is found between male (n = 59) and female (n = 43) in SFT, but not in BMF. Body-mass-index (BMI) is linearly correlated with SFT in women, but not in men (Figure 3] ). Similarly, there is a linear correlation between age and BMF in women, but not in men (Figure 4). BMF is weakly correlated to SFT for the entire group (n = 102), but strongly for a subgroup of lean subjects with SFT < 15 mm (n = 88, 30 F and 58 M, Figure 5).Discussion
There has been great research interest in sex differences with respect to fat storage, fat metabolism and health risks from obesity. The data in this study clearly shows a sex difference in affecting the relation of BMI and age with fat storage in bone marrow fat and subcutaneous fat tissue in lower extremity. The negative correlation between SFT and BWF in subjects with low fat storage in subcutaneous tissue may reflect a mechanism by which fuel reserves are balanced to meet long-term energy demand. The results suggest that exercise regimens that target the adiposity in the lower extremity may benefit women, especially elderly women, more than men.Conclusion
This study demonstrates a significant sex difference affecting fat storage in lower extremity. Future research is needed to investigate potential interplay of BMF and SFT with fat infiltration and muscle atrophy, which has been implicated in a host of metabolic conditions such as insulin resistance, type 2 diabetes and cardiovascular events.Acknowledgements
This material is based upon work supported by the National Science Foundation (NSF) MPS-Ascend Postdoctoral Research Fellowship under Grant No. 2138142, the Charles and Jane Pak Center for Mineral Metabolism and Clinical Research. The authors are grateful for the assistance in data acquisition and management.References
1. Nazha A, Komrokji R, Meggendorfer M, Jia X, et al. Personalized Prediction Model to Risk Stratify Patients With Myelodysplastic Syndromes. J Clin Oncol. 2021;39(33):3737-3746.
2. Karastergiou K, Smith SR, Greenberg AS, Fried SK. Sex differences in human adipose tissues - the biology of pear shape. Biol Sex Differ. 2012;3(1):13.
3. Liang J, Zhang H, Sun X, Liao L, Li X, Hu X, Du J, Zhuang X, Liao X. Association between calf girth and peripheral artery disease in the Atherosclerosis Risk in Communities Study. J Cardiol. 2020;76(3):273-279.
4. Verma S, Rajaratnam JH, Denton J, et al. Adipocytic proportion of bone marrow is inversely related to bone formation in osteoporosis. J Clin Pathol. 2002; 55(9):693–8.
5.Justesen J, Stenderup K, Ebbesen EN, et al. Adipocyte tissue volume in bone marrow is increased with aging and in patients with osteoporosis. Biogerontology. 2001; 2(3):165–71.
Figures