2256
Simplified, ‘single-step’ segmentation and quantification of bone marrow oedema using deep learning1Centre for Medical Imaging, University College London, London, United Kingdom, 2Rheumatology, University College London Hospital, London, United Kingdom, 3Centre for Medical Image Computing, University College London, London, United Kingdom
Synopsis
Keywords: Bone, Inflammation
We present a deep learning workflow which segments and quantifies bone marrow oedema (BMO) in a single deep learning step. Detection and quantification of BMO plays a crucial role in diagnosis and monitoring of patients with inflammatory diseases of the skeleton, including spondyloarthritis (SpA), and various segmentation methods have been developed to facilitate BMO quantification. However, previous attempts have used multiple algorithms in sequence to achieve satisfactory performance. To improve on this, we propose a simplified approach that avoids the need for such sequential algorithms, thus simplifying the workflow, eliminating potential error sources and reducing the need for human input.Introduction
The identification of bone marrow oedema (BMO) on MRI is central to the assessment of inflammation, and thus the diagnosis and management, of patients with axial spondyloarthritis (axSpA). Recently, various segmentation methods have been developed improve the consistency of BMO quantification. However, BMO-segmentation algorithms face numerous challenges, including the fact that inflammation may produce only subtle, poorly-defined intensity changes, which may be present in only very small quantities, leading to a substantial class imbalance in the labels.To address these problems, previous attempts have utilised multiple algorithms in sequence, first segmenting bone before performing lesion classification, arguing that these tasks are simpler when performed separately. For example, Rzecki et al. used a U-Net-like architecture to segment bone before using a visual geometry group-like (VGG-like) network to classify inflammation, arguing that the U-Net would perform poorly when tasked with direct segmentation of inflammation due to the relative rarity of inflammation (whereas normal bone could be segmented easily).1 Similarly, Hepburn et al. first segmented ‘potentially-inflamed’ bone and then used thresholding to identify areas of inflammation. This has the disadvantage that substantial human input is required at multiple steps in the pathway to remove erroneous regions in the bone segmentation and in the final inflammation segmentation, making this time-consuming and subjective.2
Here, we investigate the feasibility of segmenting and quantifying inflammation in a single deep learning step, aiming to simplify the workflow and reduce potential sources of error and the need for human input.
Methods
Study cohortData were taken from a prospective study including 29 patients with axSpA3. All participants underwent pre- and post-biologic therapy MRI scans of the sacroiliac joints. 3T short T1 inversion recovery (STIR) images were acquired in an oblique coronal plane. The dataset was partitioned into 17 subjects for training, 6 for validation and 6 for testing.
Training labels
STIR images were labelled using the semiautomated ‘two-step’ procedure described by Hepburn et al,2 by two radiologists. Voxels included by both radiologists were taken as inflammation.
U-Net
We used a fully convolutional U-net generated in Matlab2022a using unetlayers with encoder depth 4. Training was performed using an Adam optimiser with cross entropy loss, learning rate 0.00002, and minibatch size 30. An ensemble of three models was trained; the model with the best validation performance was selected for evaluation. Class weights of 0.9/0.1 (inflammation/background) were used to deal with class imbalance. In addition to standard augmentations (random flipping, warping and cropping), a novel contrast augmentation procedure was added to further improve robustness to intensity variations. Specifically, for each augmentation instantiation, the top k% of all pixel intensity values were saturated; k is a randomly chosen value between 0 and 50. The importance of this augmentation procedure was assessed using an ablation experiment.
Evaluation
Performance was assessed by (i) visual inspection of the predictions against the ground truth, (ii) formal segmentation metrics (Dice score, recall [sensitivity] and precision), (iii) agreement between the predicted inflammation volume (lesion load) and the ground truth volume.
Results and Discussion
Examples of segmentation results for two subjects in the test dataset are shown in Figures 2,3&4.Corresponding performance evaluations are shown in Figure 5. Visual inspection of the predictions reveals plausible segmentations in all subjects. In some cases (Figure 2), the predictions were arguably superior to the ground-truth labels, producing a more complete delineation of areas of inflammation. Even areas of very subtle inflammation could be detected in some cases (Figure 3), although some subtle areas were also missed and there were some examples of erroneous segmentation of non-bone structures. In one case with a large volume of diffuse inflammation (Figure 4), the inflammation volume was underestimated, possibly because disease of this type had not been seen in the training set. Nonetheless, a large volume of inflammation was segmented.
The mean performance metrics on the test dataset were: Dice score 0.38, sensitivity 0.40, precision 0.57. Note that, as shown by Figure 5, the Dice score is heavily dependent on inflammation volume (this also applies to sensitivity and recall). These metrics may therefore provide a disproportionately harsh assessment of performance, since many subjects have only small volumes of disease. Importantly, the deep learning-derived inflammation volume measurements show good agreement with the label-derived measurements, supporting the potential clinical utility of the measurement (Figure 5).
Ablation of the intensity-based preprocessing caused a substantial deterioration in performance (Dice score 0.29, sensitivity 0.30, precision 0.55), emphasising the importance of this step.
Note that the training labels used in this study were provided by a semiautomated, two-step procedure, which may itself be suboptimal. To provide a definitive performance comparison, future studies could directly compare the performance of one-step and two-step procedures using consensus labels produced by a number of radiologists as a ground truth. This work lays the foundations for this future work by showing that one-step segmentation is feasible, and identifying augmentation procedures that are particularly beneficial to its performance.
Conclusion
We show that BMO segmentation is feasible without using multiple algorithms in sequence. This simplifies the workflow, minimises potential sources of error and reduces the need for human input.Acknowledgements
Timothy J.P. Bray was supported by an NIHR Clinical Lectureship (CL-2019-18-001) and the UCL/UCLH NIHR Biomedical Research Centre (BRC). The research was supported by Action Medical Research, the Albert Gubay Foundation, the Humanimal Trust, the Rosetrees Trust and The Stoneygate Trust. Alexis Jones and Margaret A. Hall-Craggs are supported by the National Institute for Health Research NIHR BRC. This work was undertaken at UCLH/UCL, which receives funding from the UK Department of Health’s NIHR BRC funding scheme. The views expressed in this publication are those of the authors and not necessarily those of the UK Department of Health.References
1. Rzecki, K. et al. Fully automated algorithm for the detection of bone marrow oedema lesions in patients with axial spondyloarthritis – Feasibility study. Biocybern Biomed Eng 41, 833–853 (2021).
2. Hepburn, C. et al. Volume of hyperintense inflammation (VHI): a deep learning-enabled quantitative imaging biomarker of inflammation load in spondyloarthritis.
3. Sieper, J. et al. The Assessment of SpondyloArthritis international Society (ASAS) handbook: A guide to assess spondyloarthritis. Ann Rheum Dis 68, (2009).
Figures
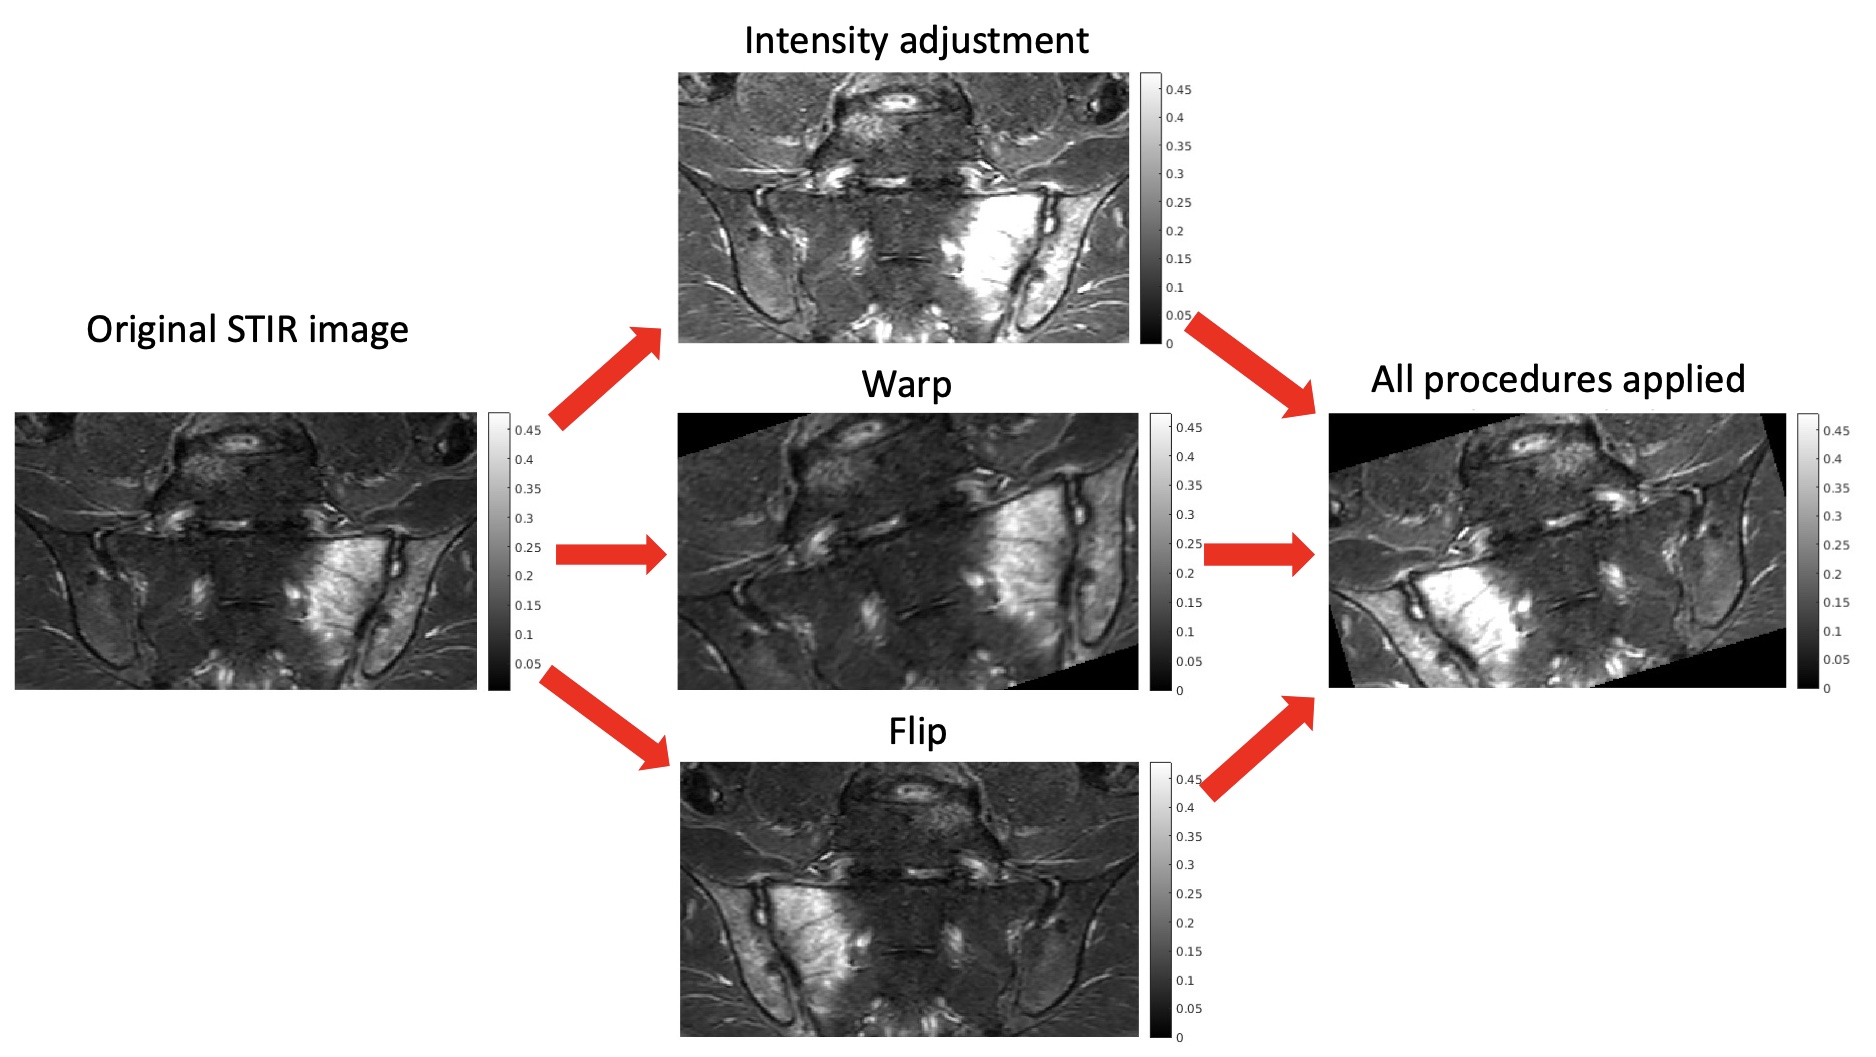
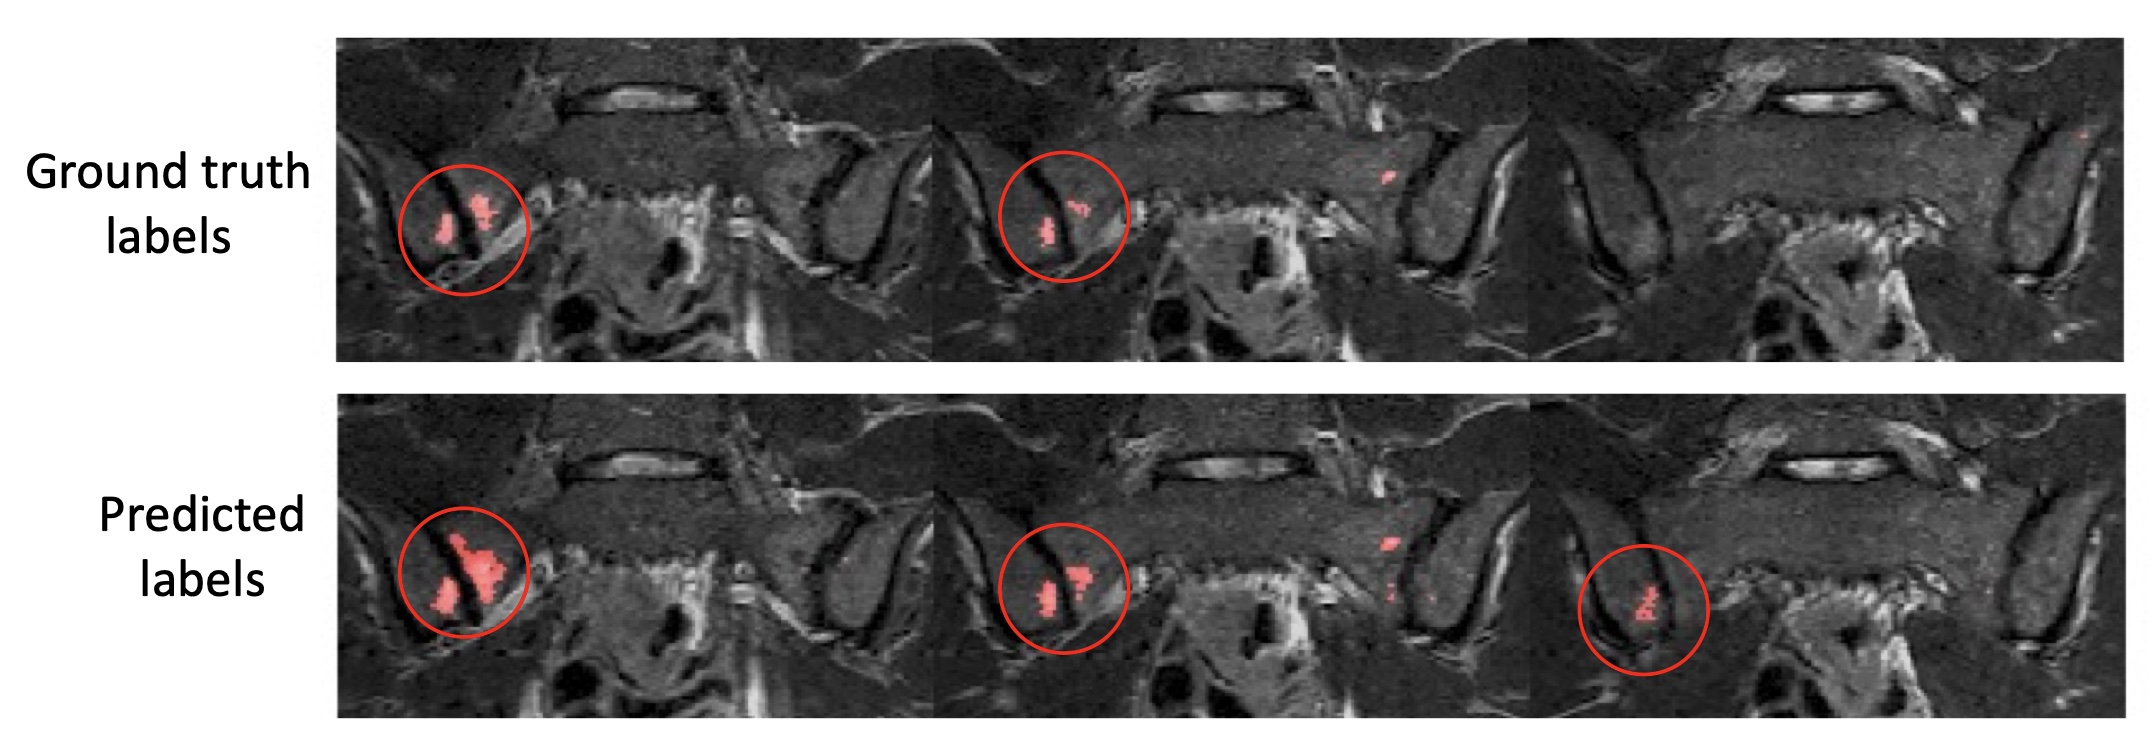
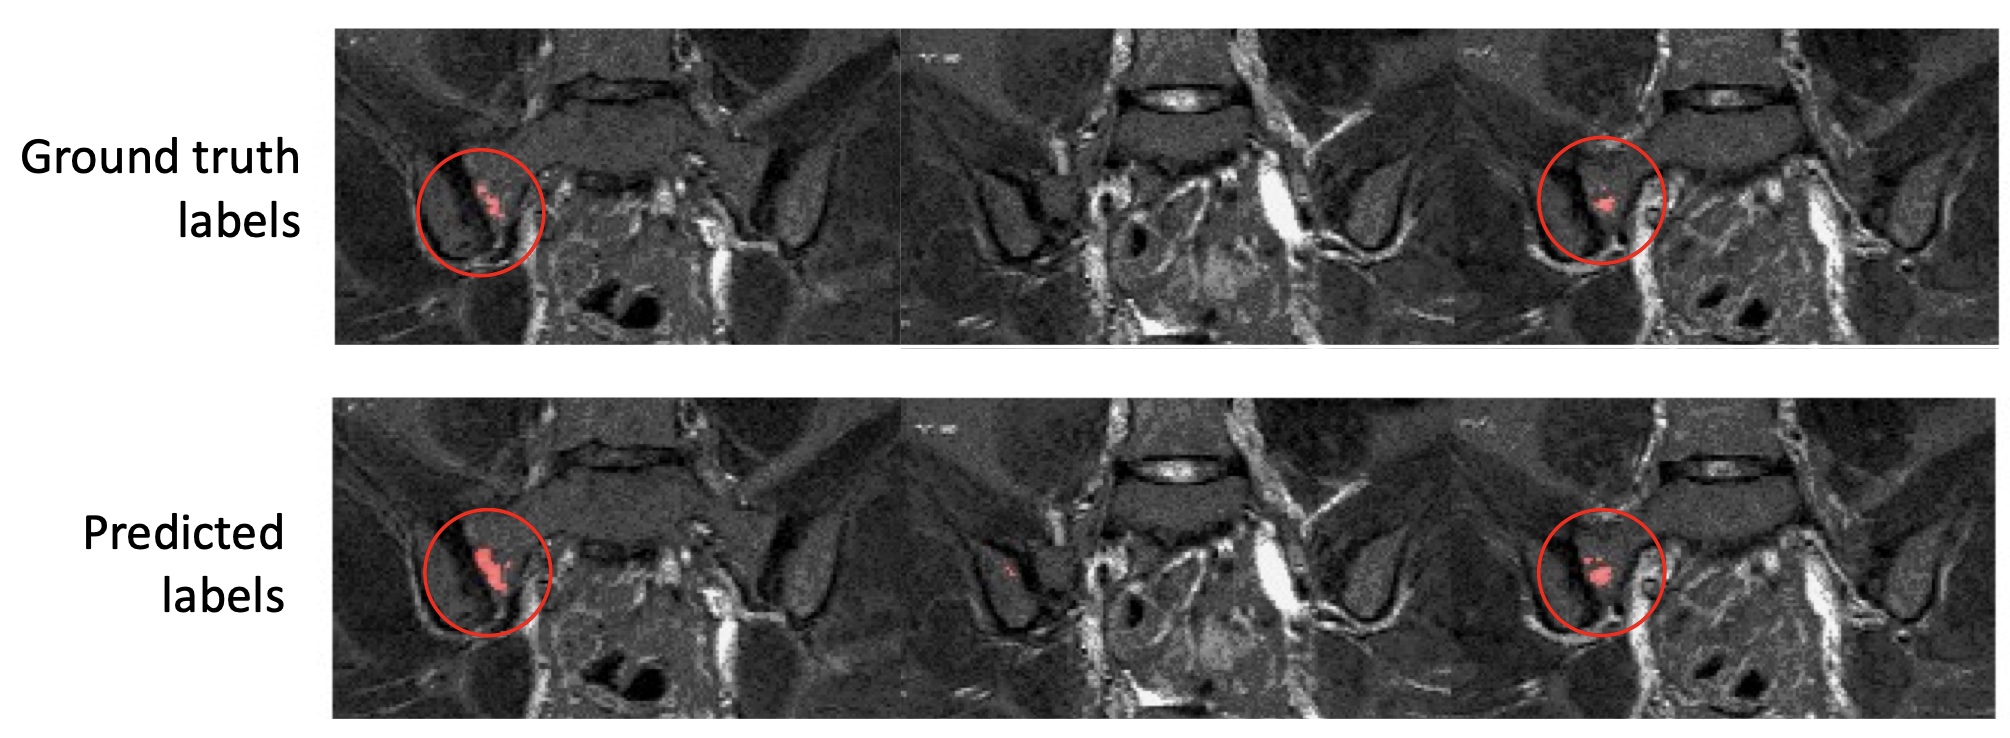
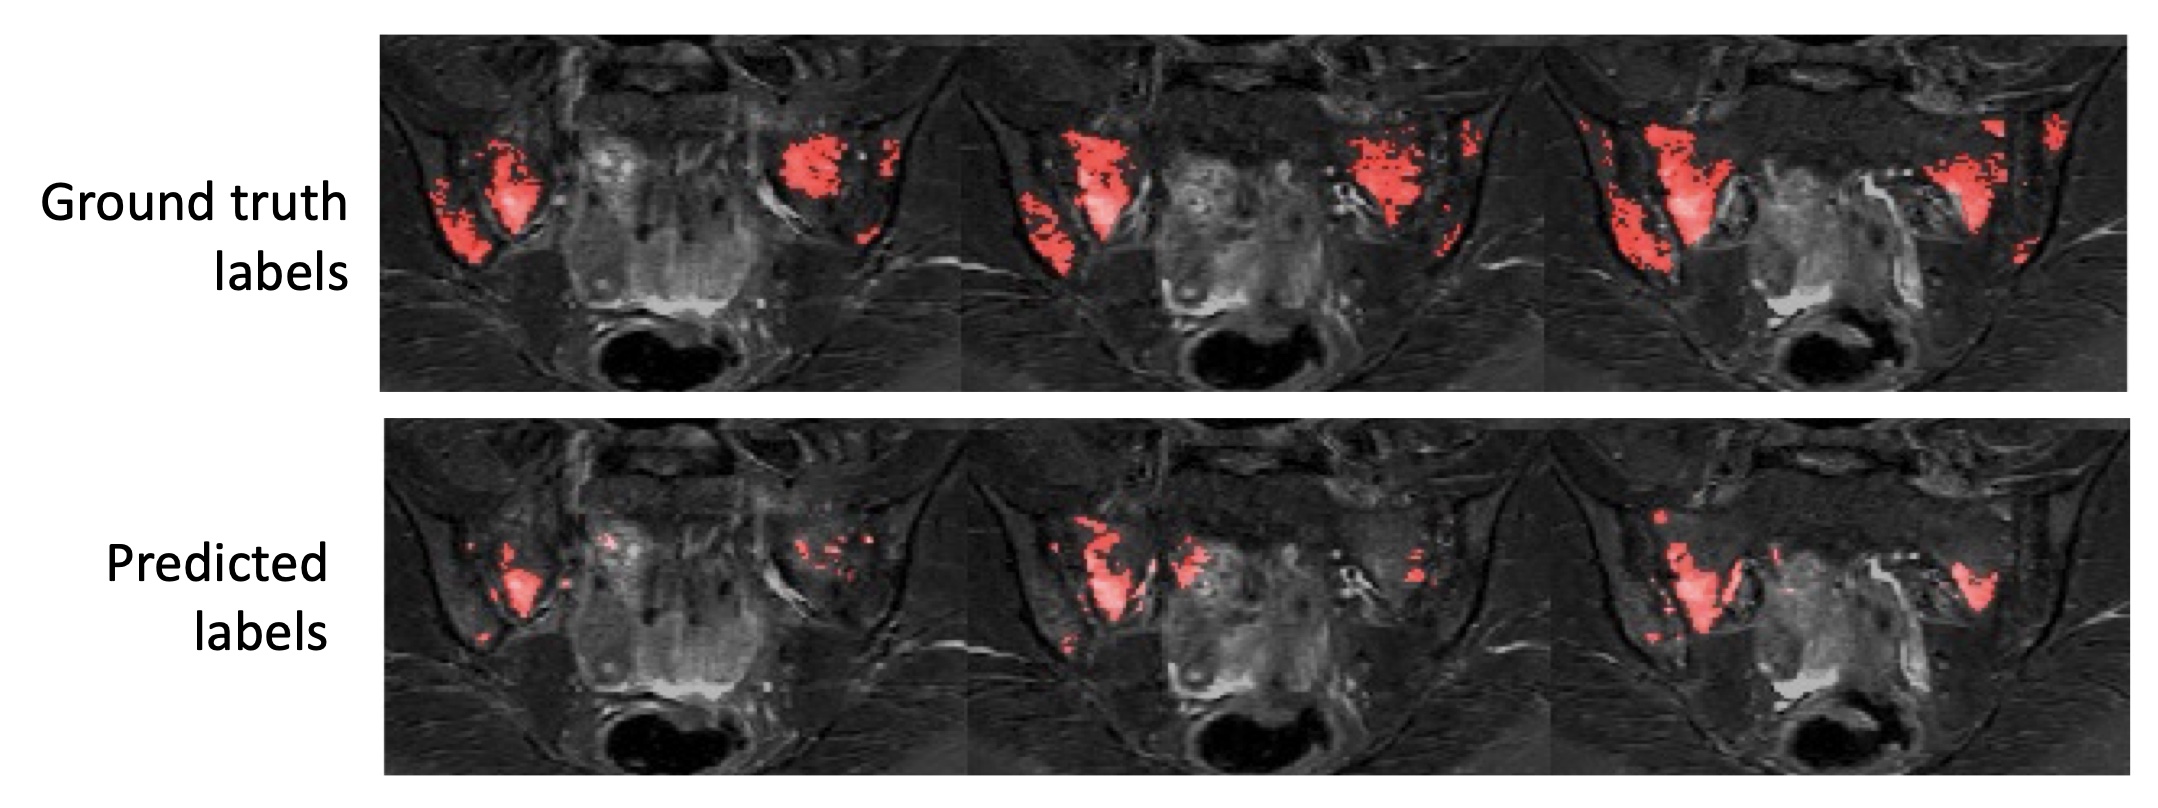
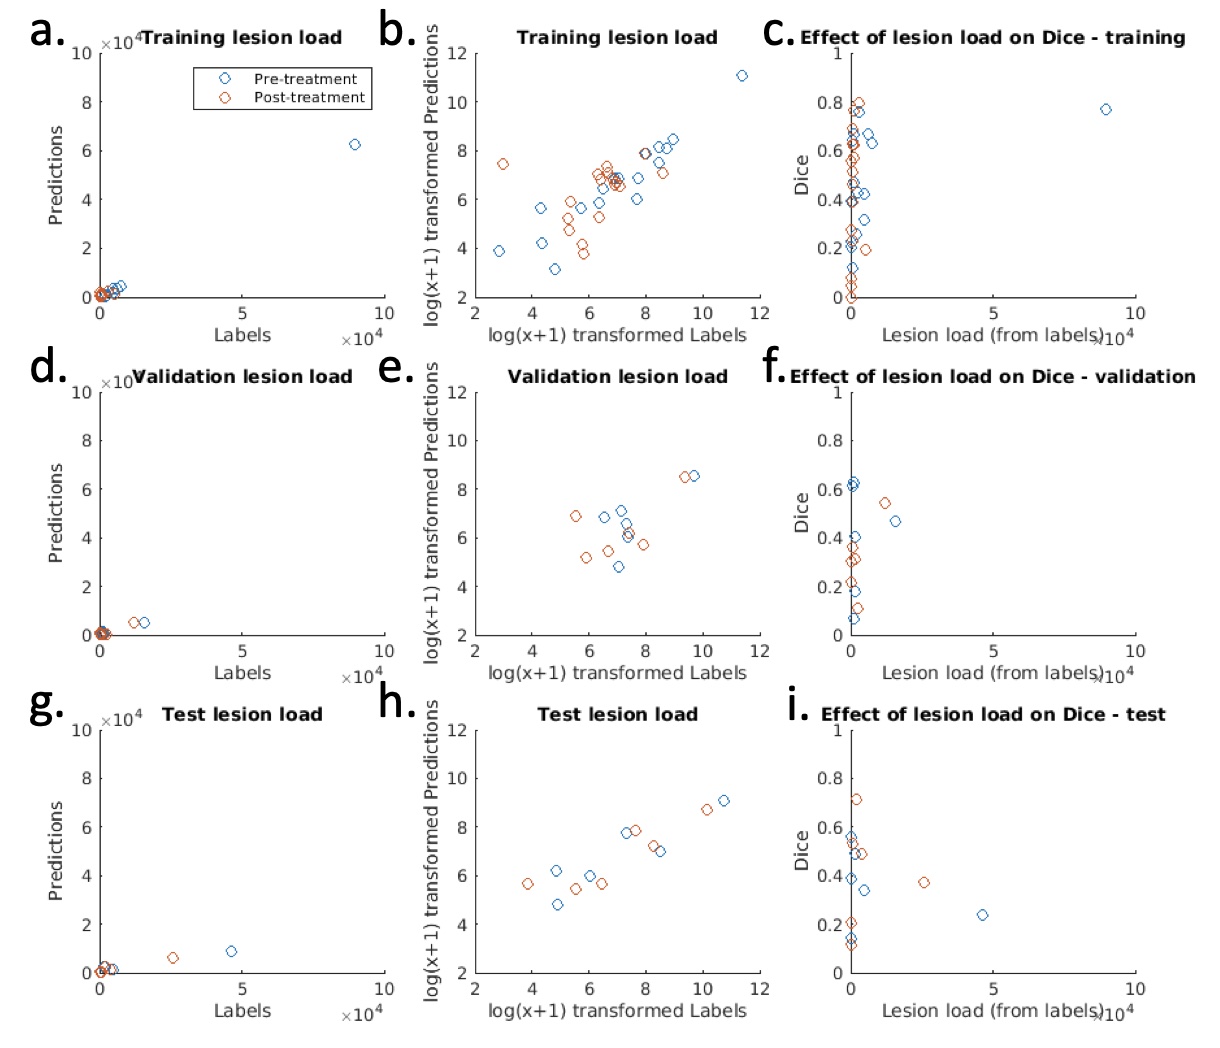
Figure 5 – Inflammation volume measurements and Dice scores for each subject in training, validation and test datasets. The left-hand column shows the agreement between the inflammation volume predictions (y-axis) and the inflammation volume derived from the labels (x-axis). As the data are heavily skewed, a log(x+1) transformation (second column) is used to improve visualization. This shows good agreement between predictions and labels for all three datasets. The right-hand column shows the effect of inflammation volume on Dice score.