2244
Comparison of the diagnostic performance in the HCC with cirrhosis between the 2017 and 2018 versions of LI‑RADS based on Gd‑EOB‑DTPA enhanced MRI1the Third Affiliated Nantong Hospital of Nantong University, Nantong, China, 2Philips Healthcare, Beijing, China, 3Philips Healthcare, Shanghai, China
Synopsis
Keywords: Liver, Cancer, HCC
The Liver Imaging Reporting and Data System (LI-RADS) is widely adopted for noninvasive diagnosis of hepatocellular carcinoma (HCC). It’s updated to version 2018 recently, with some major changes compared with v2017.Therefore, the aim of this study was to compare the diagnostic performances of LI-RADS for diagnosing HCC between v2017 and v2018 based on Gd-EOB-DTPA enhanced MRI.Introduction
The Liver Imaging-Reporting and Data System (LI-RADS) is a comprehensive system to standardise interpretation and radiological reporting in patients at risk of hepatocellular carcinoma (HCC)1. In LI-RADS v2018, the definition of threshold growth was revised and simplified to ≥50% diameter increase in <6 months to achieve concordance with definitions advocated by AASLD and the OPTN. Another major revision was that the criteria of LR-5 (10-19 mm + arterial phase hyperenhancement [APHE] + washout = LR-5), which was revised to match those advocated by AASLD. LR-5g and LR-5us were eliminated in v2018 compared with v2017. All these revisions have an important impact on observation categorization based on the CT/MRI diagnostic table in LI-RADS v2018, compared with v20172-6. Therefore, the purpose of this study was to compare the performance of LI-RADS between v2017 and v2018 for the non-invasive diagnosis of HCCs using gadoxetic acid-enhanced MRI and to evaluate the effect of revisions introduced in v2018.Methods
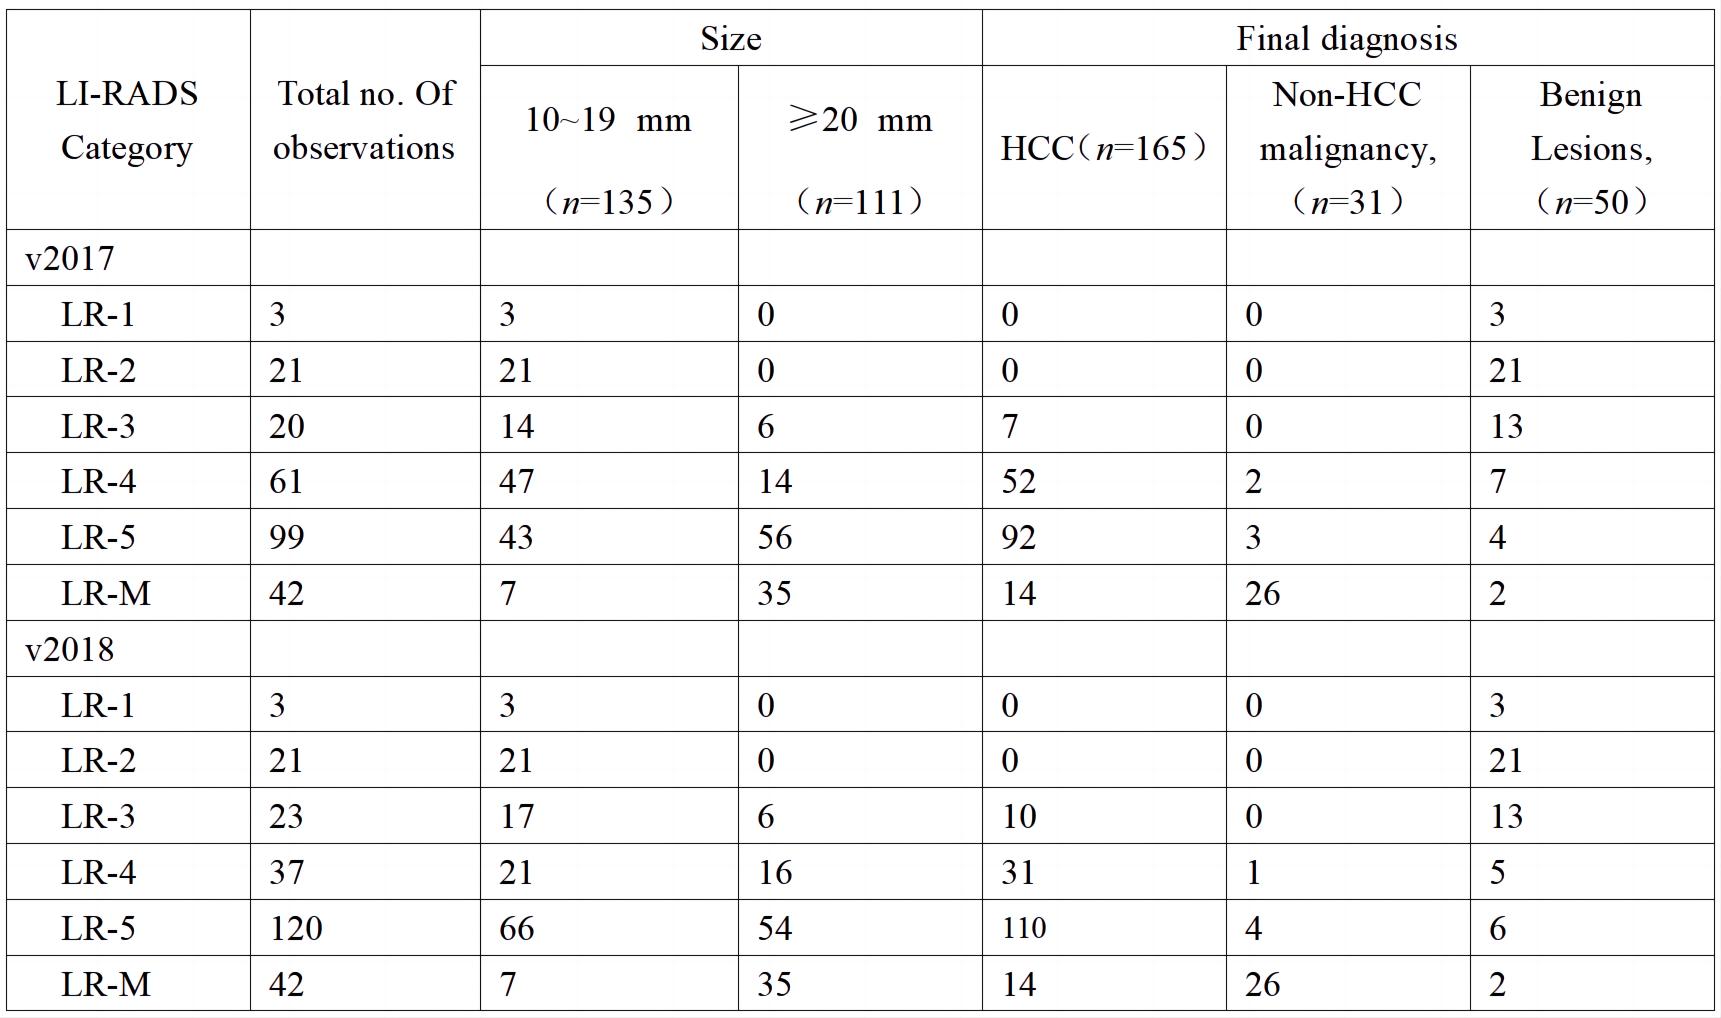
Clinical data of 213 patients with 246 hepatic lesions with cirrhosis who underwent Gd‑EOB‑DTPA enhanced MRI in the Third Affiliated Nantong Hospital of Nantong University from October 2015 to July 2020 were retrospectively collected. The MRI major features and LR categories of lesions were respectively reviewed by two radiologists according to LI‑RADS v2017 and LI‑RADS v2018, respectively. Taking postoperative histopathological results or follow‑up imaging as references, with the LR‑5 and LR‑4+ LR‑5 as the diagnosis of HCC, the sensitivity, specificity and accuracy of the LI‑RADS v2017 and LI‑RADS v2018 were evaluated, respectively. The McNemar test or Fisher exact test was used to compare the diagnostic performance between the two LI‑RADS versions.Results
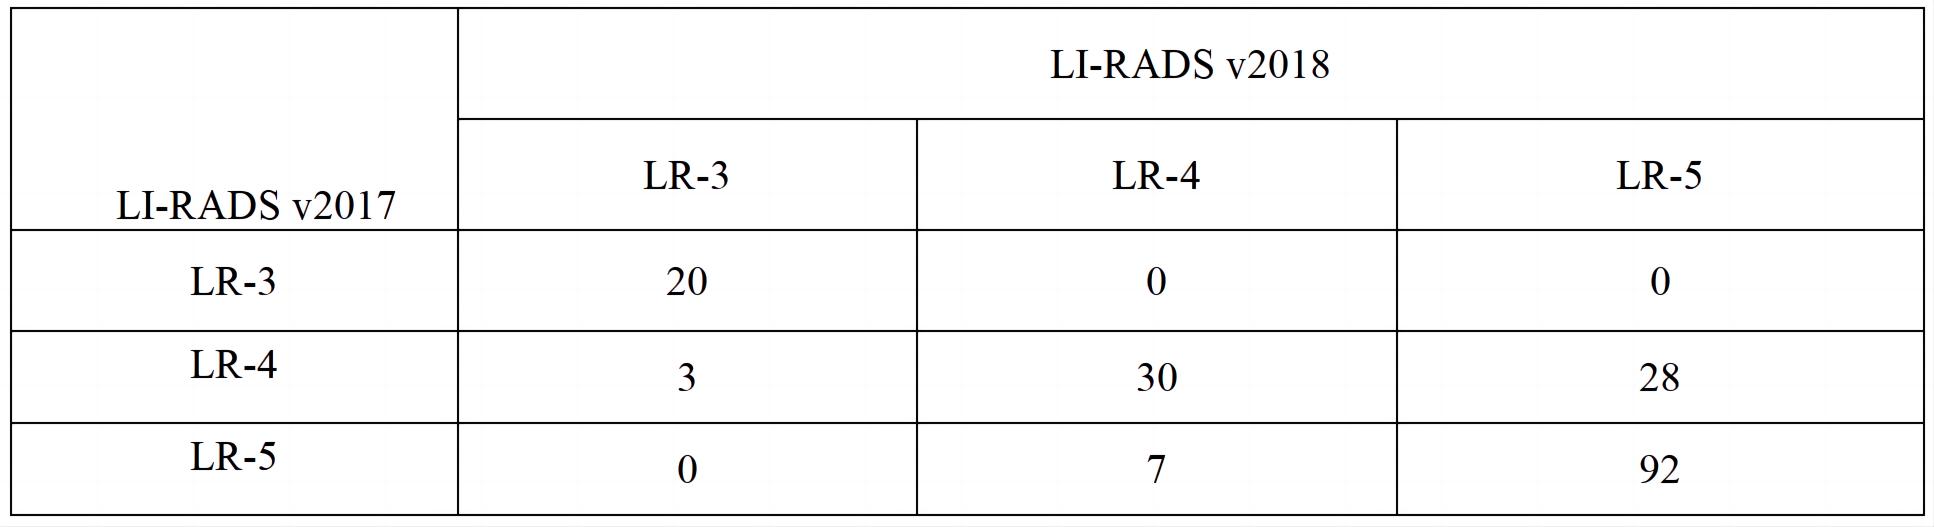
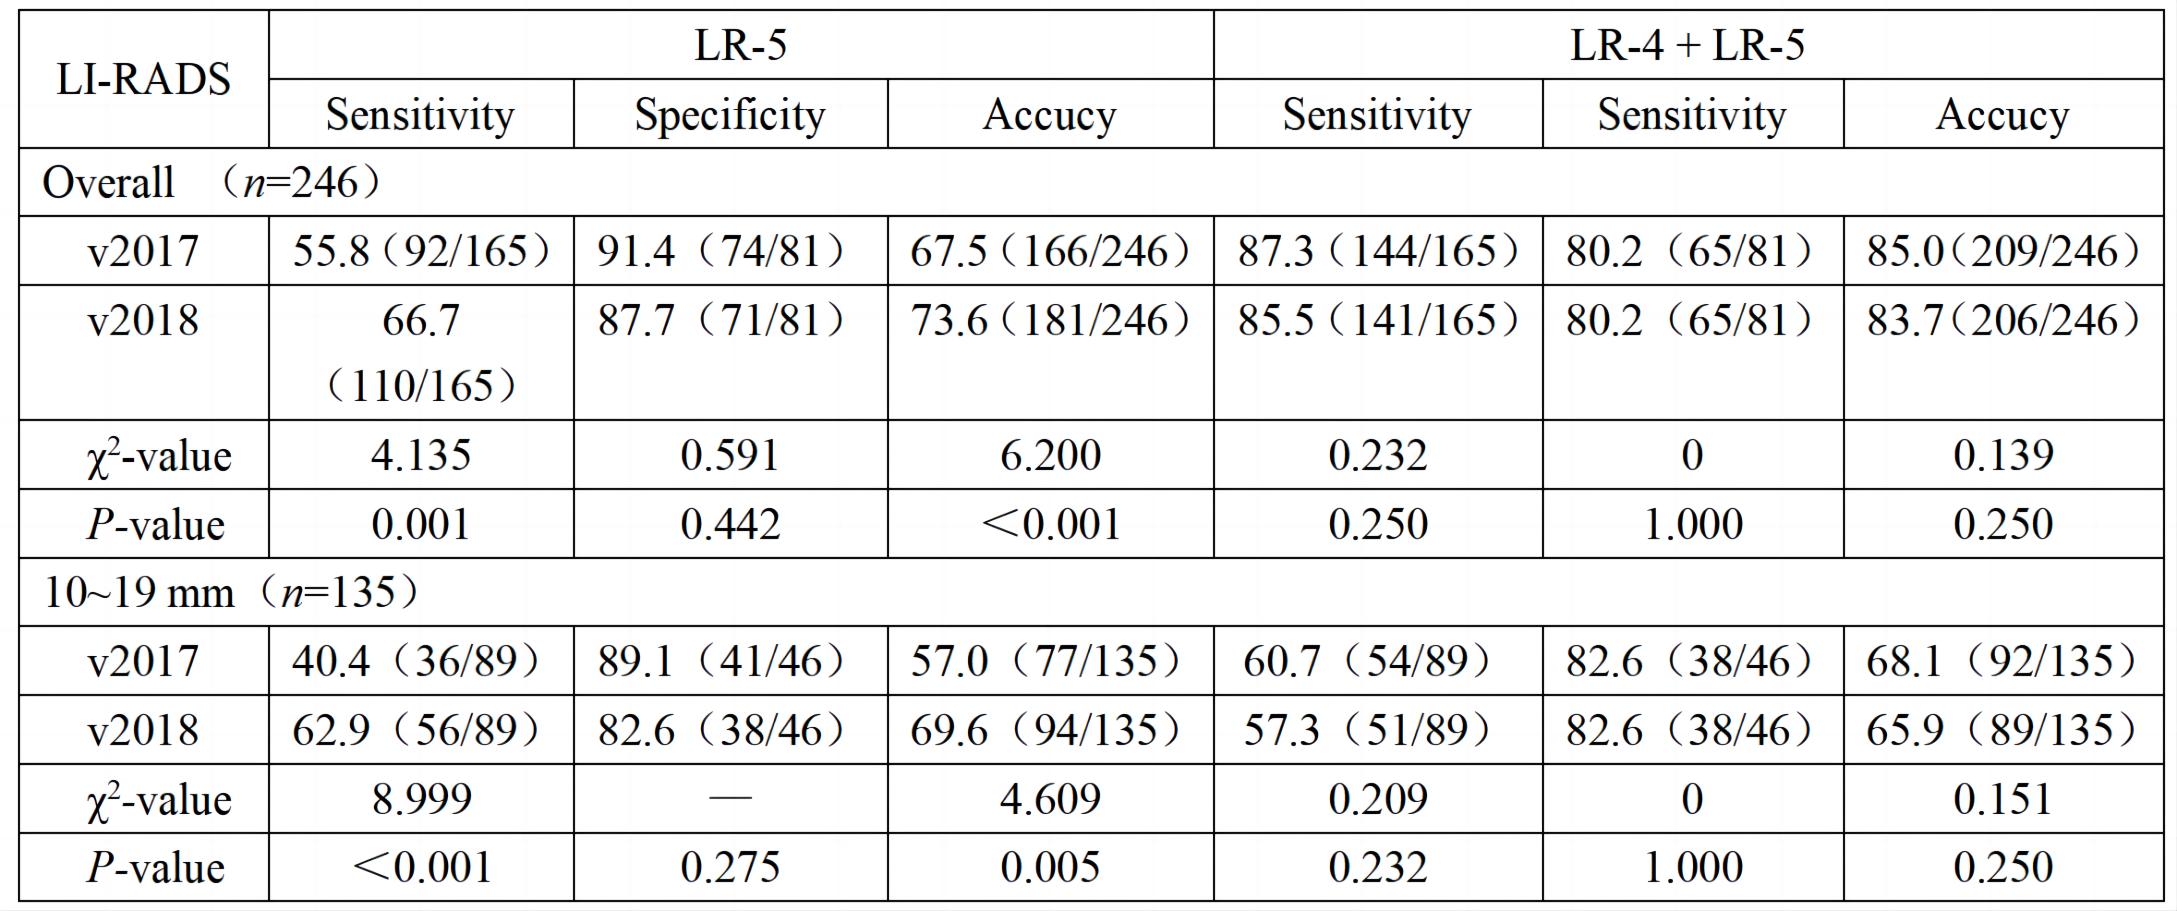
Results In 246 hepatic lesions, 165 were HCCs, 31 were non‑HCC malignancies and 50 were benign lesions. Due to the threshold growth and more simplified definition and changes in the LR‑5 classification criteria in LI‑RADS v2018, the categories of 38 (15.4%, 38/246) lesions were changed. The threshold growths of 84.6% (33/39) lesions in v2017 were reclassified to subthreshold growth in v2018. Using LI‑RADS v2018, 10 lesions were down‑categorized compared with LI‑RADS v2017, including LR‑5 to LR‑4 in 7 lesions and LR‑4 to LR‑3 in 3 lesions, and 28 lesions were up‑categorized LR‑4 to LR‑5, in which 25 were small HCC. With LR‑5 as the diagnosis criteria of HCC, the sensitivity and accuracy of LI‑RADS v2018 were 66.7% (110/165) and 73.6% (181/246); and the sensitivity and accuracy of LI‑RADS v2017 were 55.8% (92/165) and 67.5% (166/246), both with statistical differences (χ² = 4.13, P=0.001, χ² =6.20, P<0.001). No significant difference was found in the specificity values of LI‑RADS v2018 and v2017 [87.7% (71/81) vs. 91.4% (74/81)], χ²=0.59, P=0.442). Compared with v2017, LI‑RADS v2018 increased the sensitivity in the diagnosis of small HCC lesions (10-19 mm) [62.9% (56/89) vs. 40.4% (36/89), χ²=9.00, P<0.001]. With LR‑4+LR‑5 as the diagnostic criteria of HCC, there was no significant difference in the sensitivity, specificity and accuracy of LI‑RADS v2017 and v2018 in the diagnosis of HCC (all P>0.05).Conclusion
Conclusions Based on Gd‑EOB‑DTPA enhanced MRI, LI‑RADS v2018 has higher sensitivity and similar specificity in the diagnosis of HCC compared to v2017, especially in the diagnosis of small HCC (10-19 mm).Acknowledgements
No acknowledgement foundReferences
1. American College of Radiology (ACR). CT/MRI LI-RADS v2018. ACR website. www.acr.org/Clinical-Resources/Reporting-and-Data-Systems/LI-RADS/CT-MRI-LI-RADS-v2018.
2. Heimbach JK, Kulik LM, Finn RS, et al. AASLD guidelines for the treatment of hepatocellular carcinoma[J]. Hepatology, 2018, 67(1): 358-380.
3.Yoon JH, Lee JM, Lee YJ, et al. Added value of sequentially performed gadoxetic acid-enhanced liver MRI for the diagnosis of small (10-19 mm) or atypical hepatic observations at contrast-enhanced CT: a prospective comparison[J]. J Magn Reson Imaging, 2019, 49(2): 574-587.
4. Song JS, Choi EJ, Hwang SB, et al. LI-RADS v2014 categorization of hepatocellular carcinoma: Intraindividual comparison between gadopentetate dimeglumine-enhanced MRI and gadoxetic acid-enhanced MRI[J]. Eur Radiol, 2019, 29(1): 401-410.
5. Lee SM, Lee JM, Ahn SJ, et al. LI-RADS version 2017 versus version 2018: diagnosis of hepatocellular carcinoma on gadoxetate disodium-enhanced MRI[J]. Radiology, 2019, 292(3): 655-663.
6.Ko A, Park HJ, Lee ES, et al. Comparison of the diagnostic performance of the 2017 and 2018 versions of LI-RADS for hepatocellular carcinoma on gadoxetic acid enhanced MRI[J]. Clin Radiol, 2020, 75(4): 319.e1-319.e9.
Figures