2233
Effectiveness of T2-mapping imaging in assessing disease severity in Spinal muscular atrophy: preliminary study1China Medical University, Shenyang, China, 2Department of Radiology, Shenzhen Children's Hospital, Shenzhen, China, 3Shantou University Medical College, Shantou, China, 4Internal Medicine-Neurology, Shenzhen Children's Hospital, Shenzhen, China, 5Philips Healthcare, Guangzhou, China
Synopsis
Keywords: Data Analysis, Quantitative Imaging, T2-mapping
To evaluate the potential of T2-mapping imaging as a qMRI marker for disease severity in Spinal muscular atrophy (SMA), we compared the T2 with muscle fat fraction (MFF), and clinical assessment of 13 muscles in the pelvis and thighs of 20 patients with SMA. A significant correlation was found between the mean T2 of all muscles and the patient’s clinical evaluation and MFF. Moreover, the highest mean T2 was found in the gluteus maximus, while the lowest in the adductor longus. Therefore, T2 mapping can be used as a quantitative and objective MRI technique to assess disease severity in SMA.
Introduction
Spinal muscular atrophy (SMA) is one of the most common fatal autosomal recessive diseases in infants[1], which is caused by the mutation of the motor neuron survival gene 1 (SMN1), with an incidence rate of 1/10000-1/6000[2, 3]. A Recent report suggested that SMA patients had significant motor function improvement treated with nusinersen[4]. However, the proposed tools measure only gross decremental changes in muscle strength or function, entirely rely on patient compliance[5]. Therefore, it is important to have a noninvasive way to quantify the disease state or therapeutic effects. Skeletal quantitative MRI is a preferred clinical tool to evaluate the involvement patterns or severity in neuromuscular diseases[6], such as chemical-shift water-fat MRI[7], T2 relaxometry[8] and magnetic resonance spectroscopy[9, 10], which have also been shown to reliably assess muscle tissue characteristics in neuromuscular diseases[11, 12]. Therefore, the purpose of this study was to analyze T2 maps of individual pelvic and thigh muscles to try to identify a characteristic disease distribution in SMA. We also aimed to evaluate the efficiency of T2 as a means of objectively measuring SMA disease activity by comparing the T2 with muscle fat fraction (MFF) and clinical assessment.Methods
20 patients (mean, 5.9 ± 2.9 years) with SMA undergoing clinical evaluation (age, BMI, and Motor functional scale), conventional MR imaging, mDixon Quant and T2 mapping imaging of the right thigh were enrolled in this study. The Hammersmith Functional Motor Scale Expanded (HFMSE) was used as an assessment tool of physical abilities in SMA[13, 14]. All MRI scans were performed on a 3-T MR System (Philips, Ingenia, The Netherlands) using a 16-element receiver coil. For each dataset, T2 and MFF were individually measured for the following muscles: pelvis (gluteus maximus, sartorius, tensor fascia lata), thigh (rectus femoris, vastus medialis, vastus lateralis, vastus intermedius, semimembranosus, semitendinosus, biceps femoris long head, adductor magnus, adductor longus and gracilis). The image slice that provided maximal transverse cross sectional area of each muscle was selected for measurement. Color-coded parametric maps of T2 were also obtained. The Spearman correlation coefficients model was used to evaluate the correlation between mean T2 and clinical assessments (age, BMI, HFMSE, and MFF). A two-way analysis of variance was used to evaluate the T2 responses for the various muscles. The differences between groups or correlation are considered to be significant if the P-value < 0.05. All statistical analysis was performed by using SPSS version 25 for Windows.Results
The highest mean T2 was found in the gluteus maximus (mean, 64.5 ± 7.8 ms), while the lowest in the adductor longus (mean, 43.7 ± 6.2 ms). The mean T2 of the adductor longus muscle was significantly shorter than that of the other muscles (P < 0.05), except for semitendinosus muscle. A significant correlation was found between the mean T2 value of all muscles and the patient’s age (r = 0.592, P < 0.05), HFMSE (r = -0.705, P < 0.01), and MFF (r = 0.892, P < 0.001). The maximum correlation coefficient was found between the T2 of the gluteus maximus muscle and HFMSE (r = -0.691; P < 0.05).Discussion
In our study, the gluteus maximus muscle consistently had the highest T2 and greatest FF, and the numeric values obtained from these two different parameters show statistically significant correlations, which suggesting that T2 mapping is a quantitative and objective method to measure fatty infiltration within the muscle. Moreover, T2 mapping technique allows accurate evaluation of single muscle involvement, which is a very important parameter for therapy. And T2 color-coded mapping is a rapid visual method of assessment of muscle involvement that could turn out to be useful for the injection of drugs. Therefore, the use of T2 calculation in patients undergoing treatment would provide additional information on its sensitivity when monitoring therapy effects.In addition, our study found a negative correlation between the mean T2 of total muscles and HFMSE, which indicated MRI calculation of T2 can reflect the disease severity in patients with SMA. For each muscle, the maximum correlation coefficient was found between the T2 of the gluteus maximus muscle and motor function, therefore was shown to be the one most consistently involved in the disease and the one that would provide the most accurate indication of disease activity.
Conclusion
Our findings confirmed the existence pattern of selective muscle involvement in lower extremity muscles for SMA patients. T2 mapping can be used to monitor disease progression, severity and treatment effects in SMA patients and T2 of Gluteus maximus muscle is likely the most useful markers for the evaluation of disease severity.Acknowledgements
No acknowledgement found.References
1. Schorling DC, Pechmann A, Kirschner J: Advances in Treatment of Spinal Muscular Atrophy - New Phenotypes, New Challenges, New Implications for Care. J Neuromuscul Dis 2020, 7(1):1-13.
2. Mercuri E, Messina S, Kinali M, Cini C, Longman C, Battini R, Cioni G, Muntoni F: Congenital form of spinal muscular atrophy predominantly affecting the lower limbs: a clinical and muscle MRI study. Neuromuscul Disord 2004, 14(2):125-129.
3. Singh RN, Singh NN: Mechanism of Splicing Regulation of Spinal Muscular Atrophy Genes. Adv Neurobiol 2018, 20:31-61.
4. Finkel RS, Mercuri E, Darras BT, Connolly AM, Kuntz NL, Kirschner J, Chiriboga CA, Saito K, Servais L, Tizzano E et al: Nusinersen versus Sham Control in Infantile-Onset Spinal Muscular Atrophy. N Engl J Med 2017, 377(18):1723-1732.
5. Kriss A, Jenkins T: Muscle MRI in motor neuron diseases: a systematic review. Amyotroph Lateral Scler Frontotemporal Degener 2021:1-15.
6. Otto LAM, van der Pol WL, Schlaffke L, Wijngaarde CA, Stam M, Wadman RI, Cuppen I, van Eijk RPA, Asselman FL, Bartels B et al: Quantitative MRI of skeletal muscle in a cross-sectional cohort of patients with spinal muscular atrophy types 2 and 3. NMR Biomed 2020, 33(10):e4357.
7. Triplett WT, Baligand C, Forbes SC, Willcocks RJ, Lott DJ, DeVos S, Pollaro J, Rooney WD, Sweeney HL, Bonnemann CG et al: Chemical shift-based MRI to measure fat fractions in dystrophic skeletal muscle. Magn Reson Med 2014, 72(1):8-19.
8. Hooijmans MT, Habets LE, van den Berg-Faay SAM, Froeling M, Asselman FL, Strijkers GJ, Jeneson JAL, Bartels B, Nederveen AJ, van der Pol WL: Multi-parametric quantitative magnetic resonance imaging of the upper arm muscles of patients with spinal muscular atrophy. NMR Biomed 2022:e4696.
9. Kim HK, Serai S, Lindquist D, Merrow AC, Horn PS, Kim DH, Wong BL: Quantitative Skeletal Muscle MRI: Part 2, MR Spectroscopy and T2 Relaxation Time Mapping-Comparison Between Boys With Duchenne Muscular Dystrophy and Healthy Boys. AJR Am J Roentgenol 2015, 205(2):W216-223.
10. Habets LE, Bartels B, Asselman FL, Hooijmans MT, van den Berg S, Nederveen AJ, van der Pol WL, Jeneson JAL: Magnetic resonance reveals mitochondrial dysfunction and muscle remodelling in spinal muscular atrophy. Brain 2021.
11. Bonati U, Schmid M, Hafner P, Haas T, Bieri O, Gloor M, Fischmann A, Fischer D: Longitudinal 2-point dixon muscle magnetic resonance imaging in becker muscular dystrophy. Muscle Nerve 2015, 51(6):918-921.
12. Wokke BH, Van Den Bergen JC, Hooijmans MT, Verschuuren JJ, Niks EH, Kan HE: T2 relaxation times are increased in Skeletal muscle of DMD but not BMD patients. Muscle Nerve 2016, 53(1):38-43.
13. Sproule DM, Montgomery MJ, Punyanitya M, Shen W, Dashnaw S, Montes J, Dunaway S, Finkel R, Darras B, Vivo DC et al: Thigh muscle volume measured by magnetic resonance imaging is stable over a 6-month interval in spinal muscular atrophy. J Child Neurol 2011, 26(10):1252-1259.
14. Vuillerot C, Payan C, Iwaz J, Ecochard R, Berard C, Group MFMSMAS: Responsiveness of the motor function measure in patients with spinal muscular atrophy. Arch Phys Med Rehabil 2013, 94(8):1555-1561.
Figures
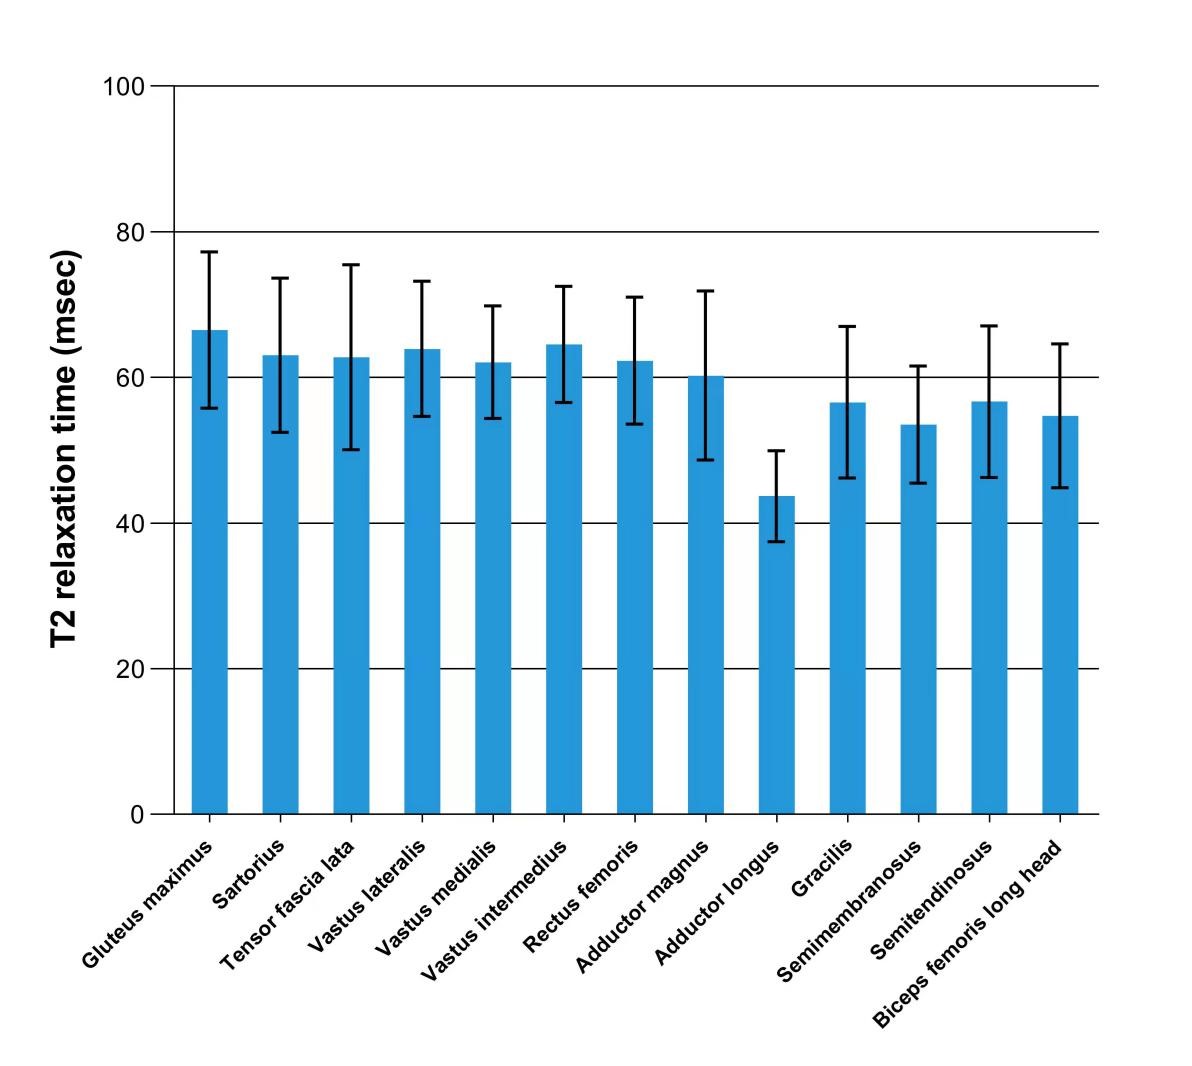
Fig. 1 Bar chart shows mean T2 (mean ± SD) of 13 pelvic and thigh muscles in 20 patients. The gluteus maximus muscle has the highest mean T2 and the adductor longus muscle has the lowest.
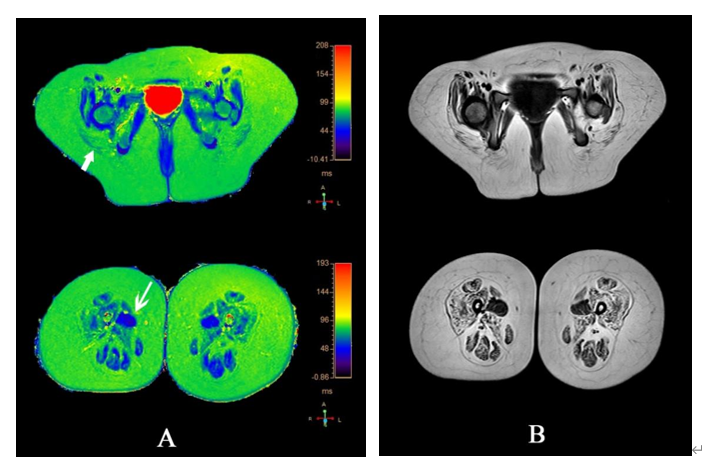
Fig. 2 Images in a 7-year-old girl with SMA. A, Color-coded axial T2 maps (in milliseconds) used to identify the T2 of 13 muscles in pelvis and thigh, The longest T2 (82.69) was documented in the gluteus maximus (short arrow), The shortest T2 (43.54) was documented in the adductor longus (long arrow). B, Axial T1 maps used for placement of the ROI.
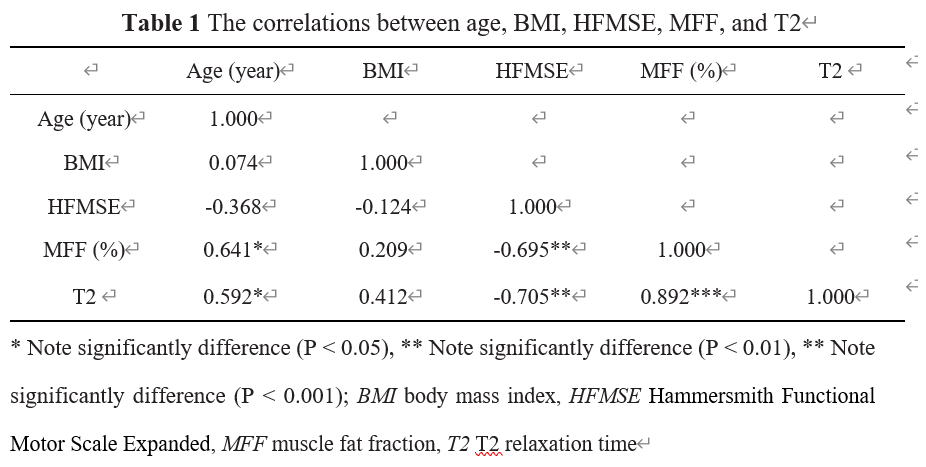
Table 1 provides the simple correlations among these variables.
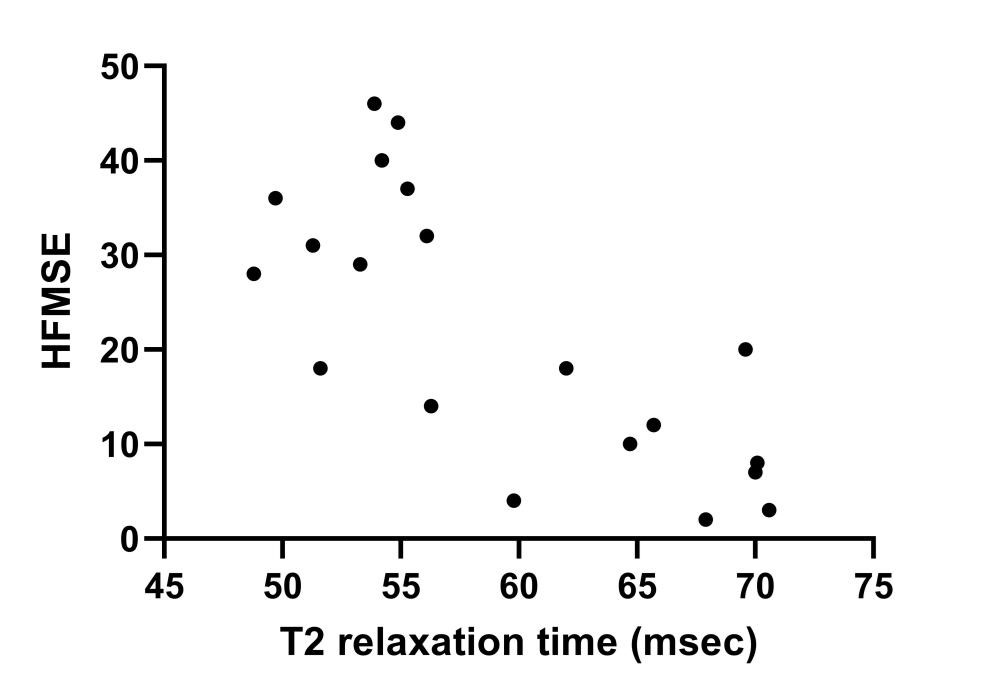
Fig. 3 Graph shows correlation between T2 and HFMSE in 20 patients. A significant negative correlation was observed between the averaged T2 value for total muscles and the HFMSE (P < 0.01).
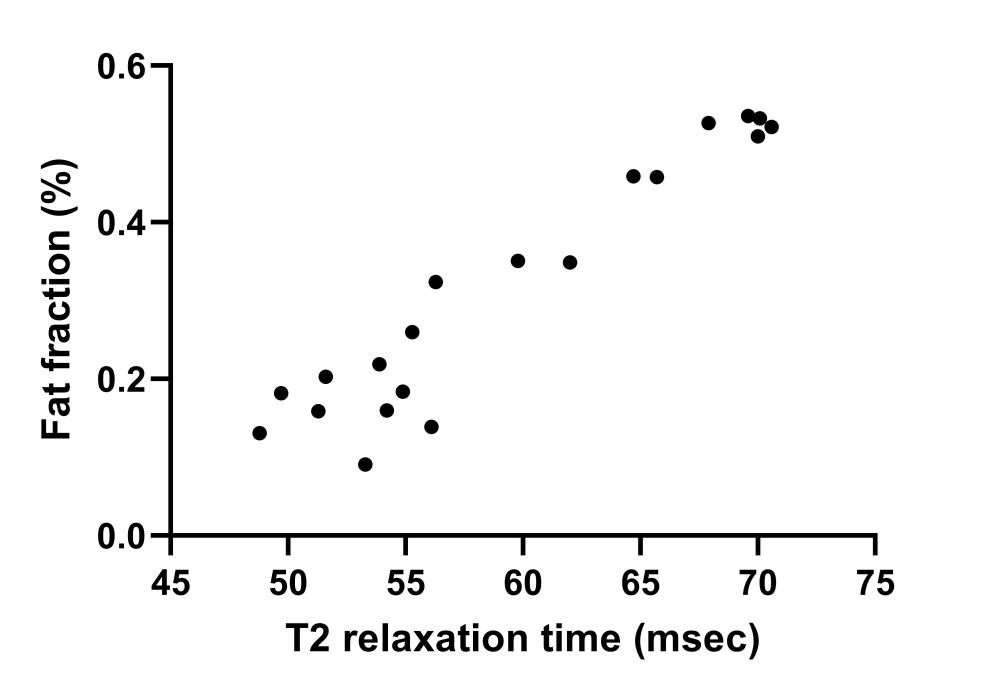
Fig. 4 Graph shows correlation between T2 and MFF in 20 patients. A significant positive correlation was observed between the averaged T2 value for total muscles and the averaged MFF (P < 0.001).