2231
R2* Estimation by Multispectral Fat-Water Models for GRE and UTE Acquisitions Using Virtual Liver Iron Overload Model and Monte Carlo Simulations
Prasiddhi Neupane1, Utsav Shrestha1, and Aaryani Tipirneni-Sajja1,2
1Biomedical Engineering, The University of Memphis, Memphis, TN, United States, 2St. Jude Children's Research Hospital, Memphis, TN, United States
1Biomedical Engineering, The University of Memphis, Memphis, TN, United States, 2St. Jude Children's Research Hospital, Memphis, TN, United States
Synopsis
Keywords: Data Analysis, Data Analysis
Multispectral fat-water-R2* models are used for the confounder-free assessment of hepatic iron overload. In this study, Monte Carlo-based virtual liver iron overload models were created, MRI signals were synthesized for GRE and UTE acquisitions, and the R2* values estimated using the monoexponential and the multispectral fat-water models were analyzed. Our results demonstrate that both multispectral models exhibit high accuracy and precision for UTE acquisition at both 1.5T and 3T.Introduction
Multispectral fat-water techniques based on non-linear square (NLSQ) fitting and autoregressive moving average (ARMA) modeling have been proposed for the simultaneous quantification of R2* and fat fraction (FF) by accounting for the confounding effects of both iron and fat on MRI signals1,2. The NLSQ model assumes a single R2* for both fat and water peaks to avoid model complexity, whereas the ARMA model estimates independent R2* for fat and water peaks1,3,4. Although these models performed well for mild and moderate iron overload conditions, they seem to produce inaccurate R2* values at high iron overload due to rapid signal decay before the shortest possible TE of ~1ms for multi-echo gradient echo (GRE) acquisition4. Multi-echo ultrashort echo time (UTE) imaging with TEmin~0.1 ms has been shown to improve the accuracy and precision of R2* estimation over a wider clinical range of hepatic iron concentration (HIC) than conventional GRE acquisitions5,6,7. However, multispectral models have not been thoroughly investigated for estimating R2* using UTE for the full clinically relevant range of HICs. Therefore, the purpose of this study is to evaluate the performances of multispectral models for R2* estimation for GRE and UTE acquisitions using a virtual iron overload model and synthesizing MRI signal via Monte Carlo simulations, and also validating their accuracies against published in vivo R2*-HIC calibration8.Methods
Monte Carlo model developed by Ghugre et. al was reproduced in our study to construct virtual liver models with iron overload and synthesize MRI signals9,10,11. For HICs ranging from 1-40 mg Fe/g dry liver weight, iron spheres were placed inside an 80 µm*80 µm*80 µm liver volume based on previously reported gamma distribution functions for size, nearest neighbor distance and cellular anisotropy, and virtual iron overload models were created9,10,11. MRI signals were synthesized at both 1.5 T and 3 T using Monte Carlo simulations in Python by considering magnetic field inhomogeneities induced by iron deposits, water proton mobility, phase accrual of protons10,11. 5000 protons were randomly distributed in the liver volume to perform a random walk following unrestricted diffusion for 10 ms. MRI signals for GRE (TEmin = 1 ms) and UTE (TEmin = 0.1 ms) acquisitions were extracted with ΔTE = 0.5 ms and TEmax = 10 ms and R2* values were calculated using monoexponential with constant offset, ARMA, and NLSQ models in MATLAB3,4,8. NLSQ model was implemented from the ISMRM Fat-Water Toolbox and ARMA model was implemented as an iterative approach with a maximum of 7 peaks3,4. Each simulation was repeated three times and the mean R2* value was taken to reduce bias introduced by random variation. Accuracy of the fitting models was evaluated using linear regression analysis between estimated R2* and simulated HICs. R2* vs. HIC calibration published by Wood et al. was used as reference to evaluate the accuracy of our model predicted R2* vs. HIC relationship in comparable GRE acquisition8,10. Precision was evaluated using coefficient of variation (CoV, %) of R2* values across the three simulations plotted against HICs.Results and Discussion
Virtual liver models mimicking published human histological statistics were simulated for different iron concentrations ranging from 1-40 mg Fe/ g (Figure 1). Synthesized MRI signals decayed faster for higher HICs and at higher magnetic field strengths, as expected. R2* values estimated using our monoexponential model showed an excellent agreement and fell within 95% confidence interval of Wood et al. R2*-HIC calibration at 1.5T for GRE acquisition, demonstrating the accuracy of our Monte Carlo-based model (Figure 2, Table 1)8. The multispectral model predicted R2* values also showed an excellent correlation with HIC values and fell within Wood’s 95% confidence interval at lower HICs. At HICs > 20 mg Fe/g, NLSQ model deviated from the confidence bounds while ARMA was still within the bounds. At 3T, predicted R2* values by all three models for GRE acquisition did not increase linearly with HICs for HICs > 12.5 mg Fe/g. Precision of all three models was significantly lower for GRE than UTE acquisition, particularly at 3T (Figure 3). In contrast, all three models produced similar R2* results for UTE acquisition at 1.5T and 3T. Furthermore, for UTE, ARMA and monoexponential models exhibited similar trends of high precision, which was comparatively higher than the NLSQ model. In conclusion, UTE acquisition produced more reliable R2* results at both field strengths across the full HIC range, agreeing with earlier studies that were done using the monoexponential model6,7,12. Both NLSQ and ARMA signal models produced accurate and precise R2* results at both 1.5 T and 3 T in UTE acquisitions, with ARMA model exhibiting similar R2* vs HIC relationships as the monoexponential model.Conclusion
Our findings show that both multispectral models displayed excellent precision and accuracy in R2* quantification for UTE acquisition across the full clinical spectrum of HIC at both 1.5T and 3T, with ARMA model behaving similar to the monoexponential model. Future work involves simulating liver models in coexisting conditions of iron overload and steatosis and evaluating the performances of ARMA and NLSQ multispectral models for accurate and simultaneous quantification of R2* and FF.Acknowledgements
Supported by grant #1R21EB031298 from the National Institute of Health.References
- Hernando, D., Liang, Z. P., & Kellman, P. (2010). Chemical shift-based water/fat separation: a comparison of signal models. Magnetic resonance in medicine, 64(3), 811–822.
- Taylor, B. A., Loeffler, R. B., Song, R., McCarville, M. B., Hankins, J. S., & Hillenbrand, C. M. (2012). Simultaneous field and R2 mapping to quantify liver iron content using autoregressive moving average modeling. Journal of magnetic resonance imaging: JMRI, 35(5), 1125–1132.
- Hernando, D., Kellman, P., Haldar, J. P., & Liang, Z. P. (2010). Robust water/fat separation in the presence of large field inhomogeneities using a graph cut algorithm. Magnetic resonance in medicine, 63(1), 79–90.
- Tipirneni-Sajja, A., Krafft, A. J., Loeffler, R. B., Song, R., Bahrami, A., Hankins, J. S., & Hillenbrand, C. M. (2019). Autoregressive moving average modeling for hepatic iron quantification in the presence of fat. Journal of magnetic resonance imaging: JMRI, 50(5), 1620–1632.
- Hernando, D., Levin, Y. S., Sirlin, C. B., & Reeder, S. B. (2014). Quantification of liver iron with MRI: state of the art and remaining challenges. Journal of magnetic resonance imaging: JMRI, 40(5), 1003–1021.
- Krafft, A. J., Loeffler, R. B., Song, R., Tipirneni-Sajja, A., McCarville, M. B., Robson, M. D., Hankins, J. S., & Hillenbrand, C. M. (2017). Quantitative ultrashort echo time imaging for assessment of massive iron overload at 1.5 and 3 Tesla. Magnetic resonance in medicine, 78(5), 1839–1851.
- Tipirneni-Sajja, A., Loeffler, R. B., Krafft, A. J., Sajewski, A. N., Ogg, R. J., Hankins, J. S., & Hillenbrand, C. M. (2019). Ultrashort echo time imaging for quantification of hepatic iron overload: Comparison of acquisition and fitting methods via simulations, phantoms, and in vivo data. Journal of magnetic resonance imaging: JMRI, 49(5), 1475–1488.
- Wood, J. C., Enriquez, C., Ghugre, N., Tyzka, J. M., Carson, S., Nelson, M. D., & Coates, T. D. (2005). MRI R2 and R2* mapping accurately estimates hepatic iron concentration in transfusion-dependent thalassemia and sickle cell disease patients. Blood, 106(4), 1460–1465.
- Ghugre, N. R., Gonzalez-Gomez, I., Shimada, H., Coates, T. D., & Wood, J. C. (2010). Quantitative analysis and modelling of hepatic iron stores using stereology and spatial statistics. Journal of microscopy, 238(3), 265–274.
- Ghugre, N. R., & Wood, J. C. (2011). Relaxivity-iron calibration in hepatic iron overload: probing underlying biophysical mechanisms using a Monte Carlo model. Magnetic resonance in medicine, 65(3), 837–847.
- Ghugre, N. R., Doyle, E. K., Storey, P., & Wood, J. C. (2015). Relaxivity-iron calibration in hepatic iron overload: Predictions of a Monte Carlo model. Magnetic resonance in medicine, 74(3), 879–883.
- Doyle, E. K., Toy, K., Valdez, B., Chia, J. M., Coates, T., & Wood, J. C. (2018). Ultra-short echo time images quantify high liver iron. Magnetic resonance in medicine, 79(3), 1579–1585.
Figures
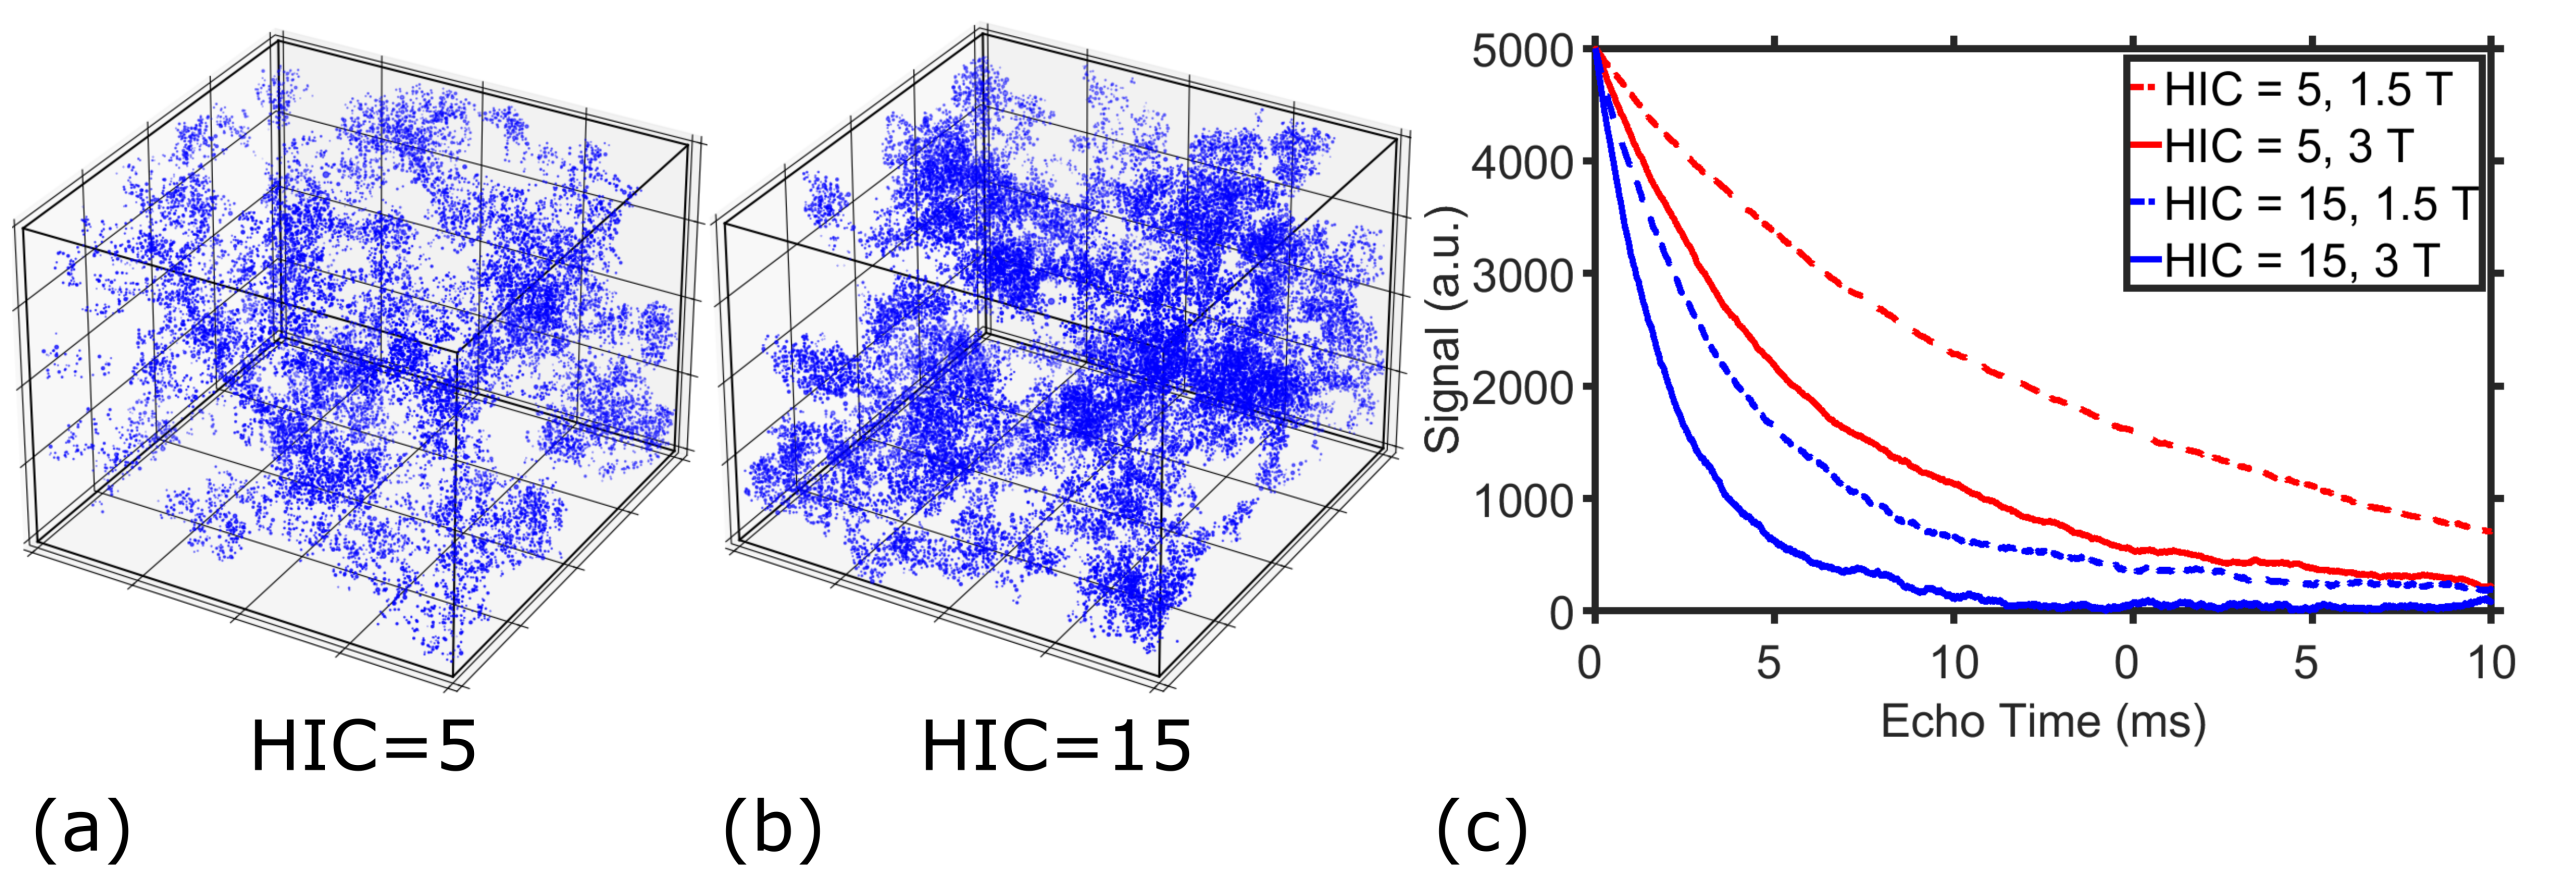
Figure 1. 80 µm *80 µm * 80 µm 3D virtual liver iron overload
models for representative HICs of 5 mg Fe/g (a), 15 mg Fe/g (b), and the corresponding
MRI signals at 1.5 T and 3 T for a time interval of 10 ms (c). MRI signals
decayed faster for higher HICs and at higher magnetic field strengths.
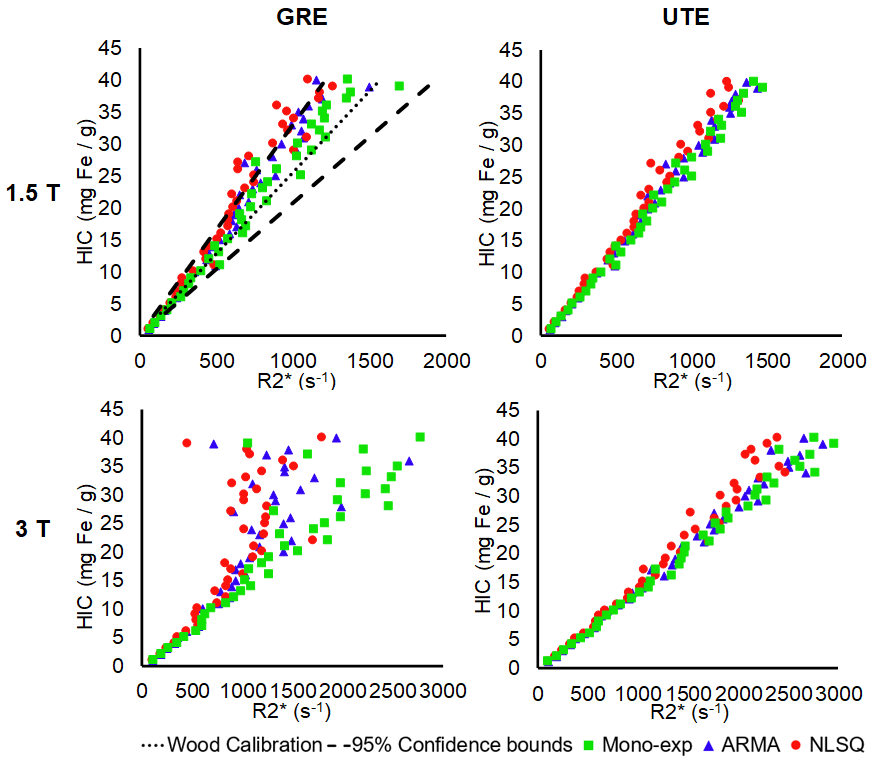
Figure 2. Scatter plot demonstrating R2*-HIC
relationship obtained using monoexponential, ARMA, and NLSQ signal models for
GRE and UTE acquisitions at 1.5 T and 3 T. High accuracy was shown by all three
signal models for UTE acquisition throughout the full HIC range at both field strengths,
with ARMA and monoexponential models exhibiting very similar regression patterns.
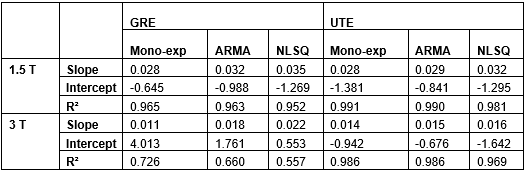
Table 1. Slopes, y-intercepts, and R-squared values of
the regression equations obtained from regression analysis in Figure 2.
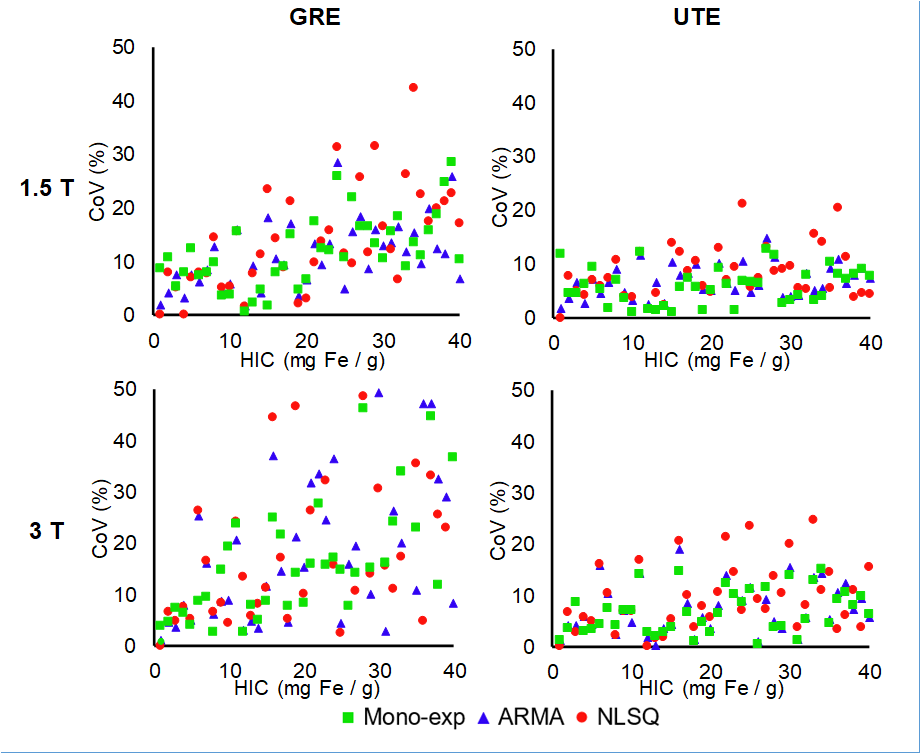
Figure 3. Coefficient of variation (CoV,
%) of mean R2* values obtained using monoexponential, ARMA, and NLSQ signal
models plotted against simulated HIC values for GRE and UTE acquisitions at 1.5
T and 3T. Excellent precision was shown by all three signal models for UTE
acquisition throughout the full HIC range at both field strengths, with ARMA
and monoexponential models exhibiting overall lower CoV compared to NLSQ.
DOI: https://doi.org/10.58530/2023/2231