2226
Cardiac-Gated Rosette Pulse Sequence Development for Off-Resonance Frequency Imaging1University of Chicago, Chicago, IL, United States, 2Department of Radiology, Northwestern Feinberg School of Medicine, Chicago, IL, United States
Synopsis
Keywords: Pulse Sequence Design, Phantoms
Intracranial atherosclerotic disease (ICAD) is a leading cause of preventable ischemic stroke. Long-term management of chronic ICAD would benefit from directly quantifying key risk factors, such as the oxygen extraction fraction (OEF) and cerebrovascular reserve (CVR). The accurate measurement of the phase signal is vital to measuring OEF using MRI and seeing these effects through the cardiac cycle promises to elucidate CVR. A cardiac-gated, multi-shot, multi-echo rosette pulse sequence is developed and validated with simulation and a phantom study. The proposed pulse sequence and reconstruction pipeline produces strong off-resonance frequency measurements with a scan time under two minutes.Introduction
Intracranial atherosclerotic disease (ICAD) is a leading cause of preventable ischemic stroke that would benefit from directly quantifying key risk factors, such as the oxygen extraction fraction (OEF) and cerebrovascular reserve (CVR)[1]. Previous studies demonstrated the link between OEF and the off-resonance frequency shift in the MR signal[2]. CVR may be modeled as a 2-element Windkessel model, following an exponential decay that is related to changes in OEF from systole to diastole during the cardiac-cycle[1]. The accurate measurement of susceptibility-induced off-resonance frequency shifts in the MR signal is critical to estimating OEF, and the ability to measure these effects temporally throughout the cardiac-cycle may elucidate CVR and provide a novel method to remove static background field. Existing methods are not optimized for cardiac-gating and require prescriptive conditions to work. Moreover, clinical translation requires a fast pulse sequence. Therefore, a cardiac-gated, multi-shot, multi-echo rosette pulse sequence is developed and validated using a phantom study. This sets the stage for clinical application to determine the viability of OEF and CVR as biomarkers for stroke risk in ICAD populations.Materials and Methods
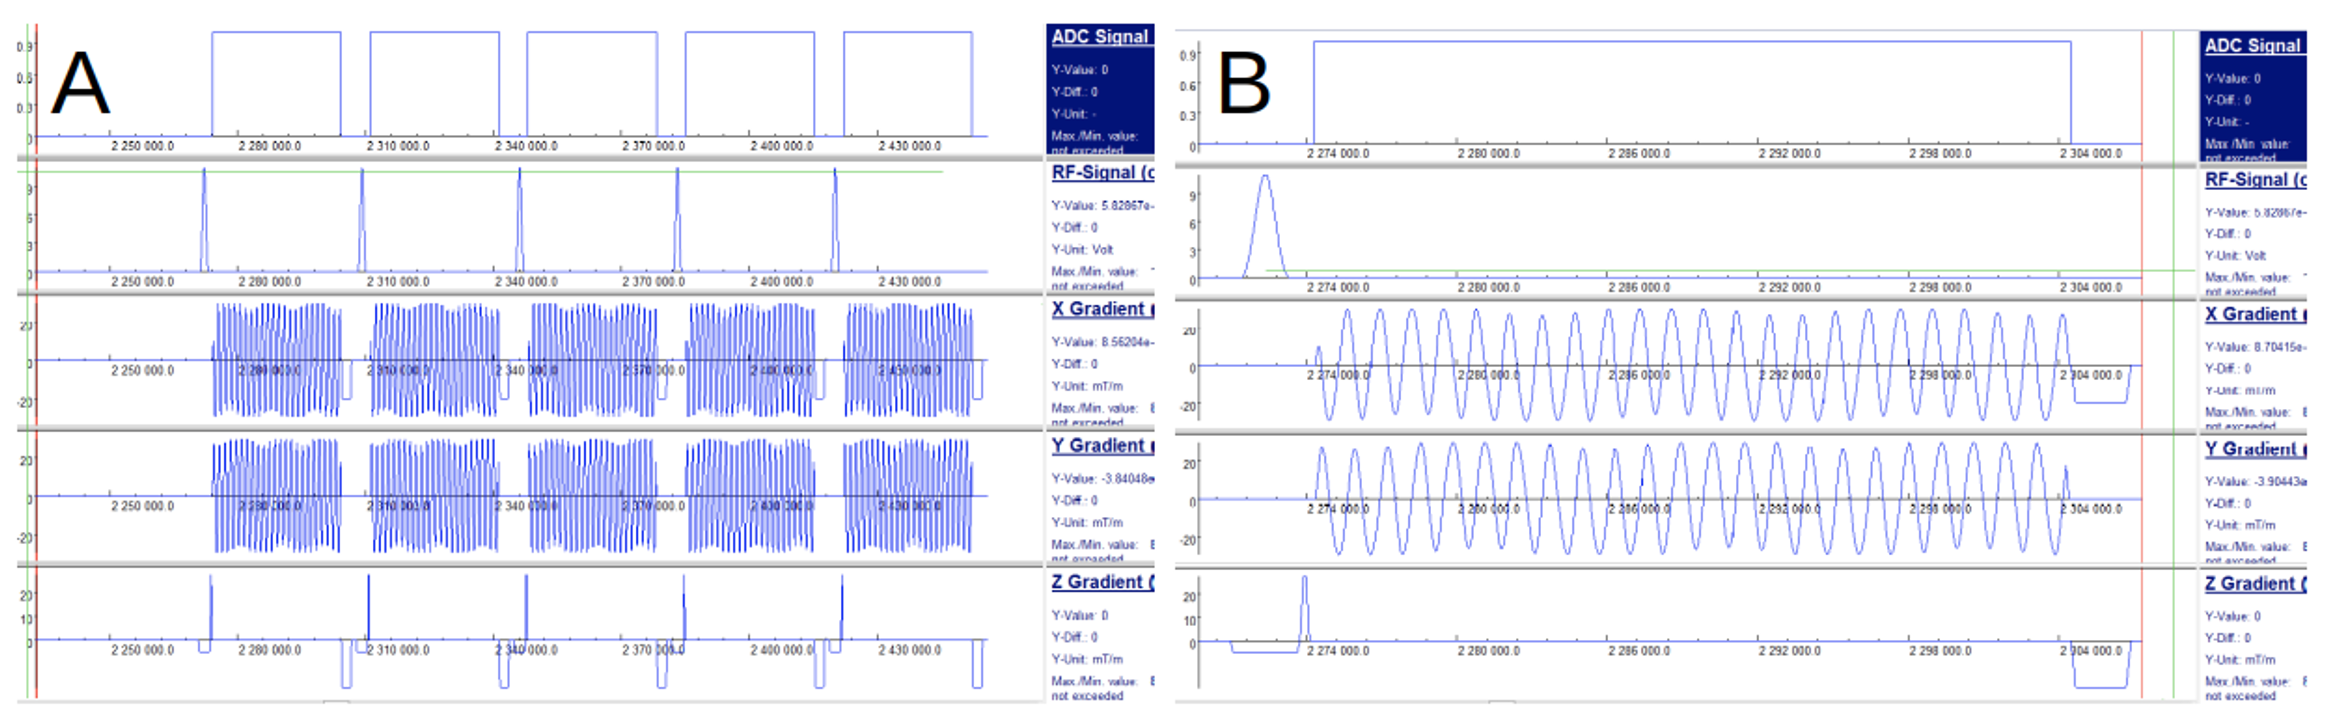
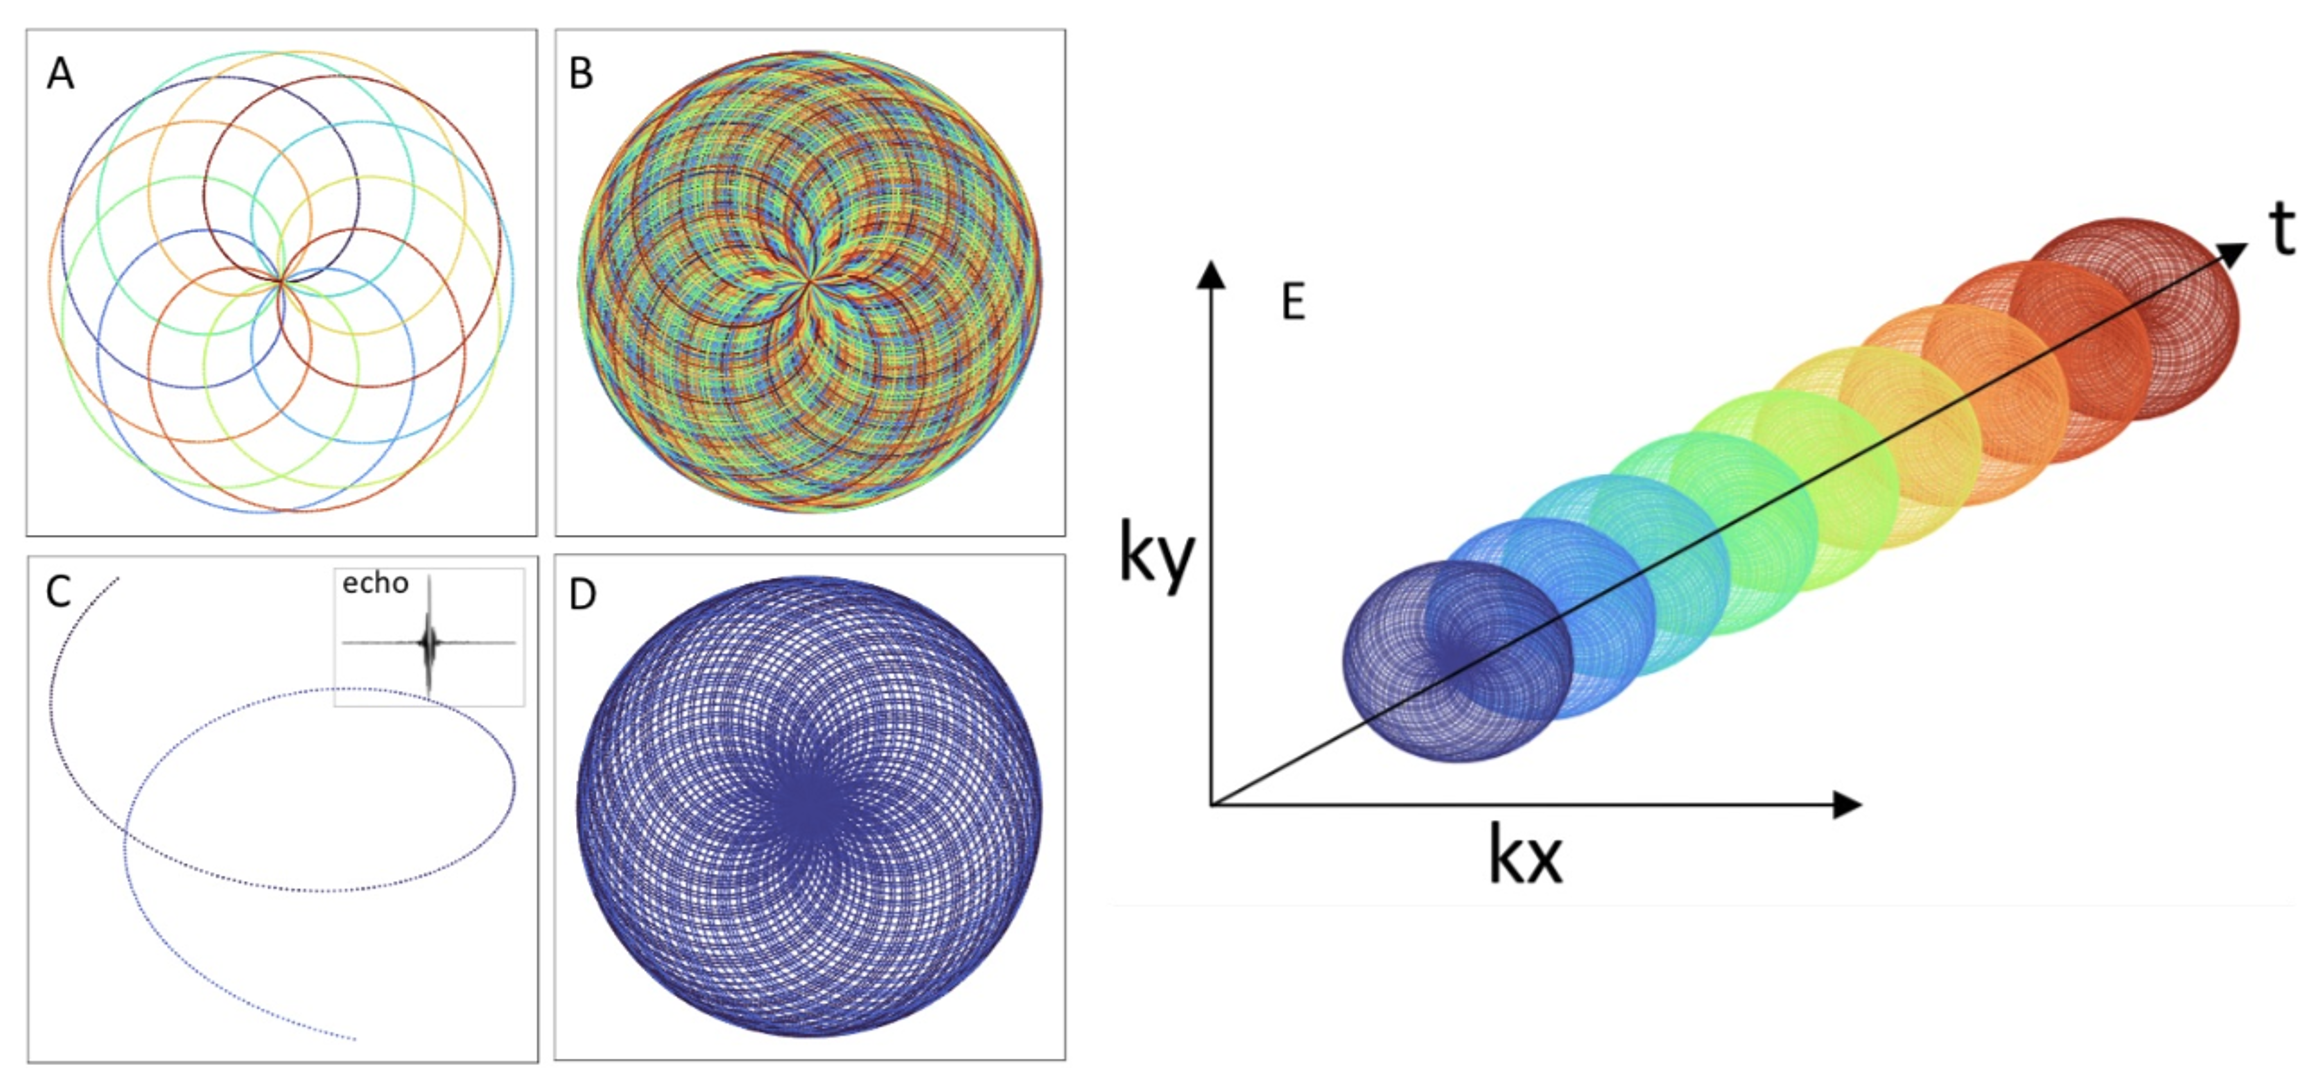
Pulse sequence development: A cardiac-gated, multi-shot, multi-echo pulse sequence was developed that uses rosette trajectories. The choice for using rosette trajectories comes from its high sensitivity to small spatial-frequencies and smooth gradient waveforms that reduce unwanted eddy current effects[3]. This is precisely the range of frequencies expected based on blood-related susceptibility effects[2]. Moreover, rosettes have a unique spectral response that selectively maintains coherence of small off-resonant frequencies, thereby removing irrelevant higher frequency signals. The multi-shot design allows for a denser sampling of k-space and multiple echoes are used to fit the phase signal to obtain frequency estimates[4]. In this study the rosette trajectory was designed with 20 petals, which produces up to 20 echoes, and a total of 50 shots (rotated by the golden angle) were captured for each cardiac phase (Figs 1-2).Image Reconstruction: An image reconstruction pipeline was developed using the BART reconstruction library. Specifically, a locally low-rank regularization was applied to a parallel imaging, compressed-sensing reconstruction model. This type of regularization takes advantage of spatio-temporal similarity in the multi-echo data to remove noise and under-sampling artifacts. The phase at each echo is found by taking the angle of the complex pixel values and applying 2D phase unwrapping. Finally, the off-resonance frequency is estimated by applying a linear fit to the phase values at each echo. All post-processing was done in Python.
Simulation: The proposed pulse sequence generates a signal that follows the well-known spoiled steady-state free precession model. Various potential signals were simulated with off-resonance frequencies ranging from 5 to 150 Hz. Analytic multi-coil k-space data was generated using the BART tubes phantom simulation tool. Gaussian white noise was added to the simulated k-space data at various dB levels ranging from -20 to 20 dB to stress test the sequence and reconstruction’s tolerance to noise.
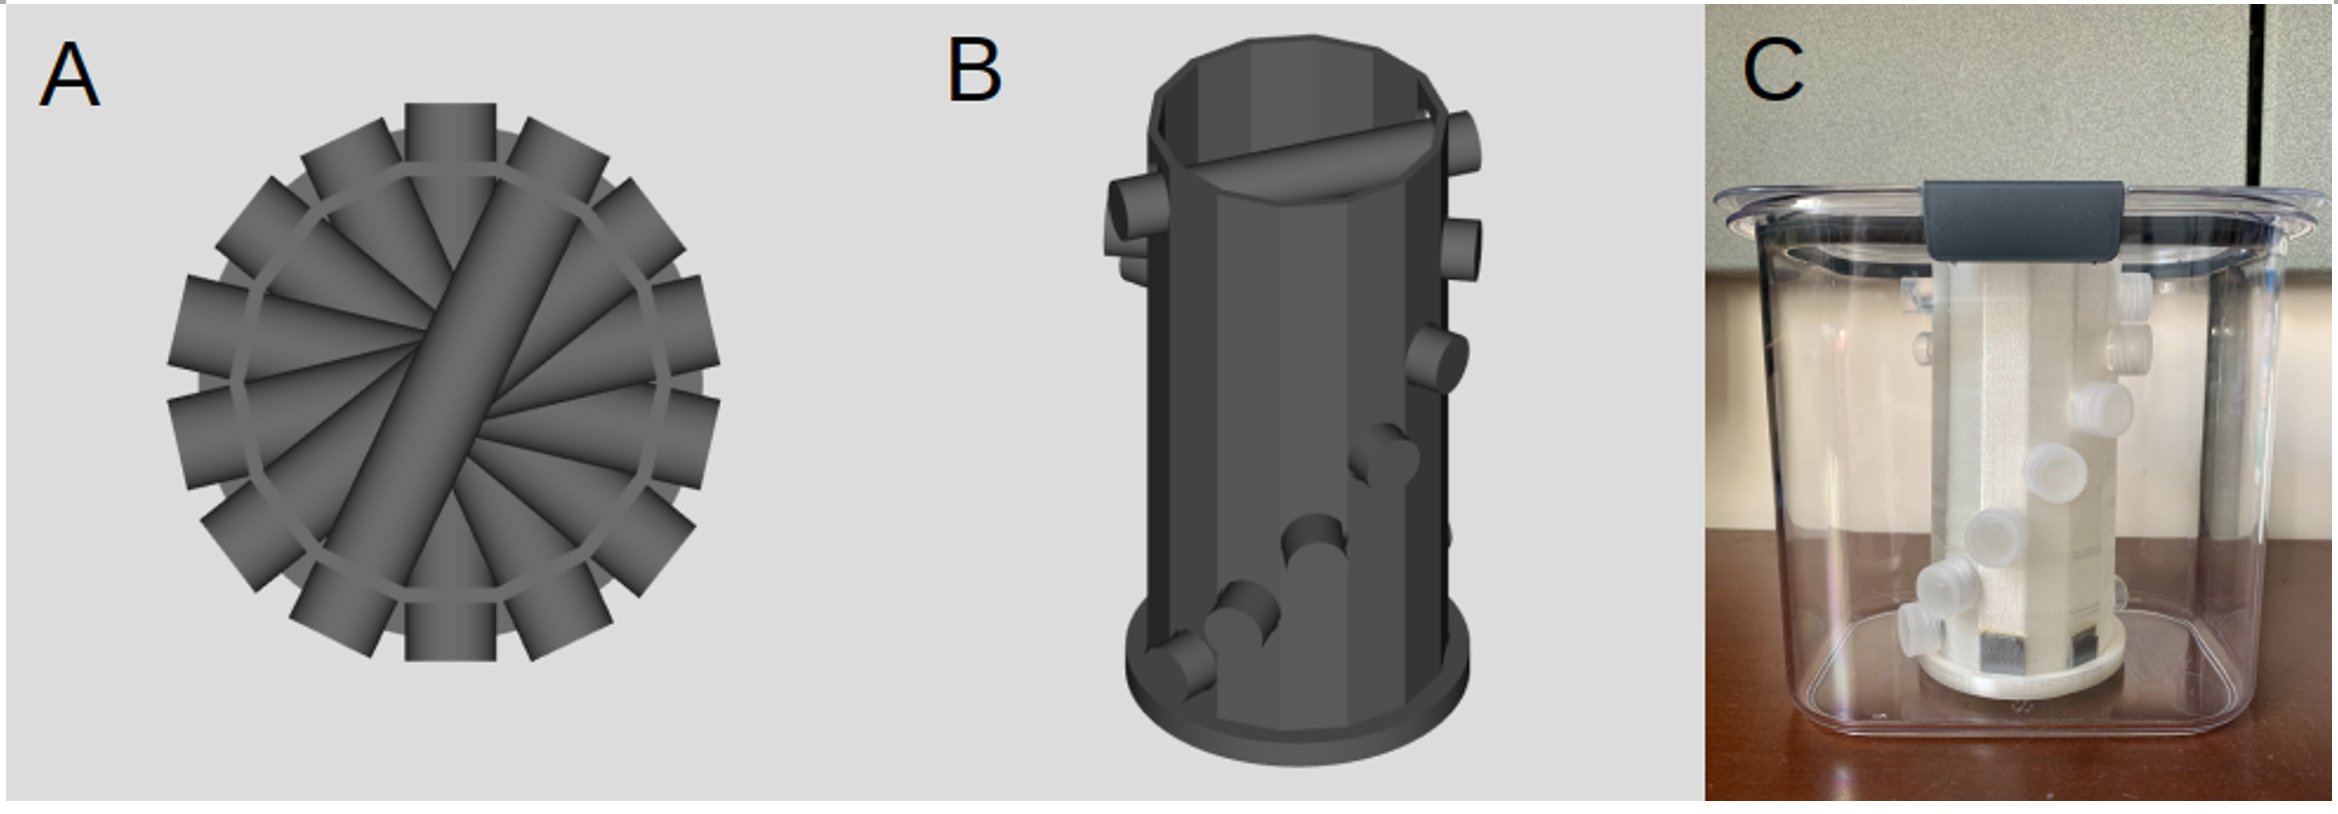
Phantom Development: A custom phantom was designed and 3D-printed to provide off-resonance frequency shifts that could be theoretically derived (Fig 3). The design leverages the simple analytical expression for a long cylinder inside a uniform magnetic field offset by some angle from the direction of the background field. The phantom contains seven vials that are each filled with a 1.0 mM GdCl3 solution to mimic deoxygenated blood. Different susceptibility effects are achieved by arranging the tubes at different angles from the main magnetic field.
Image Acquisition: The pulse sequence was implemented on a Siemens PRISMA system. Seven images were captured using the proposed pulse sequence, where before each image acquisition, the phantom was manually rotated about its base. Therefore, each tube was imaged at seven different angles. This technique captures the angular dependence of the local susceptibility effects, which can be exploited to disambiguate background field effects from the signal that only vary spatially. The imaging parameters used were TR = 25ms, TE = 1.0ms, flip angle = 15 deg., spatial resolution = 1 mm x 1mm x 5 mm. The total scan time was less than two minutes.
Results
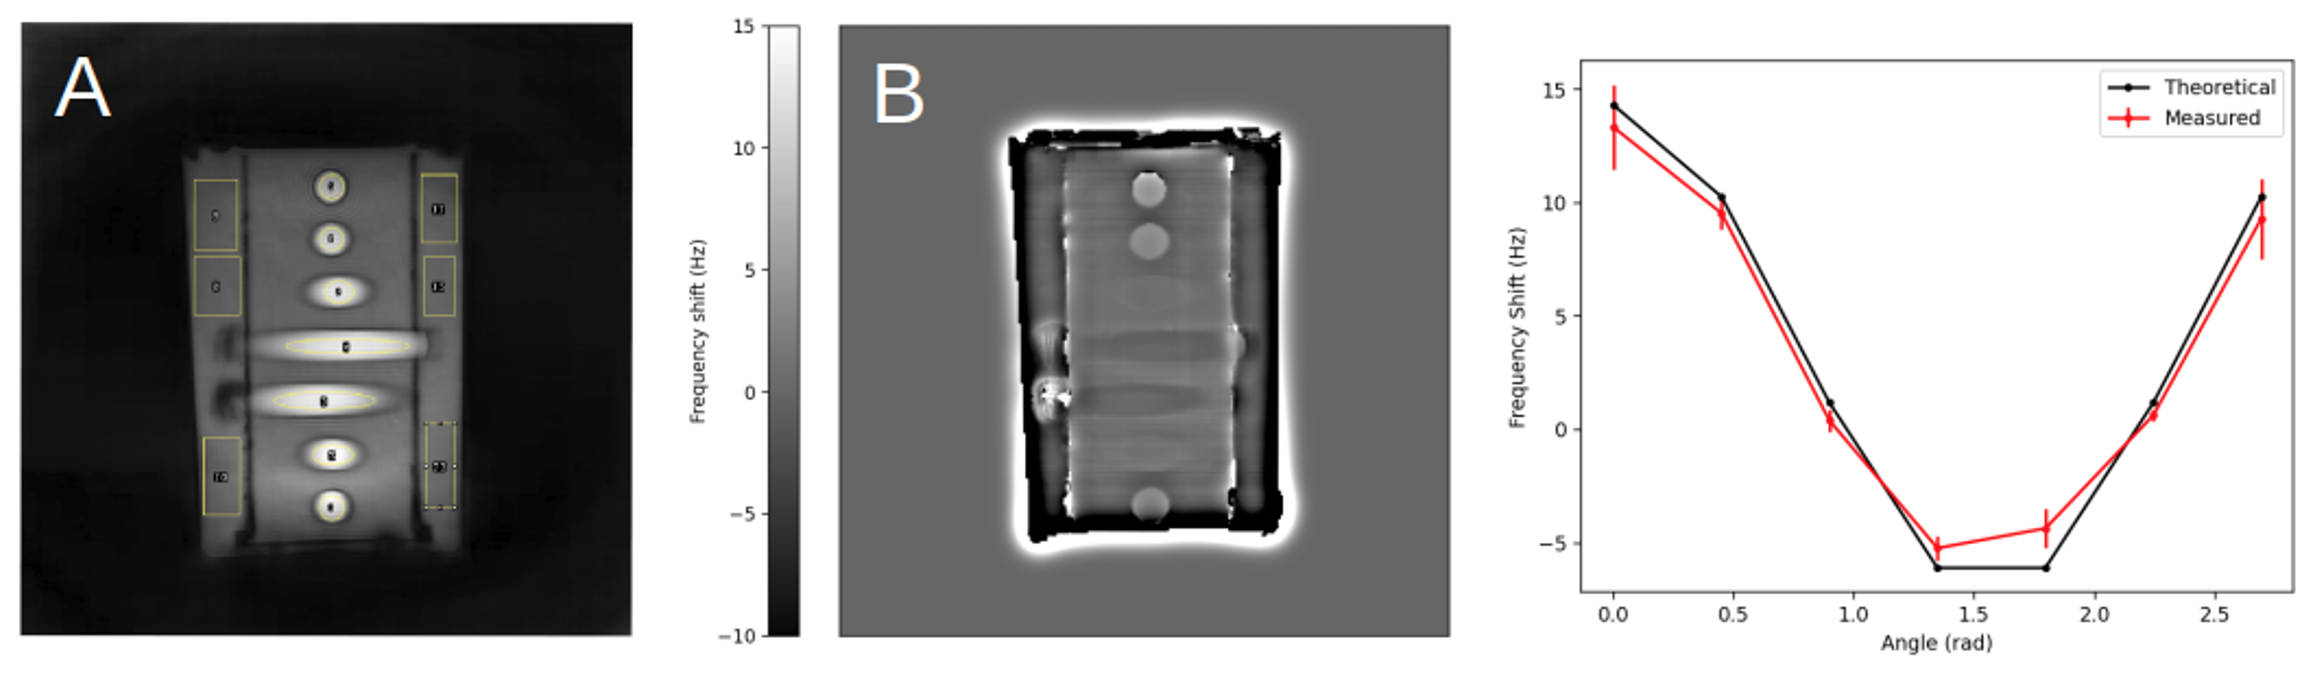
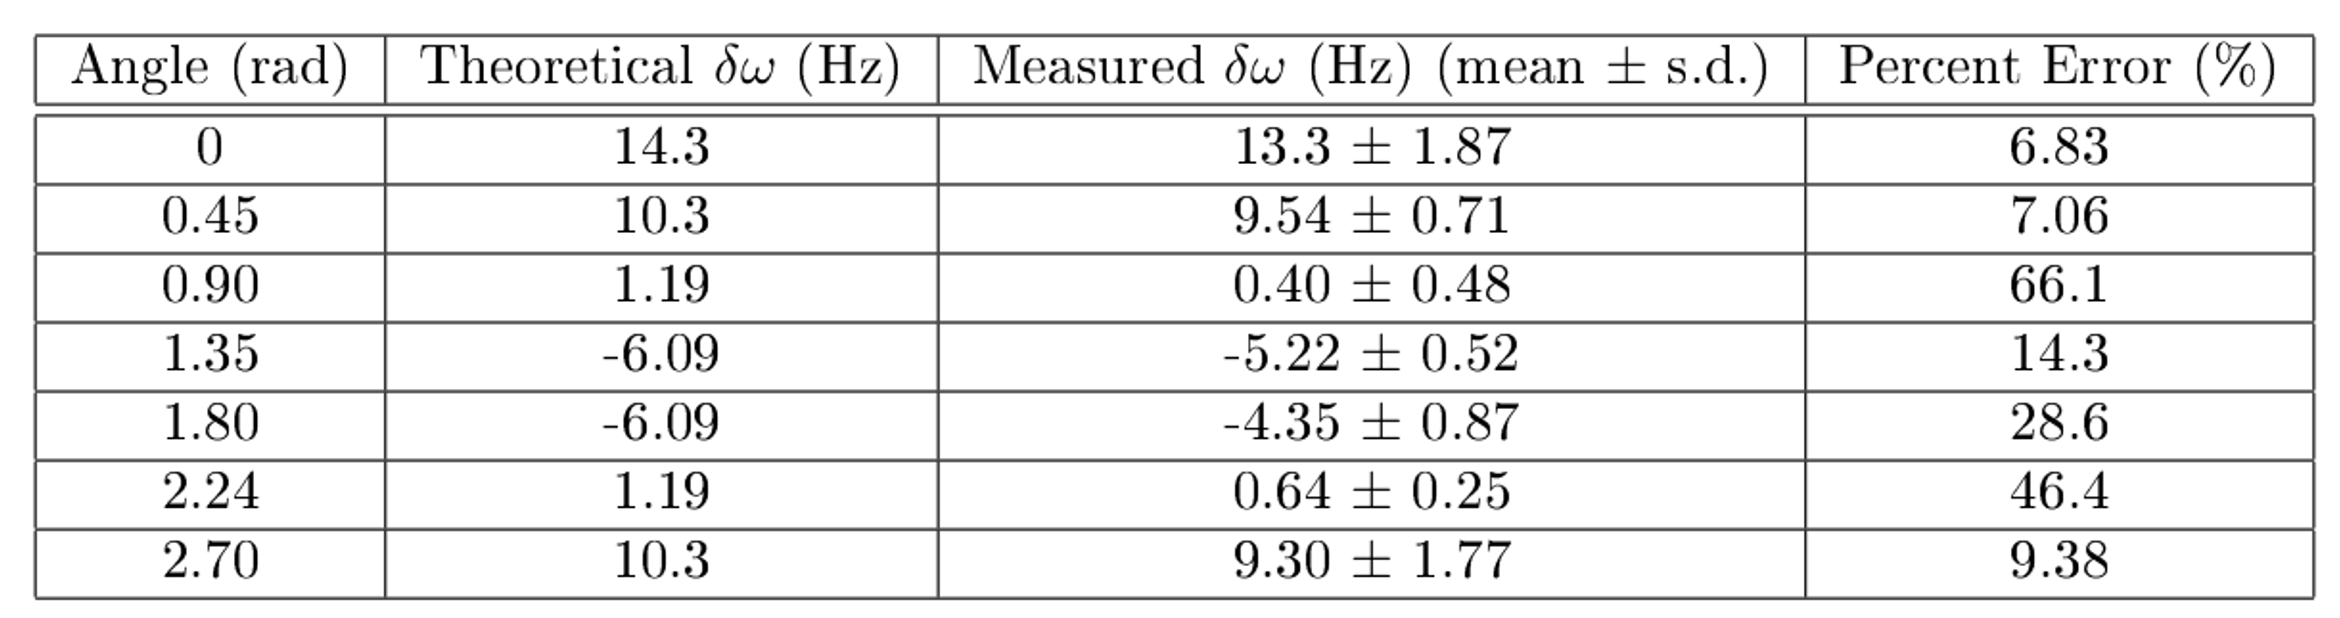
Simulations: Simulations of the proposed pulse sequence demonstrate that, in the absence of other background effects, accurate phase measurements can be made even at high noise levels. The percent error of frequency estimates was below 4% across all frequencies even at the highest level of noise.Phantom Study: ROIs were drawn around the post-processed phantom image to obtain an average off-resonance frequency estimate for each tube (Fig 4). The average frequency estimates at each tube were compared to theoretical values using a percent error metric. This analysis shows that tubes with frequency values of 10Hz or larger have a percent error of less than 10% (Fig 5).
Discussion and Conclusion
MRI is a promising non-invasive modality to measure OEF and CVR, which may be used as biomarkers for assessing stroke risk in ICAD populations with accurate measurement of the phase signal across the cardiac-cycle. A pulse sequence was developed and validated using simulations and a phantom study. The phantom study returned promising results, suggesting the pulse sequence and reconstruction pipeline can measure off-resonance frequencies of as low as 10Hz with under 10% error.Acknowledgements
Research reported in this publication is supported by the NIH award number R01NS093901-01A1, NSF Fellowship NSF DGE-1746045, and NIH Training Grant 5R25GM109439-09.
References
1. Buxton, R. B., and L. R. Frank. “A Model for the Coupling between Cerebral Blood Flow and Oxygen Metabolism during Neural Stimulation.” J Cereb Blood Flow Metab, 1997/01/01 ed., vol. 17, no. 1, Jan. 1997, pp. 64–72, https://doi.org/10.1097/00004647-199701000-00009. 8978388.
2. Yablonskiy, Dmitriy A., and E. Mark Haacke. “Theory of NMR Signal Behavior in Magnetically Inhomogeneous Tissues: The Static Dephasing Regime.” Magnetic Resonance in Medicine, vol. 32, no. 6, Dec. 1994, pp. 749–63. DOI.org (Crossref), https://doi.org/10.1002/mrm.1910320610.
3. Noll, D. C. “Multishot Rosette Trajectories for Spectrally Selective MR Imaging.” IEEE Transactions on Medical Imaging, vol. 16, no. 4, Aug. 1997, pp. 372–77. DOI.org (Crossref), https://doi.org/10.1109/42.611345.
4. Bush, Adam M., et al. “Rosette Trajectories Enable Ungated, Motion‐Robust, Simultaneous Cardiac and Liver T 2 * Iron Assessment.” Journal of Magnetic Resonance Imaging, vol. 52, no. 6, Dec. 2020, pp. 1688–98. DOI.org (Crossref), https://doi.org/10.1002/jmri.27196.
Figures