2219
Characterizing Artifacts in Multi-dimensional MR Fingerprinting with High Efficiency for Sequence Optimization: Systematic Error Index1Case Western Reserve University, Cleveland, OH, United States
Synopsis
Keywords: Pulse Sequence Design, MR Fingerprinting
It is critical to characterize the dominating systematic errors caused by undersampling and field inhomogeneity to design robust MRF scans. However, characterizing such errors by direct simulations of aliasing artifacts is computationally expensive and impractical for sequence optimization for multi-dimensional MRF (mdMRF) scans with higher dimensions. We propose the Systematic Error Index, a model to characterize systematic errors with high computational efficiency. We demonstrate accurate and robust in vivo results from the optimized MRF and mdMRF scans obtained from the proposed SEI-based optimization framework.Introduction
It is critical to characterize the dominating errors in highly-undersampled MRF signals to design robust MRF scans against systematic errors due to undersampling and background phase. Our previous study has used simulations to estimate and minimize such spatially and temporally dependent artifacts to optimize MRF sequence design1,2. However, such a framework requires the simulation of a full dictionary and pattern matching to evaluate quantification errors from every candidate sequence during optimization. It is thus challenging to extend this framework to design higher-dimensional MRF scans. For example, multi-dimensional MRF (mdMRF) scans enable simultaneous quantification of T1, T2, and ADC. The extra dimension increases the dictionary size exponentially, making optimization computationally expensive and impractical.Here, we propose the Systematic Error Index (SEI), a fast error characterization model that 1) accounts for the undersampling artifacts and field inhomogeneity, and 2) could be handled by currently available computational power for sequence optimization of mdMRF. We demonstrate accurate and robust in vivo results from the optimized MRF and mdMRF scans obtained from the SEI-based optimization framework.
Methods
Systematic Error Index (SEI)The goal of optimizing the sequence design is to minimize quantification errors. Based on the pattern matching algorithm, it occurs when the normalized inner product between the acquired signal and its corresponding dictionary entry is maximized:\[\max\left|\left\langle\hat{s},\hat{d}(\mathbf{\theta})\right\rangle\right|\]where $$$\mathbf{\theta}\in\left\{{{T}_{1}},{{T}_{2}},ADC\right\}$$$. It is equivalent to minimizing its derivatives with respect to $$$\theta$$$. Lower derivatives indicate lower matching errors. SEI is given by summing the derivatives across all pixels $$$P$$$:\[SEI(\mathbf{\theta})=\frac{1}{P}\sum\limits_{p}^{P}{\left|\frac{\partial\left|{{f}_{p}}(\mathbf{\theta})\right|}{\partial\mathbf{\theta}}\right|}\]\[{{f}_{p}}(\mathbf{\theta})=\frac{\left\langle{{s}_{p}},{{d}_{p}}(\mathbf{\theta })\right\rangle}{\left\|{{s}_{p}}\right\|\left\|{{d}_{p}}(\mathbf{\theta})\right\|}\]The signals can be represented using the partially separable approach to efficiently simulate undersampling and field inhomogeneities2. Given a segmented brain phantom consisting of three representative tissue types, the dictionary entry at pixel $$$p$$$ is given by:\[{{d}_{p}}(\mathbf{\theta})=\sum\limits_{i}^{\text{Tissue}}{{{\mathbf{M}}_{i}}(p){{d}_{i}}(\mathbf{\theta})}\]where $$$i\in\left\{WM,GM,CSF\right\}$$$. $$${{\mathbf{M}}_{i}}(p)$$$ is the partial volume mask of tissue type $$$i$$$. The acquired signal is given by:\[{{s}_{p}}=\sum\limits_{i}^{\text{Tissue}}{{{\Psi}_{i}}(p){{d}_{i}}({{\mathbf{\theta}}_{0}})}\]\[{{\Psi}_{i}}(p)={{F}_{us}}^{-1}K{{F}_{full}}{{\mathbf{M}}_{i}}(p){{e}^{i\mathbf{\varphi}(p)}}\]Where $$${{F}_{us}}$$$ and $$${{F}_{full}}$$$ are undersampled and fully-sampled NUFFT operators, $$$K$$$ is the undersampling trajectory, and $$$\mathbf{\varphi}(p)$$$ is background phase due to B0 inhomogeneity.
The SEI value is arbitrary, making it difficult to evaluate and relate to the actual T1/T2/ADC errors without information about the curvature of inner products $$${{f}_{p}}({{\mathbf{\theta}}_{dict}})$$$. Therefore, we 1) approximated the local curvature of $$${{f}_{p}}({{\mathbf{\theta}}_{dict}})$$$ using the parabola model, and 2) linearly scaled the SEI with the parabola coefficients. A nearby point $$${{f}_{p}}(\mathbf{\theta}+\Delta\mathbf{\theta})$$$ on the curve was used to calculate the parabola coefficient $$${{k}_{p}}$$$ for each pixel. The scaled SEI (in percentage) was calculated as:\[\widehat{SEI}(\mathbf{\theta})=\frac{1}{P}\sum\limits_{p}^{P}{\frac{\left|{\frac{\partial\left|{{f}_{p}}(\mathbf{\theta})\right|}{\partial\mathbf{\theta}}}/{\frac{1}{P}\sum\limits_{p}^{P}{\left|{{k}_{p}}\right|}}\;\right|}{\mathbf{\theta}}}\]In SEI formulations, $$${{\Psi}_{i}}(p)$$$ and $$${{\mathbf{M}}_{i}}(p)$$$ are independent of sequence parameters and could be precomputed; the remaining components to be updated are signal evolutions and signal derivatives for a few tissue types.
Sequence Optimization
The cost function for sequence optimization problems was:\[\min\sum\limits_{\mathbf{\theta}\in\left\{{{T}_{1}},{{T}_{2}},ADC\right\}}{\widehat{SEI}(\mathbf{\theta})}\]MRF sequences of 480 flip angles and 480 TR variables were optimized. mdMRF sequences of 960 flip angle variables (fixed TR) and 10 preparation modules were optimized with signal models adapted as described in (3). To reduce dimensionality, the sequences were parameterized using cubic spline pulses1. All optimizations were initiated from random seeds and solved by simulated annealing method4.
Validation
The SEI values were compared with the quantitative T1/T2/ADC errors obtained from the direct simulation to demonstrate the SEI is a valid alternative. Direct simulations used a digital brain phantom to generate undersampled image series with background phase, and then obtained MRF maps via dictionary matching.
The optimized MRF and mdMRF sequences were validated by simulations and in vivo scans. All in vivo scans were performed on healthy volunteers using a Siemens 3T Vida scanner. MRF scans were acquired with matrix size 256x256, FOV 250x250mm, and processed using NUFFT reconstruction. mdMRF scans were acquired with matrix size 192x192, FOV 300x300, and reconstructed using the self-calibrated iterative low-rank method5,6.
Results
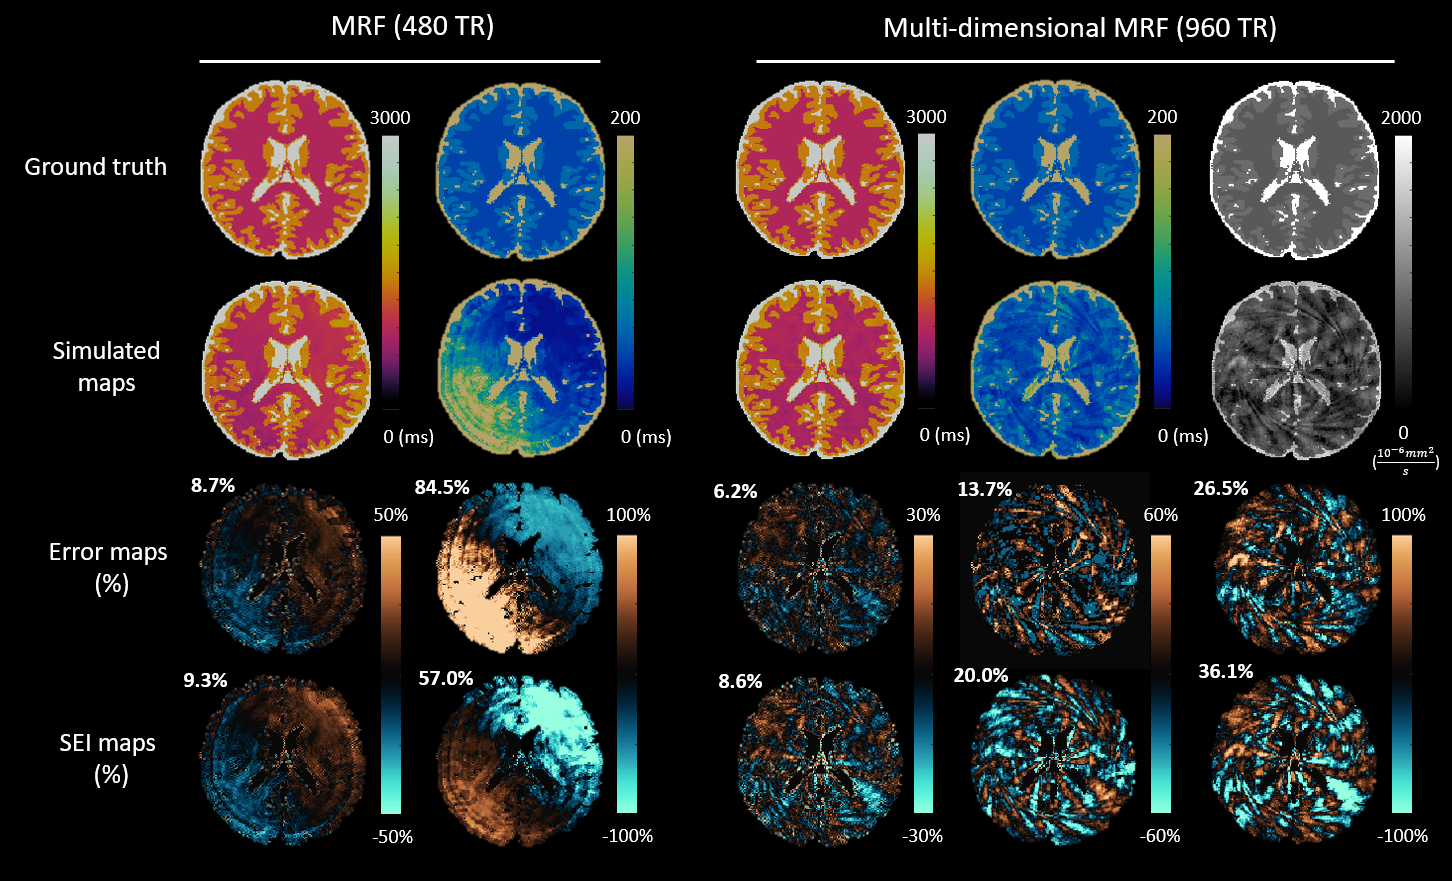
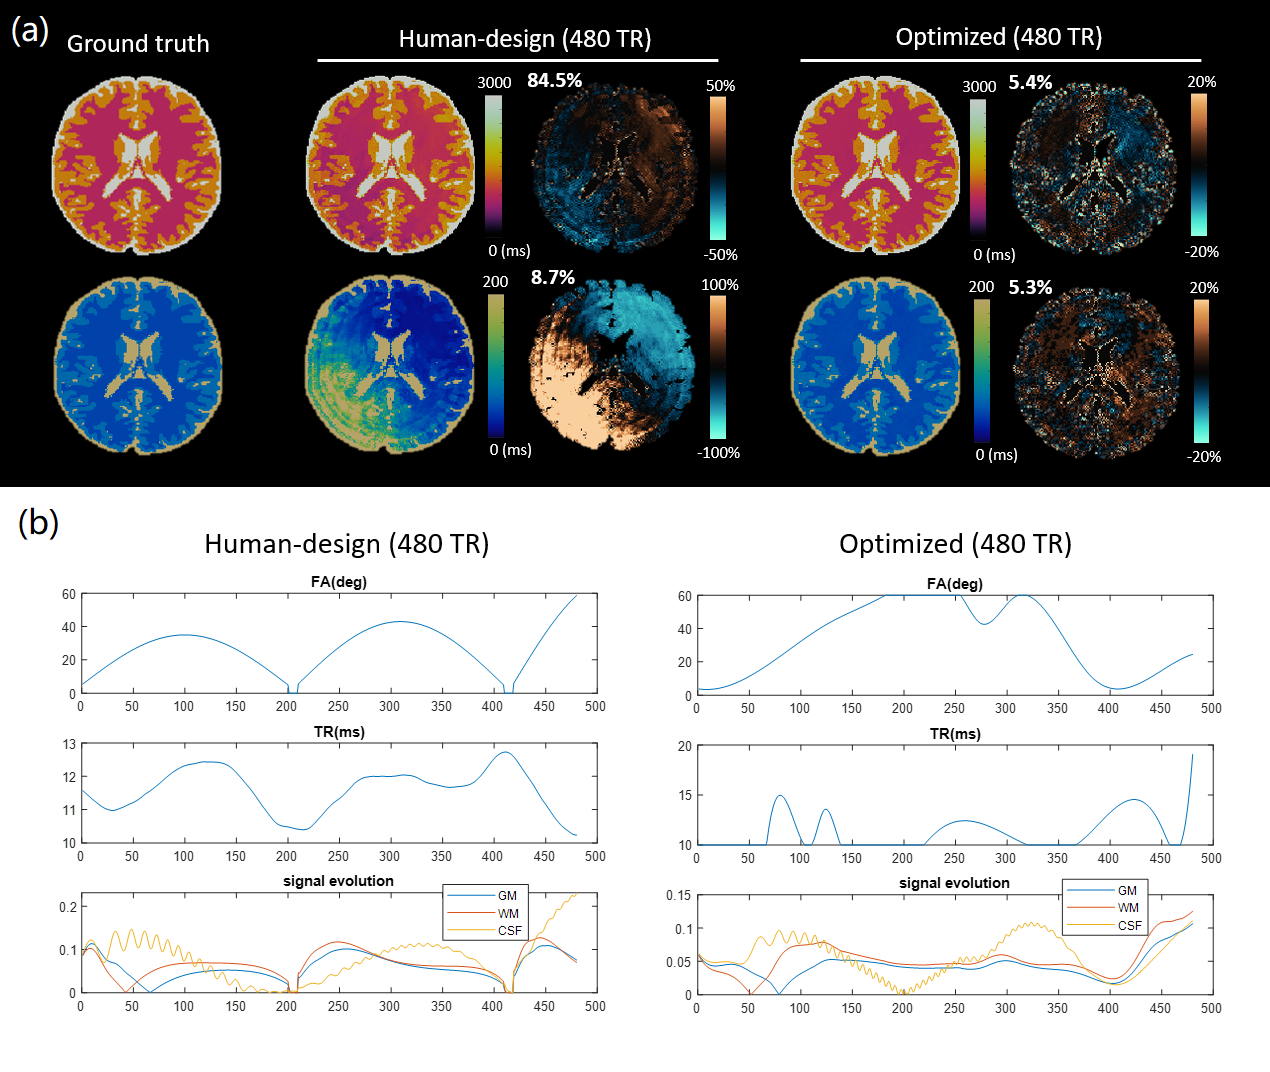
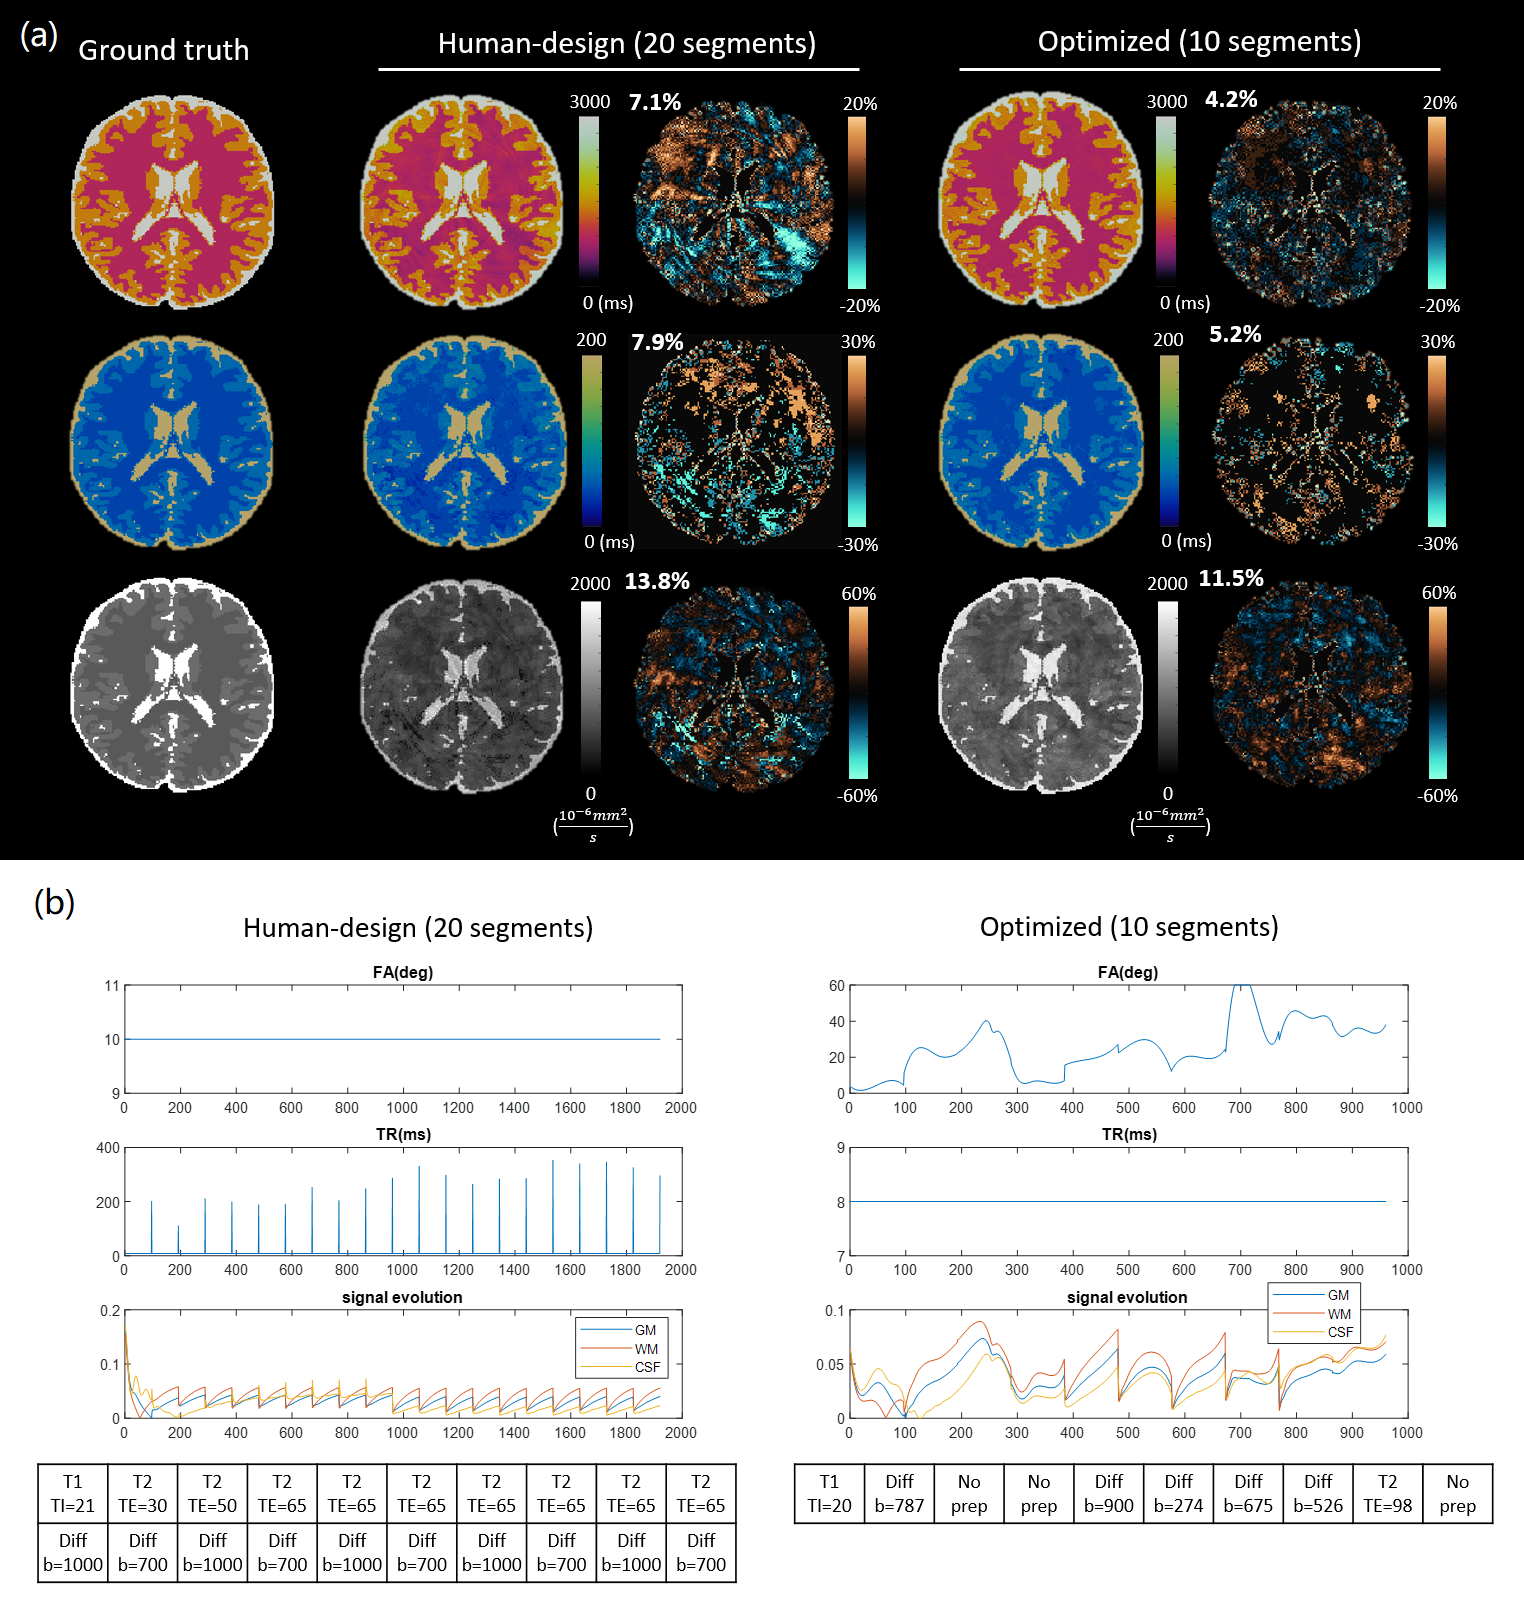
Simulating errors with dictionary generation and matching took 128 seconds for an MRF sequence and 1286 seconds for an mdMRF sequence; the proposed SEI took 1.47 seconds and 3.72 seconds as comparisons. The SEI maps reproduce the artifact patterns on the error maps from the simulations (Figure 1). The SEI values are also on the same scale with percentage errors.Figure 2 and 3 show the simulation results and sequence patterns of example optimized sequences of MRF and mdMRF as compared to the human design. The T2 map from the human-designed MRF sequence shows severe shading artifacts due to systematic errors; the optimized MRF scan is immune to shading. For mdMRF sequences, the human-designed sequence contains 20 segments (21.6 sec) for effective T2 and diffusion encoding. The optimized sequence only contains 10 segments (8.6 sec), but yields higher accuracy for all tissue property measurements.
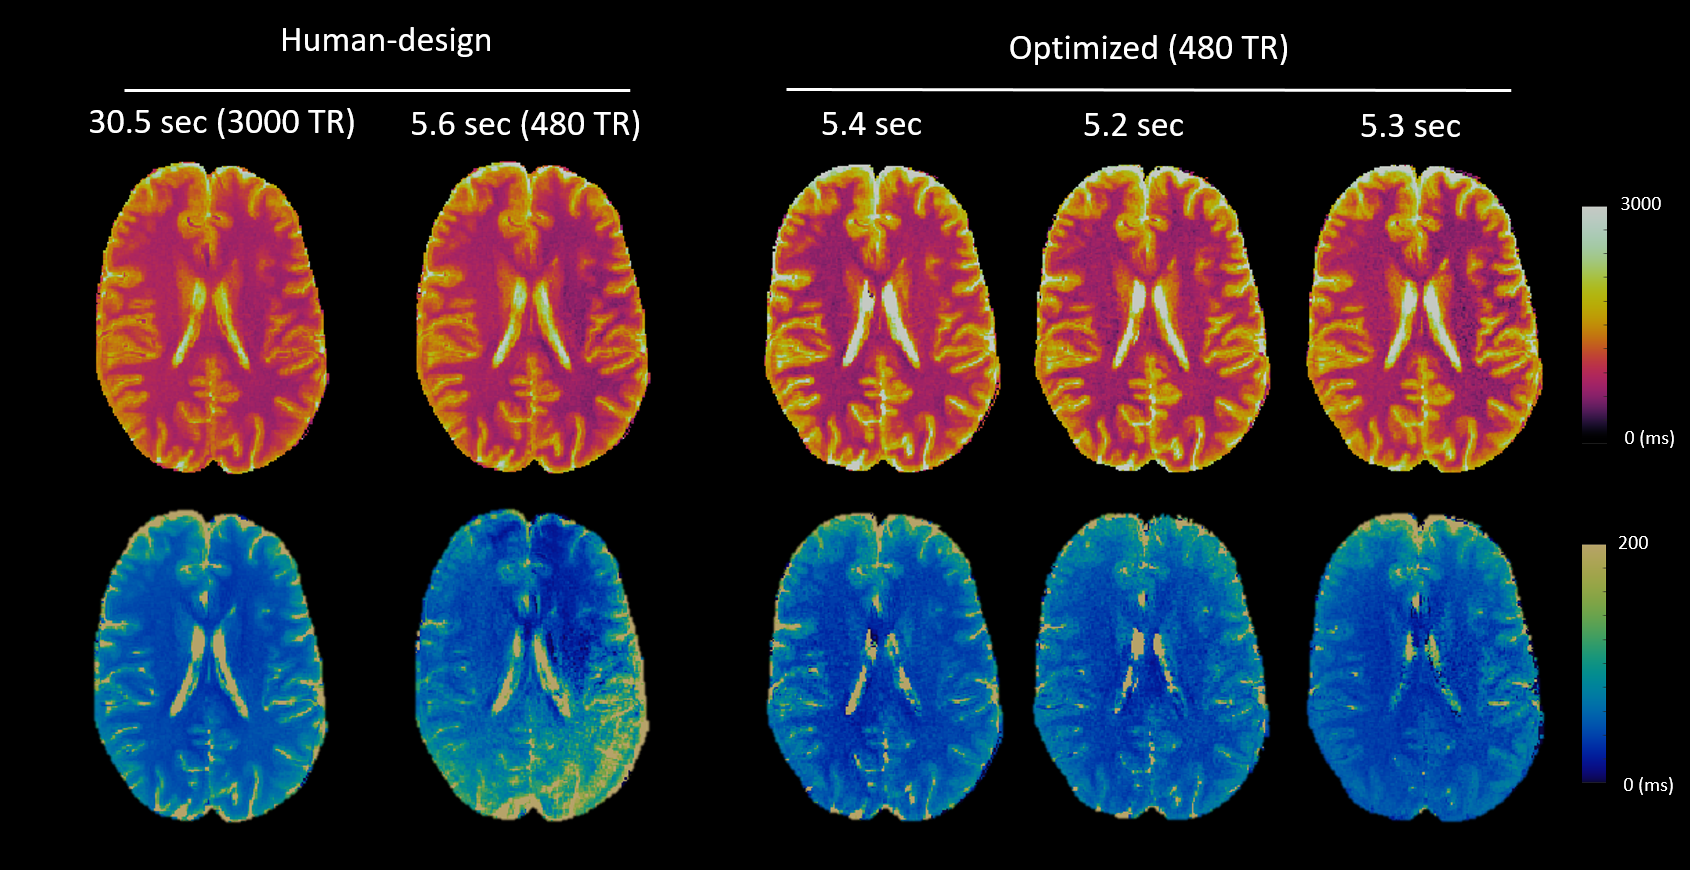
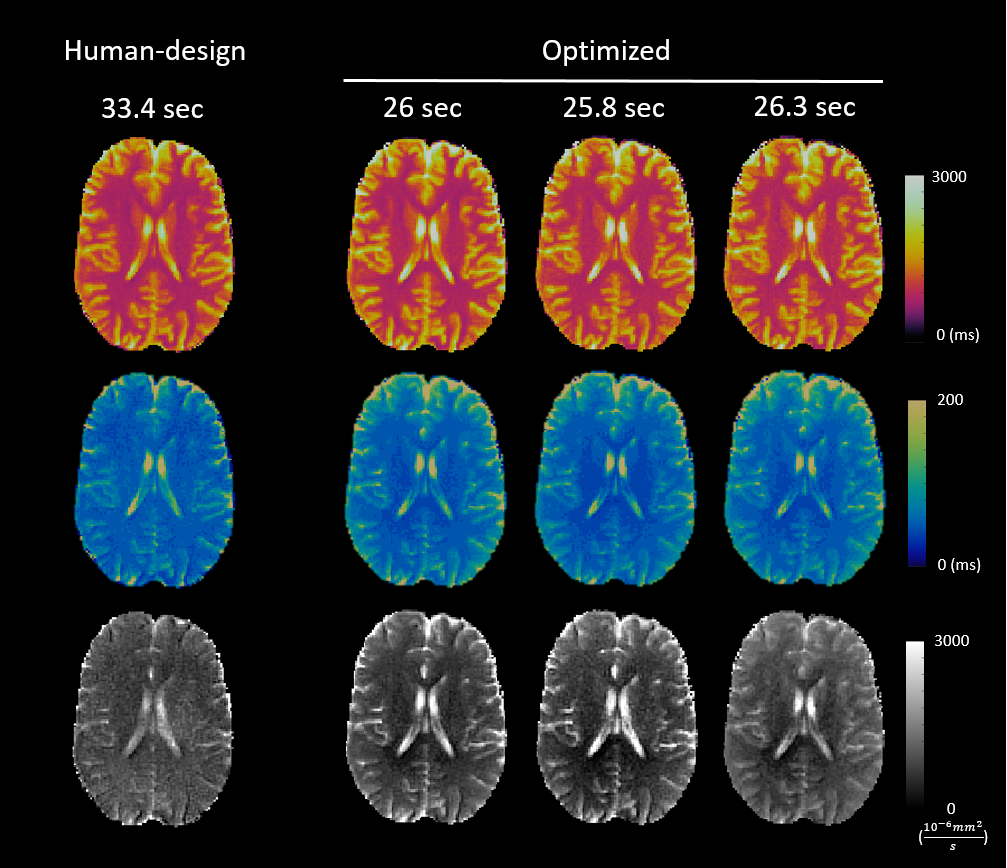
Figure 4 and 5 shows the in vivo performance of multiple optimized MRF and mdMRF scans. The optimized MRF sequences are robust against shading, especially in T2, validating the simulation results. The optimized mdMRF scans could achieve shorter scan duration with high image quality, showing improved contrast on T2 and ADC maps than the human-designs.
Conclusions
We propose a fast error characterization model for optimization schemes to design MRF and mdMRF scans with shorter scan time and improved robustness against measurement errors, such as undersampling and B0 inhomogeneity. The proposed paradigm is not limited to MRF but enables experimental design for any other high-dimensional quantitative imaging framework.Acknowledgements
The authors would like to acknowledge funding from Siemens Healthineers and NIH grants EB026764-01, EB029658-02, and NS109439-01.References
1. Jordan SP, Hu S, Rozada I, et al. Automated design of pulse sequences for magnetic resonance fingerprinting using physics-inspired optimization. Proc Natl Acad Sci U S A. 2021;118(40). doi:10.1073/PNAS.2020516118/-/DCSUPPLEMENTAL
2. Hu S, Jordan S, Boyacioglu R, et al. A Fast MR Fingerprinting Simulator for Direct Error Estimation and Sequence Optimization. Published online May 24, 2021. doi:10.48550/arXiv.2105.11594
3. Hu S, McGivney D, Griswold M, Ma D. Optimal experimental design of MR Fingerprinting for simultaneous quantification of T1, T2, and ADC. 31st Proc Intl Soc Mag Reson Med. Published online 2022.
4. Kirkpatrick S, Gelatt CD, Vecchi MP. Optimization by simulated annealing. Science. 1983;220(4598):671-680. doi:10.1126/science.220.4598.671
5. Candes EJ, Recht B. Exact low-rank matrix completion via convex optimization. In: 2008 46th Annual Allerton Conference on Communication, Control, and Computing. ; 2008:806-812. doi:10.1109/ALLERTON.2008.4797640
6. Doneva M, Amthor T, Koken P, Sommer K, Börnert P. Matrix completion-based reconstruction for undersampled magnetic resonance fingerprinting data. Magn Reson Imaging. 2017;41:41-52. doi:10.1016/j.mri.2017.02.007
Figures