2211
Reliability and reproducibility of whole-brain quantitative MR relaxometry using different-channel-number coils1Department of Radiology, Taihe Hospital, Wuhan, China, 2GE Healthcare, Beijing, China, 3Department of Radiology,Taihe Hospital, Wuhan, China
Synopsis
Keywords: Data Acquisition, Relaxometry
Brain MAGiC imaging became widely applied in multi-center cooperation and in an individual longitudinal follow-up; however, acquisition with a backup coil at an emergency situation (i.e., a sudden coil breakdown) or a coil with different numbers of channels has not been explored on a 1.5T scanner yet. In contrast to small variation of PD values in the whole brain, T2 values varies relatively dramatically especially in cerebellum and showed statistically different between scans using different coils. It is worth noting that existence of inter-coil relaxometry difference should be careful for diagnosis.Introduction
Synthetic MRI such as MAGiC on brain imaging MAGiC is getting widely used from head to toe. With relatively short scan time, no need to slice matches, easy implementation and increasing availability of magnetic resonance image compilation (MAGiC), reliability and repeatability of longitudinal T1 relaxation time, transverse T2 relaxation time, proton density (PD) values are of importance for individual follow-ups and multi-center cooperation research. A previous study using quantitative magnetic resonance (qMR) imaging method (QRAPMASTER) showed good accuracy, repeatability and reproducibility of T1, T2 measurements using both neurovascular coil (NV) and head coil (H) on 1.5T scanner while some studies demonstrated the effect of different coils on acquired tissue relaxation parameters in knee joint and lumbar spine imaging on 3.0T scanner.[1–3] In a clinical perspective, mapping of brain tissues for consecutive evaluation of treatment effects has been particularly interesting due to the rapid evolution of immunotherapy. Given broad applications of MAGiC in clinics, of course not only in brain, reliability of quantitative parameters should be assessed, especially for most hospitals without two available head-exclusive coils for 1.5T MR scanner despite one finding of reliable quantitative values using different parameters.[4] Our study aimed to explore the reliability and reproducibility of whole-brain relaxometry parameters using a head coil and a flexible coil (as a backup coil).Materials and methods
This study retrospectively collected synthetic MRI data of 20 patients (five women, mean age was 25.2 years, ranged 24-27 years) who underwent the brain synthetic MRI (Magnetic Resonance Image Compilation, MAGiC) sequence on 1.5 T MRI system (Signa Voyager, GE Healthcare, Milwaukee, USA) with the main parameters presented in Table 1 and the following two coils on the same day. Two types of coils were used: (Ⅰ) a 24-element brain coil (termed as “HEAD”) and (Ⅱ) a 16-channel phased-array receive only flex coil (termed as “FLEX” below). In addition, all scans were repeated within three days for 10 subjects who were randomly selected from all subjects. AAL116 ROI-based measurements of T1, T2, and PD values from MAGiC were automatically retrieved by an in-house code embedded in MATLAB. Paired t test or Wilcoxon test according to data normality and homogeneity of variance was utilized to prove the reliability of whole-brain regions acquired with different coils; the reproducibility of quantitative values between scans was analyzed using the root-mean-square coefficient-of-variation (RMS CV%) defined by Gluer et al.[5]Results
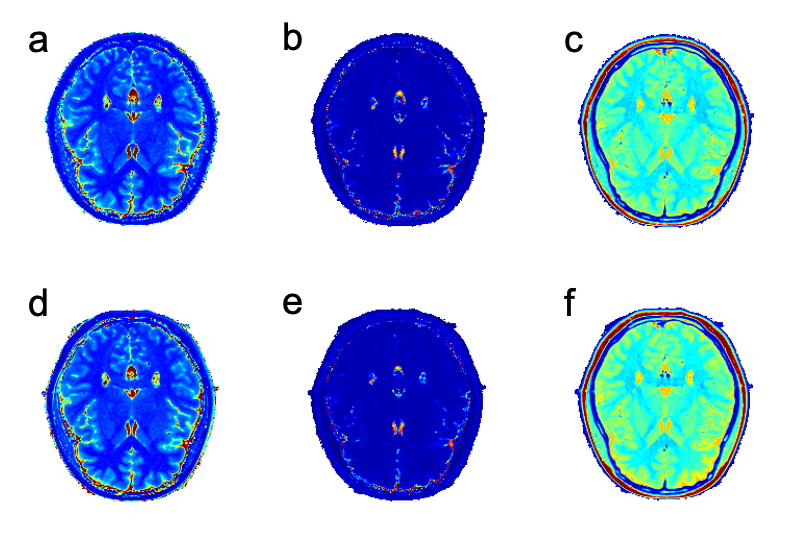
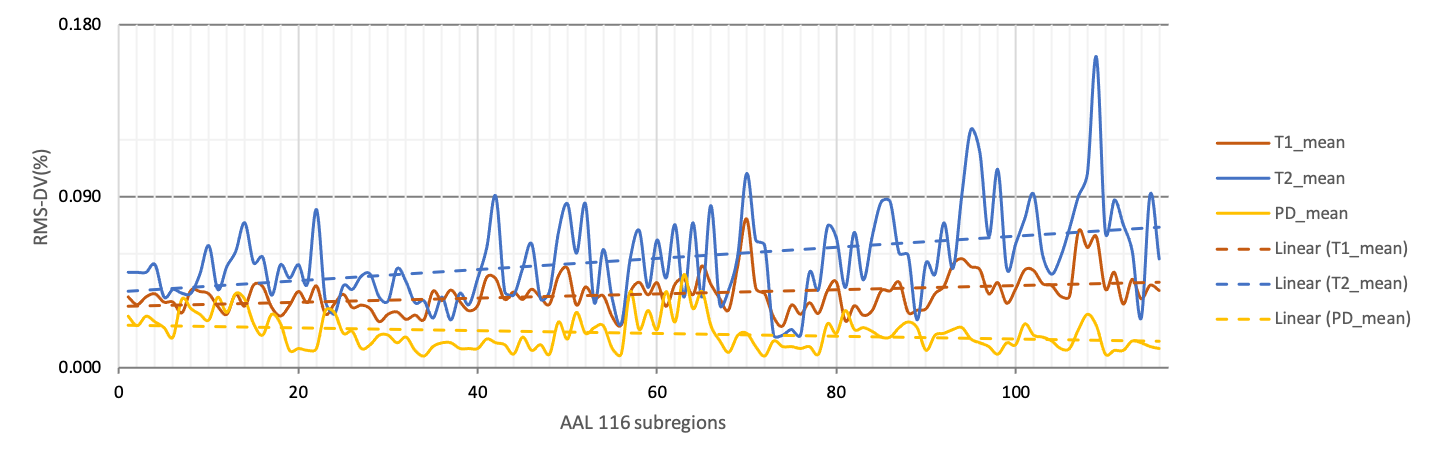
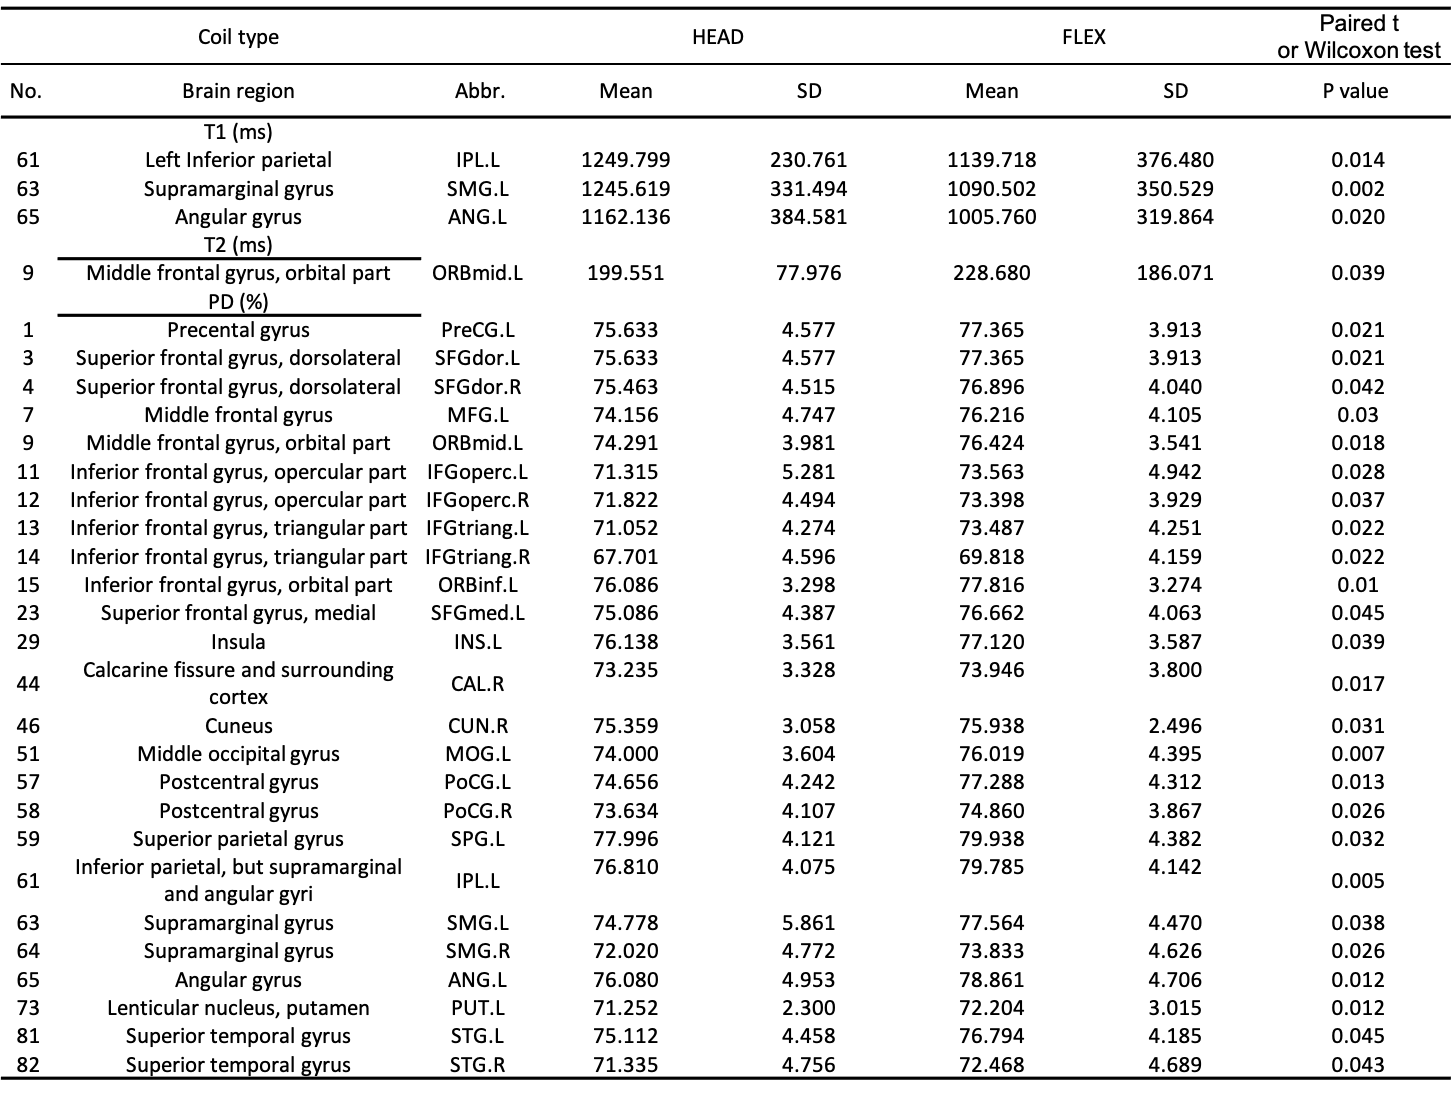
Representative T1, T2 and PD maps of a subject were shown in Figure 1. Significantly different of T1 and T2 values between coils were found in parietal lobe and prefrontal lobe, respectively. Statistically different PD values between coils were found in frontal, prefrontal, occipital, parietal and temporal lobes as well as subcortical cortex. Statistically different T1, T2, and PD values obtained from MAGiC for different coils are shown in Table 2. Repeatability of the whole-brain 116 subregions are shown in Figure 2. RMS-CV% of T1, T2 and PD fluctuated relatively dramatically in cerebellum compared to cerebrum.Discussion
Our observations for quantitative measurements of synthetic brain MRI revealed statistical differences of the T1, T2 and PD values depending on the used coils. Coil arrangement and number respectively affects transmit uniformity and transmit performance. Electric loading also varies as subject weight.[4,6] PD values in several brain subregions were found statistically different between coils as magnetic susceptibility differences at air/tissue interfaces induce static magnetic field inhomogeneities (ΔB0) in several regions of the human brain, including the inferior frontal and temporal brain regions. Therefore, coil selection plays a key role in signal receiving, subsequently contributing to different results of relaxation time. Although the quantitative parameters acquired by a quantitative magnetic resonance (qMR) imaging method (QRAPMASTER) adopted with NV and head coils showed no difference between T1, T2 and PD values, those relaxometry values acquired by a non-head phase array coil should be concerned especially for individual follow-ups.Conclusions
Quantitative relaxation parameters acquired with a non-brain-specific coil should be concerned especially for individual long-term tracking and post-treatment exam in comparison with previous data. The same coil was recommended to use to elevate reproducibility and comparability of relaxometry values obtained at different timepoints.Acknowledgements
No acknowledgement found.References
[1] M.L. Pachowsky, S. Trattnig, S. Apprich, A. Mauerer, S. Zbyn, G.H. Welsch, Impact of different coils on biochemical T2 and T2* relaxation time mapping of articular patella cartilage, Skeletal Radiol. 42 (2013) 1565–1572. https://doi.org/10.1007/s00256-013-1699-z.
[2] G. Chang, G.C. Wiggins, D. Xia, R. Lattanzi, G. Madelin, J.G. Raya, M. Finnerty, H. Fujita, M.P. Recht, R.R. Regatte, Comparison of a 28-channel receive array coil and quadrature volume coil for morphologic imaging and T2 mapping of knee cartilage at 7T, J. Magn. Reson. Imaging. 35 (2012) 441–448. https://doi.org/10.1002/jmri.23506.
[3] W. Zhang, J. Zhu, X. Xu, G. Fan, Synthetic MRI of the lumbar spine at 3.0 T: feasibility and image quality comparison with conventional MRI, Acta Radiol. 61 (2020) 461–470. https://doi.org/10.1177/0284185119871670.
[4] Z. Zheng, J. Yang, D. Zhang, J. Ma, H. Yin, Y. Liu, Z. Wang, The effect of scan parameters on T1, T2 relaxation times measured with multi-dynamic multi-echo sequence: a phantom study, Phys. Eng. Sci. Med. 45 (2022) 657–664. https://doi.org/10.1007/s13246-022-01128-0.
[5] C.-C. Glüer, G. Blake, Y. Lu, B.A. Blunt1, M. Jergas1, H.K. Genant1, Accurate assessment of precision errors: How to measure the reproducibility of bone densitometry techniques, Osteoporos. Int. 5 (1995) 262–270. https://doi.org/10.1007/BF01774016.
[6] X. Li, V. Pedoia, D. Kumar, J. Rivoire, C. Wyatt, D. Lansdown, K. Amano, N. Okazaki, D. Savic, M.F. Koff, J. Felmlee, S.L. Williams, S. Majumdar, Cartilage T 1ρ and T 2 relaxation times: longitudinal reproducibility and variations using different coils, MR systems and sites, Osteoarthritis Cartilage. 23 (2015) 2214–2223. https://doi.org/10.1016/j.joca.2015.07.006.
Figures