2210
Synthetic MRI derived quantitative mapping in predicting Lymphovascular interstitial infiltration status of cervical cancer1Nanjing Maternity and Child Health Care Hospital, Nanjing, China, 2GE Healthcare, MR Research China, Beijing, P.R. China, Beijing, China
Synopsis
Keywords: MR Fingerprinting/Synthetic MR, Uterus, LVSI
This study aimed to investigate whether synthetic-MRI derived quantitative maps can predict lymphovascular interstitial infiltration (LVSI) status in cervical cancer. 49 patients with cervical cancer were recruited with the status of LVSI confirmed by pathology. Synthetic MRI derived T1, T2 and PD mapping were obtained for each patient. Statistical differences were shown in T1 and PD values between LVSI-positive and LVSI-negative patients. An optimal diagnostic efficacy was further shown for T1+PD with high AUC of 0.777. With these findings, it can be concluded that relaxation maps derived from synthetic MRI may be helpful for predicting LVSI status in cervical cancer.Synopsis
This study aimed to investigate whether synthetic-MRI derived quantitative maps can predict lymphovascular interstitial infiltration (LVSI) status in cervical cancer. 49 patients with cervical cancer were recruited with the status of LVSI confirmed by pathology. Synthetic MRI derived T1, T2 and PD mapping were obtained for each patient. Statistical differences were shown in T1 and PD values between LVSI-positive and LVSI-negative patients. An optimal diagnostic efficacy was further shown for T1+PD with high AUC of 0.777. With these findings, it can be concluded that relaxation maps derived from synthetic MRI may be helpful for predicting LVSI status in cervical cancer.Introduction
Lymphovascular interstitial infiltration (LVSI) in cervical cancer, defined as the presence of tumor cells in lymphatic vessels or blood vessels, is a local pathological feature that reflects the benignity or malignancy of tumor. The diagnosis of cervical cancer with and without LVSI is crucial, as it can influence the decision-making of clinical treatment including early surgery and postoperative chemotherapy. 1-2Magnetic resonance image compilation (MAGiC), as one type of synthetic MRI, is a relative novel quantitative MRI technique that has an advantage to generate T1, T2 and PD maps simultaneously in a single scan with only a few minutes.3 The resultant quantitative maps from MAGiC have shown excellent correlation with the ones acquired with conventional MRI techniques.4-7 Quantitative T2 mapping has been reported with an robust prediction of LVSI status for cervical cancer patients, and shown superior performance than apparent diffusion coefficient derived from diffusion weighted imaging.4 In addition to T2 mapping, the clinical potential of quantitative metrics of T1 and PD mapping has however, not been explored in LVSI prediction so far.
Therefore, the main goal of this study was to investigate if MAGiC derived T1, T2 and PD mapping was feasible for predicting LVSI status in cervical cancer preoperatively.
Methods and materials
SubjectsA total of 49 patients were recruited in the study,including LVSI-positive patients (n=37, mean age 52 years ranging from 38-72 years),LVSI-negative patients(n=12, mean age 44 years ranging from 30-67 years). All patients were confirmed by pathological analyses after surgery.
MRI acquisition
All MRI experiments were performed on a Signa Architect 3.0 T MRI scanner (GE, USA) using a 30-channel phased-array surface coil. Fast-spin-echo based T1-weighted imaging (T1WI) and T2-weighted imaging (T2WI) for anatomic visualization,and MAGiC imaging were applied. The scan parameters were presented in Table 1.
Image analysis
All MAGIC data were post-processed using a vendor-provided program (MAGIC, v.100.1.1). The corresponding T1, T2, and PD mapping were obtained accordingly for each patient. The regions of interest (ROI)s were placed onto the slice showing the largest area of lesion identified on T2WI images, avoiding the necrotic and cystic tumor areas, by two experienced radiologists with more than ten years of experience, respectively. The mean T1, T2 and PD values of ROIs were automatically calculated for each subject.
Statistical analysis
Statistical analyses were performed using SPSS (version 23.0) and MedCalc software (version 15.2.2). Intra-class correlation coefficient analysis was applied to assess the inter-observer agreement of each parameter measurement over two radiologists. The corresponding quantitative indicators (T1,T2,PD) of each group were tested for normality. Each parameter was compared between LVSI-positive and LVSI-negative groups by Student’s t-test for normal distribution or by the Mann-Whitney U test for non-normal distribution. For parameters with statistic significance, the receiver operating characteristic (ROC) curve with the area under the ROC curve (AUC) was further applied separately to assess the corresponding diagnostic efficacy in differentiating LVSI-positive group from LVSI-negative group. P<0.05 was considered statistically significant.
Results
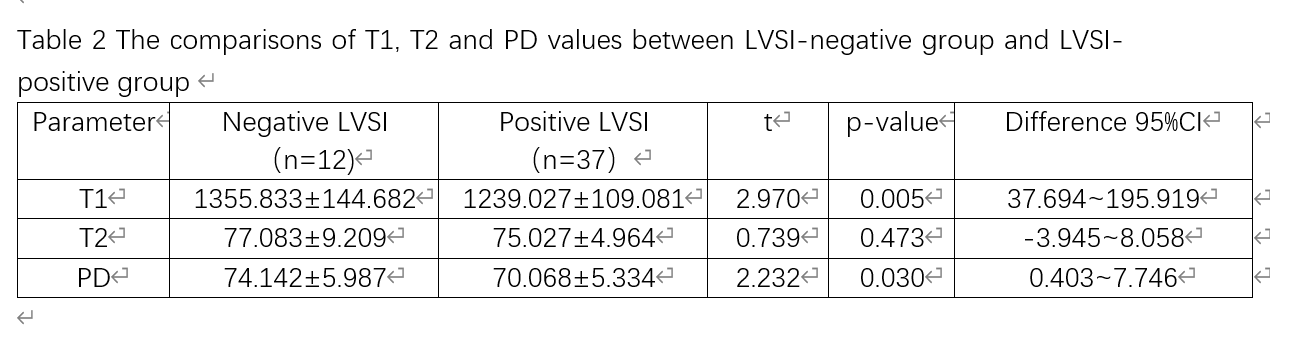
Excellent inter-observer agreement of parameter measurements was confirmed by high ICCs (>0.85 for each parameter).T1 and PD values were significantly higher in the LVSI-negative group than in the LVSI-positive group (T1:1355.833±144.682ms vs 1239.027±109.081ms, p<0.05; PD:74.142±5.987p.u. vs 70.068±5.334p.u., p<0.05; Table 2), while comparable T2 values were found between two groups.
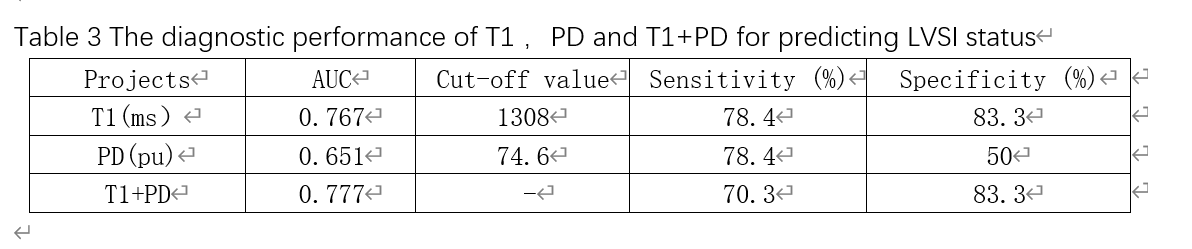
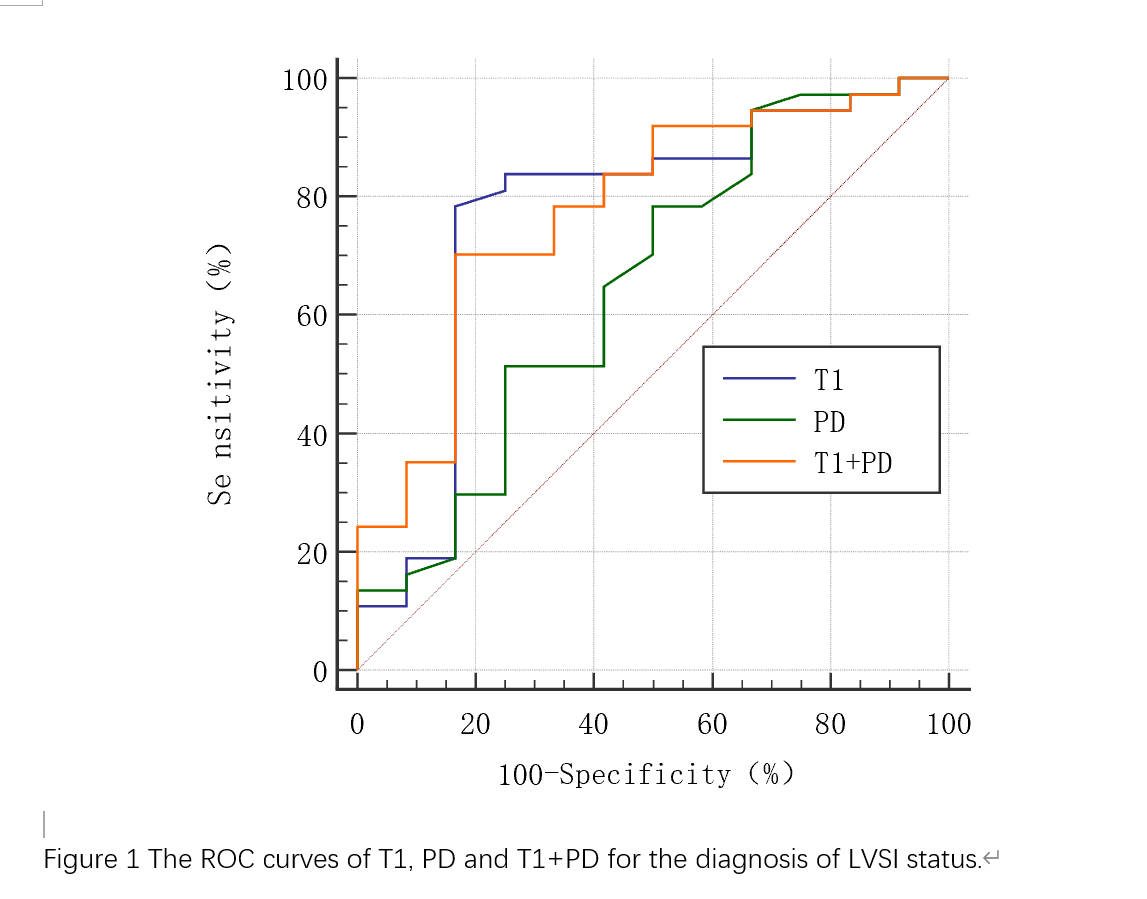
Robust diagnostic efficacies were also shown for T1 and PD with high AUCs of 0.767 and 0.651, respectively. The optimal diagnostic efficacy was observed for combined T1+PD with higher AUC of 0.777 (Table 3, Figure 1).
Discussion
In this study, MAGiC derived quantitative T1, T2 and PD mapping were investigated in predicting LVSI status of cervical cancer. Our study found that different T1 and PD were shown between LVSI-positive patients and LVSI-negative patients. Possible explanation could be that longer T1, which is the longitudinal relaxation time as one inherent property of tissue, can reflect richer extracellular matrix and higher malignancy of positive LVSI.4 Moreover, lower PD values were found in LVSI-positive patients in this study, indicating relatively low free water content and decreased extracellular space in malignant lesions.9 In addition, an optimal diagnostic efficacy was validated with combined T1 + PD in diagnosing LVSI status.Conclusion
In conclusion, our study demonstrated that quantitative T1 and PD values obtained by synthetic MRI- MAGiC could distinguish effectively between LVSI-positive and LVSI-negative patients, and may be considered as effective biomarkers applied in clinical diagnosis.Acknowledgements
No acknowledgement found.References
[1]Mi HL, Suo ST, Cheng JJ,et al., The invasion status of lymphovascular space and lymph nodes in cervical cancer assessed by mono-exponential and bi-exponential DWI-related parameters. Clin Radiol. 2020 Oct;75(10):763-771.
[2]Padera TP, Kadambi A, di Tomaso E,et al., Lymphatic metastasis in the absence of functional intratumor lymphatics. Science. 2002 Jun 7;296(5574):1883-6.
[3]Warntjes JB, Leinhard OD, West J, et al., Rapid magnetic resonance quantification on the brain: Optimization for clinical usage. Magn Reson Med. 2008 Aug;60(2):320-9.
[4] Meng T, He N, He H, et al.,The diagnostic performance of quantitative mapping in breast cancer patients: a preliminary study using synthetic MRI. Cancer Imaging. 2020 Dec 14;20(1):88.
[5] Li S, Liu J, Zhang F, et al., Novel T2 Mapping for Evaluating Cervical Cancer Features by Providing Quantitative T2 Maps and Synthetic Morphologic Images: A Preliminary Study. J Magn Reson Imaging. 2020 Dec;52(6):1859-1869.
[6] Cui Y, Han S, Liu M, Wu PY, et al., Diagnosis and Grading of Prostate Cancer by Relaxation Maps From Synthetic MRI. J Magn Reson Imaging. 2020 Aug;52(2):552-564.
[7] Jiang Y, Yu L, Luo X, et al., Quantitative synthetic MRI for evaluation of the lumbar intervertebral disk degeneration in patients with chronic low back pain. Eur J Radiol. 2020 Mar;124:108858.
[8]Seo M, Ryu JK, Jahng GH, et al., Estimation of T2* relaxation time of breast cancer: correlation with clinical, imaging and pathological features. Korean J Radiol. 2017;18(1):238 –48.
[9]Wang P, Hu S, Wang X, et al., Synthetic MRI in differentiating benign from metastatic retropharyngeal lymph node: combination with diffusion-weighted imaging. Eur Radiol. 2022 Aug 11.
Figures
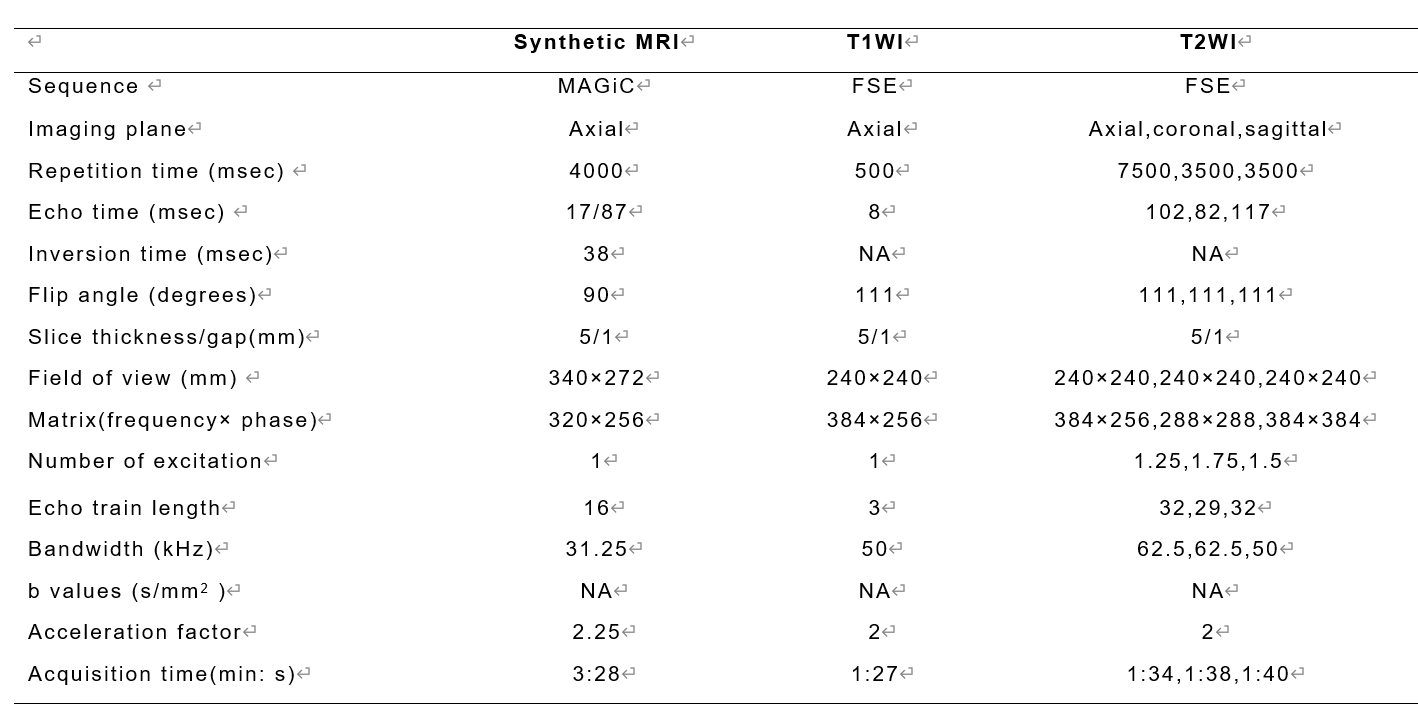
Table 1. MRI parameters applied in the study
MAGiC: Magnetic resonance image compilation ; FSE: fast spin echo;T1WI: T1 weighted imaging; T2WI: T2 weighted imaging; NA: not applicable.