2207
An improved postprocessing method for more accurate R2* measurements in the presence of macroscopic B0 field variations1Department of Radiology, The University of Iowa, Iowa City, IA, United States, 2Department of Pediatrics, The University of Iowa, Iowa City, IA, United States
Synopsis
Keywords: Data Processing, Relaxometry, R2*; Macroscopic field; Correction
Macroscopic field variations result in an overestimate of R2*. One common approach to correct the bias is to utilize a three-parameter fit; however, the fitting is subject to overfitting. This study presents a new two-stage fitting of the three-parameter model by assuming that the macroscopic field variation is slowly varying in space. Using a numerical simulation and in vivo mice data, we demonstrate that the proposed method allows for a more accurate R2* measurement, and is less sensitive to noise.
INTRODUCTION
R2* is sensitive to detect iron and myelin-induced microscopic and mesoscopic field inhomogeneities in the brain1. However, it is also sensitive to macroscopic field inhomogeneities, resulting in an over-estimate of R2* by a mono-exponential model. To correct the effect, one common post-processing approach is to apply a sinc weighting function to the signal decay assuming a linear macroscopic field variation along the slice direction (γΔB0z in Eq. [1])2. For fitting the model (Eq. [1]) with three parameters (S0, γΔB0z, and R2*), an iterative fitting2-4 has been used to estimate the R2*. However, it is subject to overfitting at a low SNR, resulting in an increased variation of the R2* measurement2. This study presents a new two-stage fitting of the three-parameter model. By assuming that the macroscopic field variation is smooth, the presented fitting method provides more accurate estimates of γΔB0z and R2*. We use simulated noisy signals and in vivo mice data to demonstrate the feasibility of the presented method as compared to a mono-exponential fitting as well as an iterative three-parameter fitting.METHODS
Simulation:To study the noise effect on the fittings, the Rician noise was added to the signals in Eq. [1] with a SNR of 40, which was the average SNR of the in vivo experiments. One hundred sets of the noisy signals were generated independently to evaluate the sensitivities of the fitting parameters to noise (Fig. 1).
S(TE) = S0·e-R2*TE·sinc(γΔB0zTE) [1]
In vivo R2* measurements:
Seven healthy adult mice were imaged on a 7 Tesla Discovery MR901 system (GE Healthcare, Milwaukee, Wisconsin). The imaging protocol included a 2D multi-echo GRE sequence for R2* measurements and a FIESTA sequence for T2-weighted images. The parameters for the 2D multi-echo GRE sequence were: in-plane resolution of 78 µm2, slice thickness/gap of 380/100 µm, pixel bandwidth of 244 Hz, flip angle of 18°, TR of 68 ms, 6 TEs of 2.6-22.6 ms in increments of 4 ms, and number of averages: 2.
Proposed two-stage fitting method:
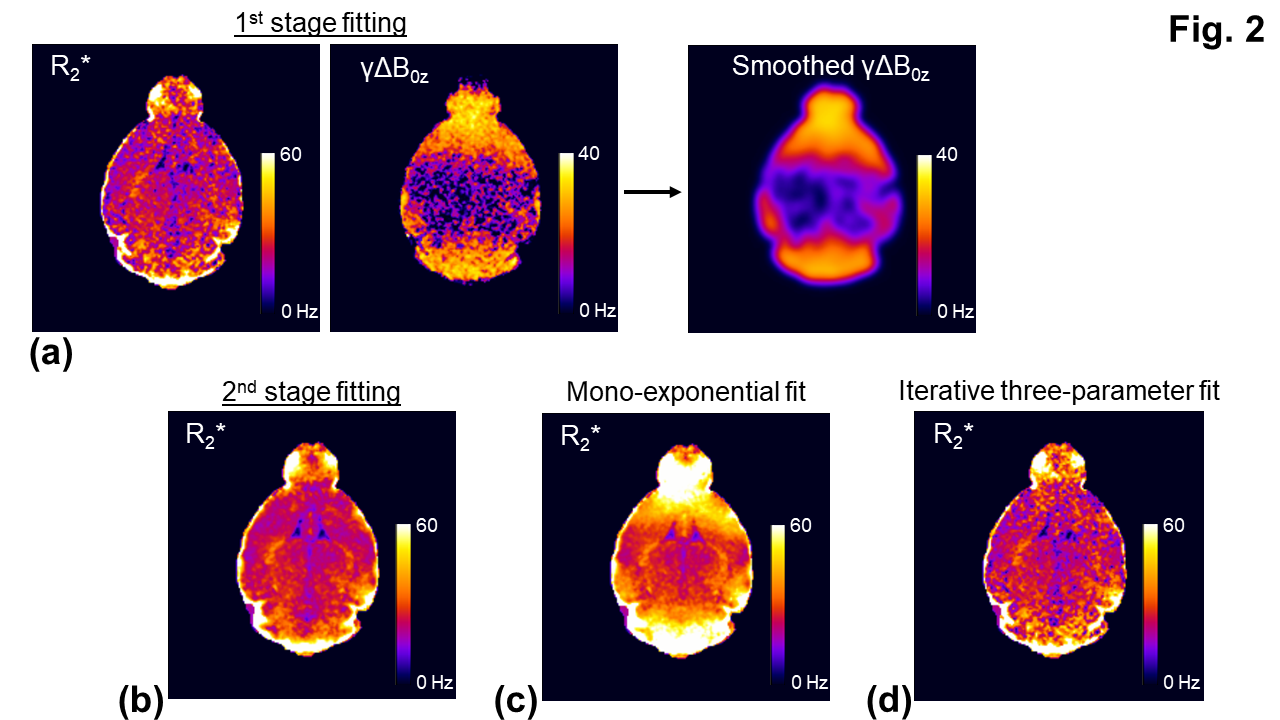
At the 1st stage fitting, the three-parameter model (Eq. [1]) was fitted to the signals. At a low SNR, the fitted parameters: R2* and γΔB0z showed large variations (Figs. 1a,2a). By assuming that γΔB0z map is smooth, a 2D Gaussian filter with a standard deviation (σgaussian) of 390 µm was applied to the γΔB0z map to generate a more accurate estimate of γΔB0z through the averaging (Figs. 1a,2a).
At the the 2nd stage fitting, given the estimate of γΔB0z, all the echo signals were divided by the sinc weighting function in Eq. [1] to remove the macroscopic field effect. The signals were then fit to a mono-exponential model, which was less sensitive to noise as compared to a three-parameter fit (Figs. 1a,1b,2a,2b).
Analysis:
Fitting: all the fittings were performed using the trust-region-reflective algorithm in Matlab (Mathworks, Inc.). For comparisons, the mono-exponential model and the iterative three-parameter fitting were also used to fit the data. For the iterative fitting2-4, the search for γΔB0z and the mono-exponential fitting were conducted iteratively until the minimal fitting residual was reached.
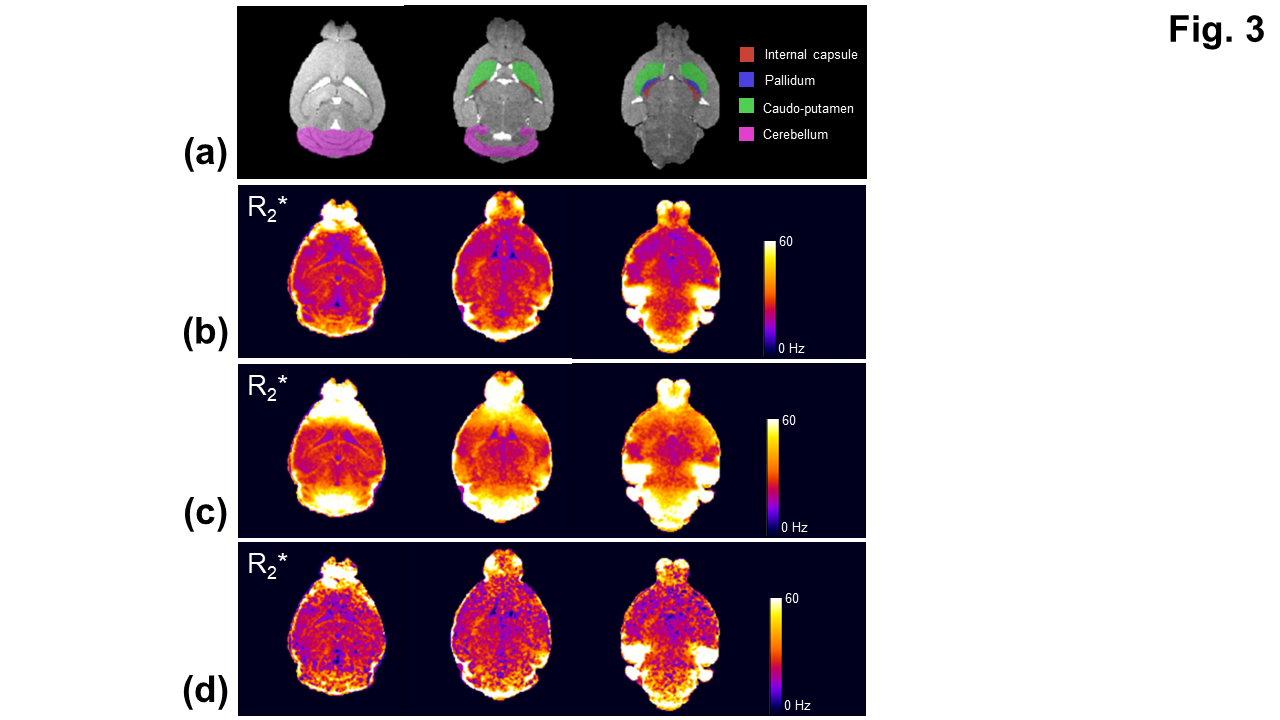
ROI: R2* maps and structural labels5,6 were brought into the same anatomical space through the co-registrations of GRE and the P56 Mouse Brain atlas images5,6 with the T2-weighted images using ANTs7. R2* measures were extracted from four ROIs: internal capsule, pallidum, caudoputamen, and cerebellum (Fig. 3). The mean, intra- and inter-subject variations were evaluated for each ROI.
RESULTS
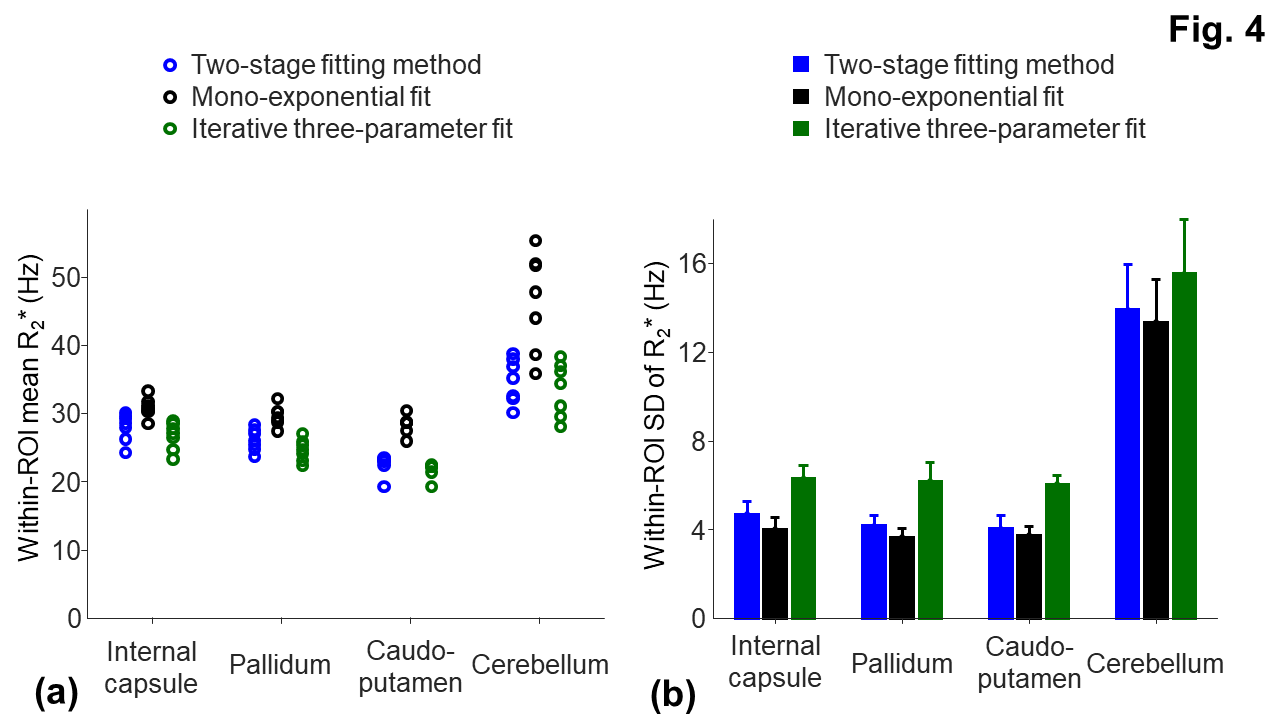
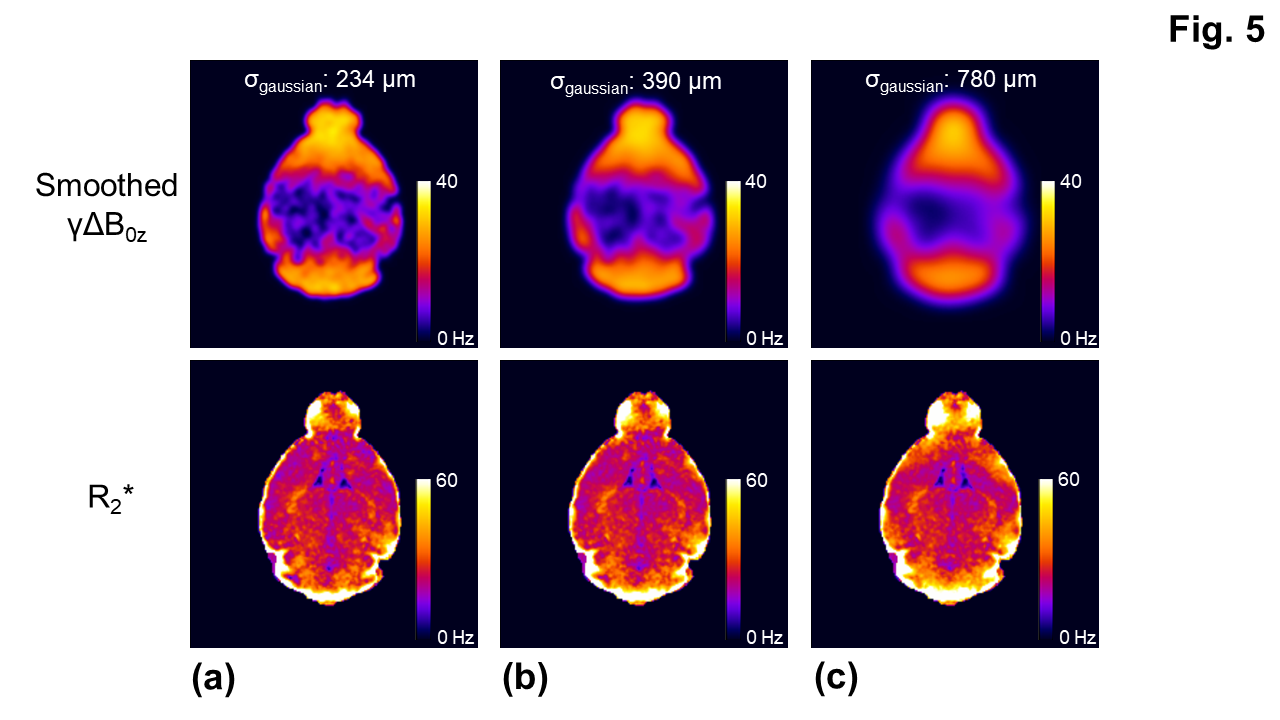
For the simulation, the overestimate of R2* (53.9 ± 2.32 Hz) (Fig. 1c) was corrected using the three-parameter fit in Eq. [1] (Figs. 1b,1d). The R2* measurement with the two-stage fitting method (R2*: 31.2 ± 2.5 Hz) was less sensitive to noise than that with the iterative three-parameter fitting (R2*: 31.5 ± 8.9 Hz). Consistent with the findings in the simulation, the two-stage fitting method allowed the mitigation of the macroscopic field effect and was less sensitive to noise than the iterative three-parameter fitting (Figs. 2b-2d,3b-3d). ROIs near air-tissue interfaces, such as caudo-putamen and cerebellum, showed more prominent macroscopic field effects (Fig. 3a,3c) and larger differences between corrected and uncorrected R2* values (up to 12 Hz) (Fig. 4a). Cerebellum also showed larger inter- and intra-subject variations of R2* than other ROIs (Figs. 4a,4b). In regions with a rapidly varying macroscopic field, such as cerebellum, the application of a strong smoothing filter (larger σgaussian) resulted in inaccurate estimates of γΔB0z and R2* for the two-stage fitting method (Fig. 5).DISCUSSION
Both the simulation and in vivo mice data demonstrate the benefit of using the two-stage fitting method for more accurate R2* measurements in the presence of linear macroscopic field variations. By assuming that the field change (γΔB0z) is smooth, the proposed method directly estimates γΔB0z from the 1st stage fitting, omitting the need for estimating the B0 map through the multi-echo GRE images or an additional data acquisition3,4,8-10. The non-iterative nature of the presented method also shortens the processing time.CONCLUSION
When γΔB0z map is smooth, the two-stage fitting of the three-parameter model permits more accurate R2* measurements in the presence of linear macroscopic field variations, and is less sensitive to noise.Acknowledgements
We acknowledge the Stead Family Department of Pediatrics Research Grant Program and Children’s Miracle Network for providing funding for this study.References
[1]. Shin HG, Lee J, Yun YH, Yoo SH, Jang J, Oh SH, Nam Y, Jung S, Kim S, Fukunaga M, Kim W, Choi HJ, Lee J. χ-separation: Magnetic susceptibility source separation toward iron and myelin mapping in the brain. Neuroimage. 2021 Oct 15;240:118371.
[2]. Fernández-Seara MA, Wehrli FW. Postprocessing technique to correct for background gradients in image-based R*(2) measurements. Magn Reson Med. 2000 Sep;44(3):358-66.
[3]. Dahnke H, Schaeffter T. Limits of detection of SPIO at 3.0 T using T2 relaxometry. Magn Reson Med. 2005 May;53(5):1202-6.
[4]. Peters AM, Brookes MJ, Hoogenraad FG, Gowland PA, Francis ST, Morris PG, Bowtell R. T2* measurements in human brain at 1.5, 3 and 7 T. Magn Reson Imaging. 2007 Jul;25(6):748-53.
[5]. Lein ES, Hawrylycz MJ, Ao N, et al., Genome-wide atlas of gene expression in the adult mouse brain. Nature. 2007 Jan 11;445(7124):168-76.
[6]. Bakker R, Tiesinga P, Kötter R. The Scalable Brain Atlas: Instant Web-Based Access to Public Brain Atlases and Related Content. Neuroinformatics. 2015 Jul;13(3):353-66.
[7]. Avants BB, Tustison NJ, Song G, Cook PA, Klein A, Gee JC. A reproducible evaluation of ANTs similarity metric performance in brain image registration. Neuroimage. 2011 Feb 1;54(3):2033-44.
[8]. Hernando D, Vigen KK, Shimakawa A, Reeder SB. R*(2) mapping in the presence of macroscopic B₀ field variations. Magn Reson Med. 2012 Sep;68(3):830-40.
[9]. Yang X, Sammet S, Schmalbrock P, Knopp MV. Postprocessing correction for distortions in T2* decay caused by quadratic cross-slice B0 inhomogeneity. Magn Reson Med. 2010 May;63(5):1258-68.
[10]. An H, Lin W. Cerebral oxygen extraction fraction and cerebral venous blood volume measurements using MRI: effects of magnetic field variation. Magn Reson Med. 2002 May;47(5):958-66.
Figures
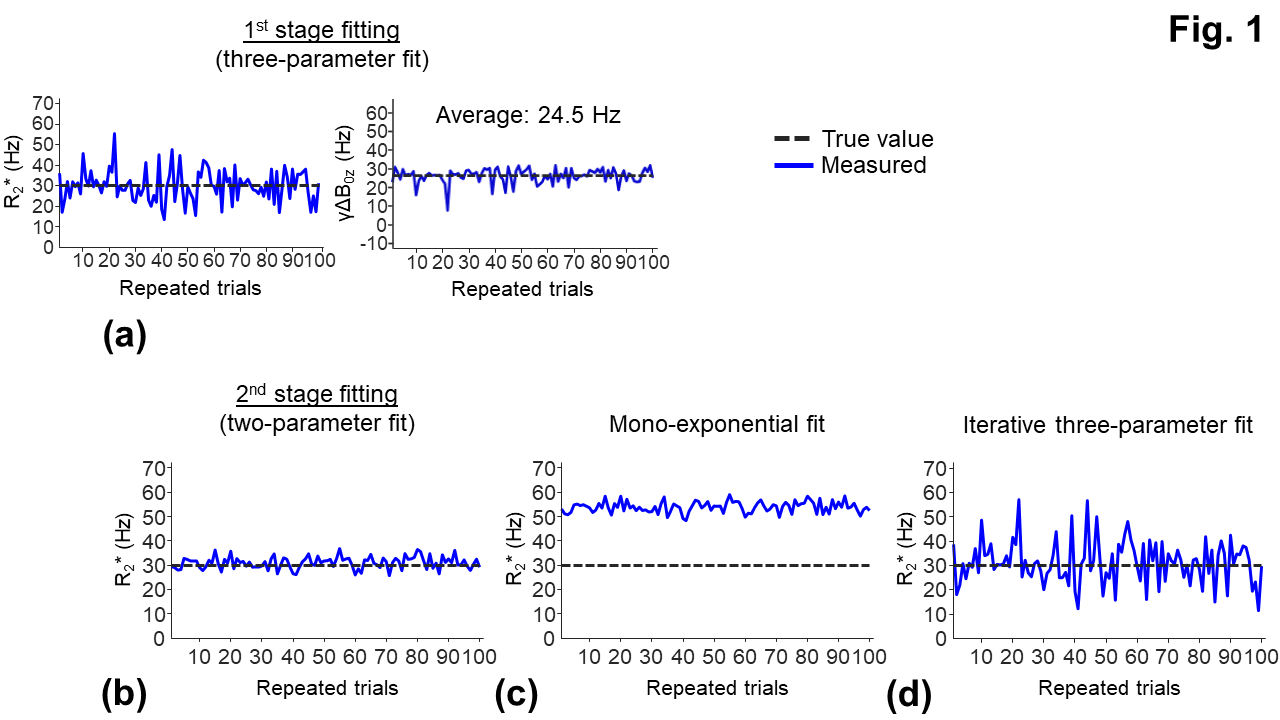
Fig. 1: One hundred sets of simulated noisy signals were fitted with the two-stage fitting of the three-parameter model (b), the mono-exponential model (c), and the iterative three-parameter fitting (d). a: γΔB0z was estimated from the averaging (24.5 Hz) and was used to remove the macroscopic field effect from the signals (Eq. [1]). Then the signals were fitted with the mono-exponential model to compute R2* (b). Noisy signals were generated using Eq. [1] with true R2* = 30 Hz, γΔB0z = 25 Hz, 6 TEs = 2.6-22.6 ms, and a SNR level = 40 to match the parameters in the in vivo measurements.