2203
Effects of Nucleus Pulposus Tissue Hydration on T1ρ and T2 Relaxation Times and Mechanical Properties
Megan Co1, Brian Raterman2, Arunark Kolipaka1,2, and Benjamin A Walter1,3
1Department of Biomedical Engineering, The Ohio State University, Columbus, OH, United States, 2Department of Radiology, The Ohio State University, Columbus, OH, United States, 3Spine Research Institute, The Ohio State University, Columbus, OH, United States
1Department of Biomedical Engineering, The Ohio State University, Columbus, OH, United States, 2Department of Radiology, The Ohio State University, Columbus, OH, United States, 3Spine Research Institute, The Ohio State University, Columbus, OH, United States
Synopsis
Keywords: Data Acquisition, Quantitative Imaging, Spine, Intervertebral Disc
T1ρ and T2 mapping have been developed to quantitively assess intervertebral disc (IVD) degeneration by quantifying proteoglycan and water content, respectively. In addition, magnetic resonance elastography (MRE) has been validated to quantify shear stiffness. This study determines how water content affects MRI relaxation times and MRE-derived mechanical properties. Our results showed that hydration has an influence on T1ρ and T2 relaxation times and MRE-derived shear stiffnesses and that there is a correlation between relaxation times and shear stiffnesses. This highlights MRI as a non-invasive technique to quantify tissue composition and mechanical properties to assess degenerative changes within the IVD.Introduction
Magnetic resonance imaging (MRI) techniques are commonly used as diagnostic tools to assess intervertebral disc (IVD) degeneration. T1ρ mapping measures the T1ρ relaxation time that is related to the interaction between macromolecules and water1 and has been demonstrated to strongly correlate with proteoglycan (GAG) content in IVDs2,3. T2 mapping measures the T2 relaxation time that is related to the interaction between water molecules and the collagen matrix allowing for the assessment of hydration changes that occur with disease4,5. Previous studies have often observed the effects of degeneration correlating to both relaxation times; however, multiple variables, such as GAG and water content, change simultaneously, making it difficult to determine which exact variable influences MRI relaxation times. Previous studies have demonstrated that magnetic resonance elastography (MRE)-derived shear stiffness measurements changes with disc degeneration6. Further investigation into MRI and MRE parameters and its correlation with tissue composition may help further establish T1ρ and T2 relaxation times as well as shear stiffness as biomarkers for disease. Therefore, the purpose of this study is to determine how solely water content affects MRI relaxation times and MRE-derived mechanical properties.Methods
17 IVDs were isolated from from bovine tails and underwent equilibrium dialysis in polyethylene glycol (PEG) solutions to manipulate hydration. The discs were distributed into one of two different osmotic conditions: 5 or 25% (g/mL) 20 kDa PEG in 0.15 mol/L NaCl exerting osmotic pressures of 0.027 or 0.565 MPa, respectively7. MRI scans were acquired using a 3T MR scanner (Prisma, Siemens Healthcare, Germany). T1ρ and T2-weighted MRIs were acquired for each disc in the transverse plane. The T1ρ sequence included spin-lock pulse times (TSL) from 0 to 340 ms in increments of 10 ms. One transverse slice was taken with 2 mm slice thickness with additional parameters: TE= 4.4 ms, TR=9.26 ms, FOV=200x200 mm, acquisition matrix=192x96, averages=3. The T2 sequence acquired one transverse slice 2 mm thick with additional parameters: TE = 8 ms, TR=2000 ms, FOV=200x200 mm, acquisition matrix=192x192, averages=3. A spin-echo echo-planar imaging MRE sequence was used to obtain shear stiffness of the nucleus pulposus (NP) region with 80Hz vibration. At least two 1 mm transverse slices with 4 MRE phase offsets were acquired with parameters: TE=30.4, TR=900, FOV=120x120mm, acquisition matrix=128x64, averages=14. A direct inversion algorithm was applied to the MRE scans to obtain shear stiffness. For T1ρ, and T2 scans, a region of interest was manually segmented via MRElab (Mayo Clinic, Rochester, MN) for the NP region. Image post-processing and filtering were performed using a custom-made software in Matlab (Mathworks, Natick, MA) to obtain average relaxation times and stiffness. %Water content was calculated (wet weight – dry weight)/dry weight x 100%. GAG content was assessed via a DMMB assay as previously described8. T-tests were conducted using JMP (version 16.0.0) to compare parameters between 5% and 25% PEG samples, and Pearson correlations were evaluated between water content, MRI, and tissue composition parameters.Results and Discussion
The water content, GAG content per dry weight, T1ρ relaxation time, and T2 relaxation time were compared between the 5% PEG and 25% PEG equilibrated NP tissue (Table 1). Equilibration in 25% PEG significantly reduced the water content compared to 5% PEG. 25% equilibrated NP tissue had a significantly higher GAG content compared to tissue equilibrated in 5% PEG. MRE-derived shear stiffness of 25% equilibrated tissue was on average higher than that of 5% equilibrated tissue. There was a significant negative correlation between water content and shear stiffness in NP tissue (R2=0.32, p=0.04) (Fig 1). There were negative correlations between T1ρ relaxation time and shear stiffness (R2=0.27, p=0.07) and between T2 relaxation time and shear stiffness (R2=0.24, p=0.09) (Fig 2). There were significant negative correlations between GAG content and T1ρ relaxation time (R2=0.46, p<0.01) and between GAG content and T2 relaxation time (R2=0.48, p<0.01) (Fig 3). There was a significant positive correlation between water content and T1ρ relaxation time (R2=0.86, p<0.01) and between water content and T2 relaxation time (R2=0.84, p<0.01) (Fig 4). The PEG solutions significantly affected the hydration of the tissue as can be seen by the small ranges of water content for 5% and 25% PEG. Hydration influenced T1ρ and T2 relaxation times and MRE-derived shear stiffness. Similar to previous studies focusing on the IVD, an increase in T1ρ and T2 relaxation time was associated with higher water content. In addition, T1ρ and T2 relaxation times were within a similar range as previous studies2,3,5. However, in contrast to prior studies we observed a negative correlation between T1ρ relaxation time and GAG content2,3. This may suggest that both relaxation times are more influenced by water content and that T1ρ is not a direct measure of GAG content. In addition, prior studies observed the changes in water content that occurred secondarily with disc degeneration and did not directly control the water content of the tissue.Conclusion
This study provides further evidence that T1ρ and T2 relaxation times may be used as a metric for water content and that shear stiffness is affected by hydration changes within IVD tissue. It also highlights MRI as a non-invasive technique to quantify tissue composition and mechanical properties to assess degenerative changes within the IVD.Acknowledgements
Special thanks to Mallory Stewart for her assistance in post-processing of scans. This work was funded by the Department of Biomedical Engineering, NIH NHLBI R01HL124096, and NIH NIAMS R01AR075062.References
- Wáng, Y.-X. J. et al. T1ρ magnetic resonance: basic physics principles and applications in knee and intervertebral disc imaging. Quant. Imaging Med. Surg. 5, 858–85885 (2015).
- Johannessen, W. et al. Assessment of human disc degeneration and proteoglycan content using T 1ρ-weighted magnetic resonance imaging. Spine (Phila. Pa. 1976). (2006) doi:10.1097/01.brs.0000217708.54880.51.
- Nguyen, A. M. et al. Noninvasive quantification of human nucleus pulposus pressure with use of T1p-weighted magnetic resonance imaging. J. Bone Jt. Surg. - Ser. A (2008) doi:10.2106/JBJS.G.00667.
- Martin, J. T. et al. In vivo fluid transport in human intervertebral discs varies by spinal level and disc region. JOR Spine (2022) doi:10.1002/jsp2.1199.
- Marinelli, N. L., Haughton, V. M., Muñoz, A. & Anderson, P. A. T2 relaxation times of intervertebral disc tissue correlated with water content and proteoglycan content. Spine (Phila. Pa. 1976). 34, 520–524 (2009).
- Walter, B. A. et al. MR elastography-derived stiffness: A biomarker for intervertebral disc degeneration. Radiology (2017) doi:10.1148/radiol.2017162287.
- Chahine, N. O., Chen, F. H., Hung, C. T. & Ateshian, G. A. Direct measurement of osmotic pressure of glycosaminoglycan solutions by membrane osmometry at room temperature. Biophys. J. 89, 1543–1550 (2005).
- Farndale, R. W., Buttle, D. J. & Barrett, A. J. Improved quantitation and discrimination of sulphated glycosaminoglycans by use of dimethylmethylene blue. BBA - Gen. Subj. (1986) doi:10.1016/0304-4165(86)90306-5.
Figures
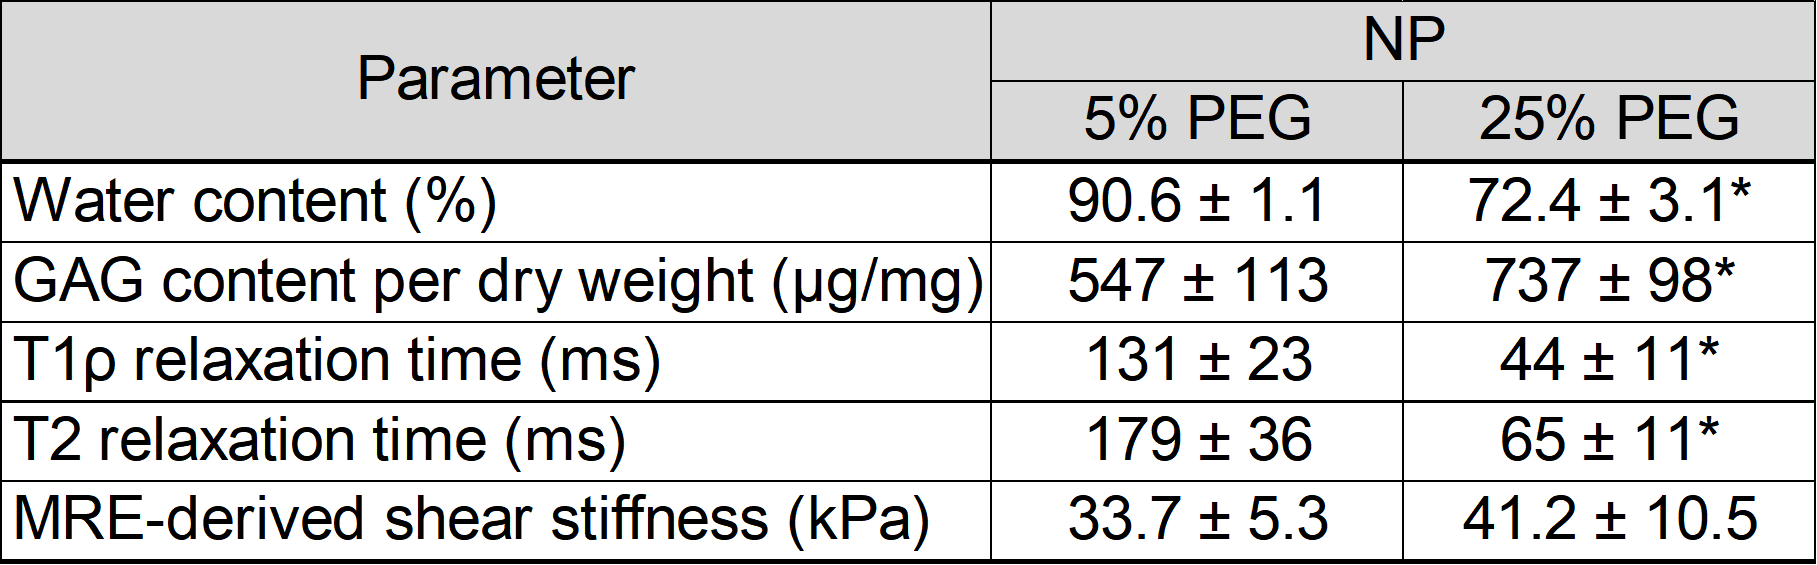
Table 1: Comparison of biochemical, MRI, and
MRE-derived mechanical properties between 5% and 25% equilibrated NP tissue.
The values are given as the mean and standard deviation. *P<0.05 considered
statistically significant compared against 5% PEG equilibrated tissue.
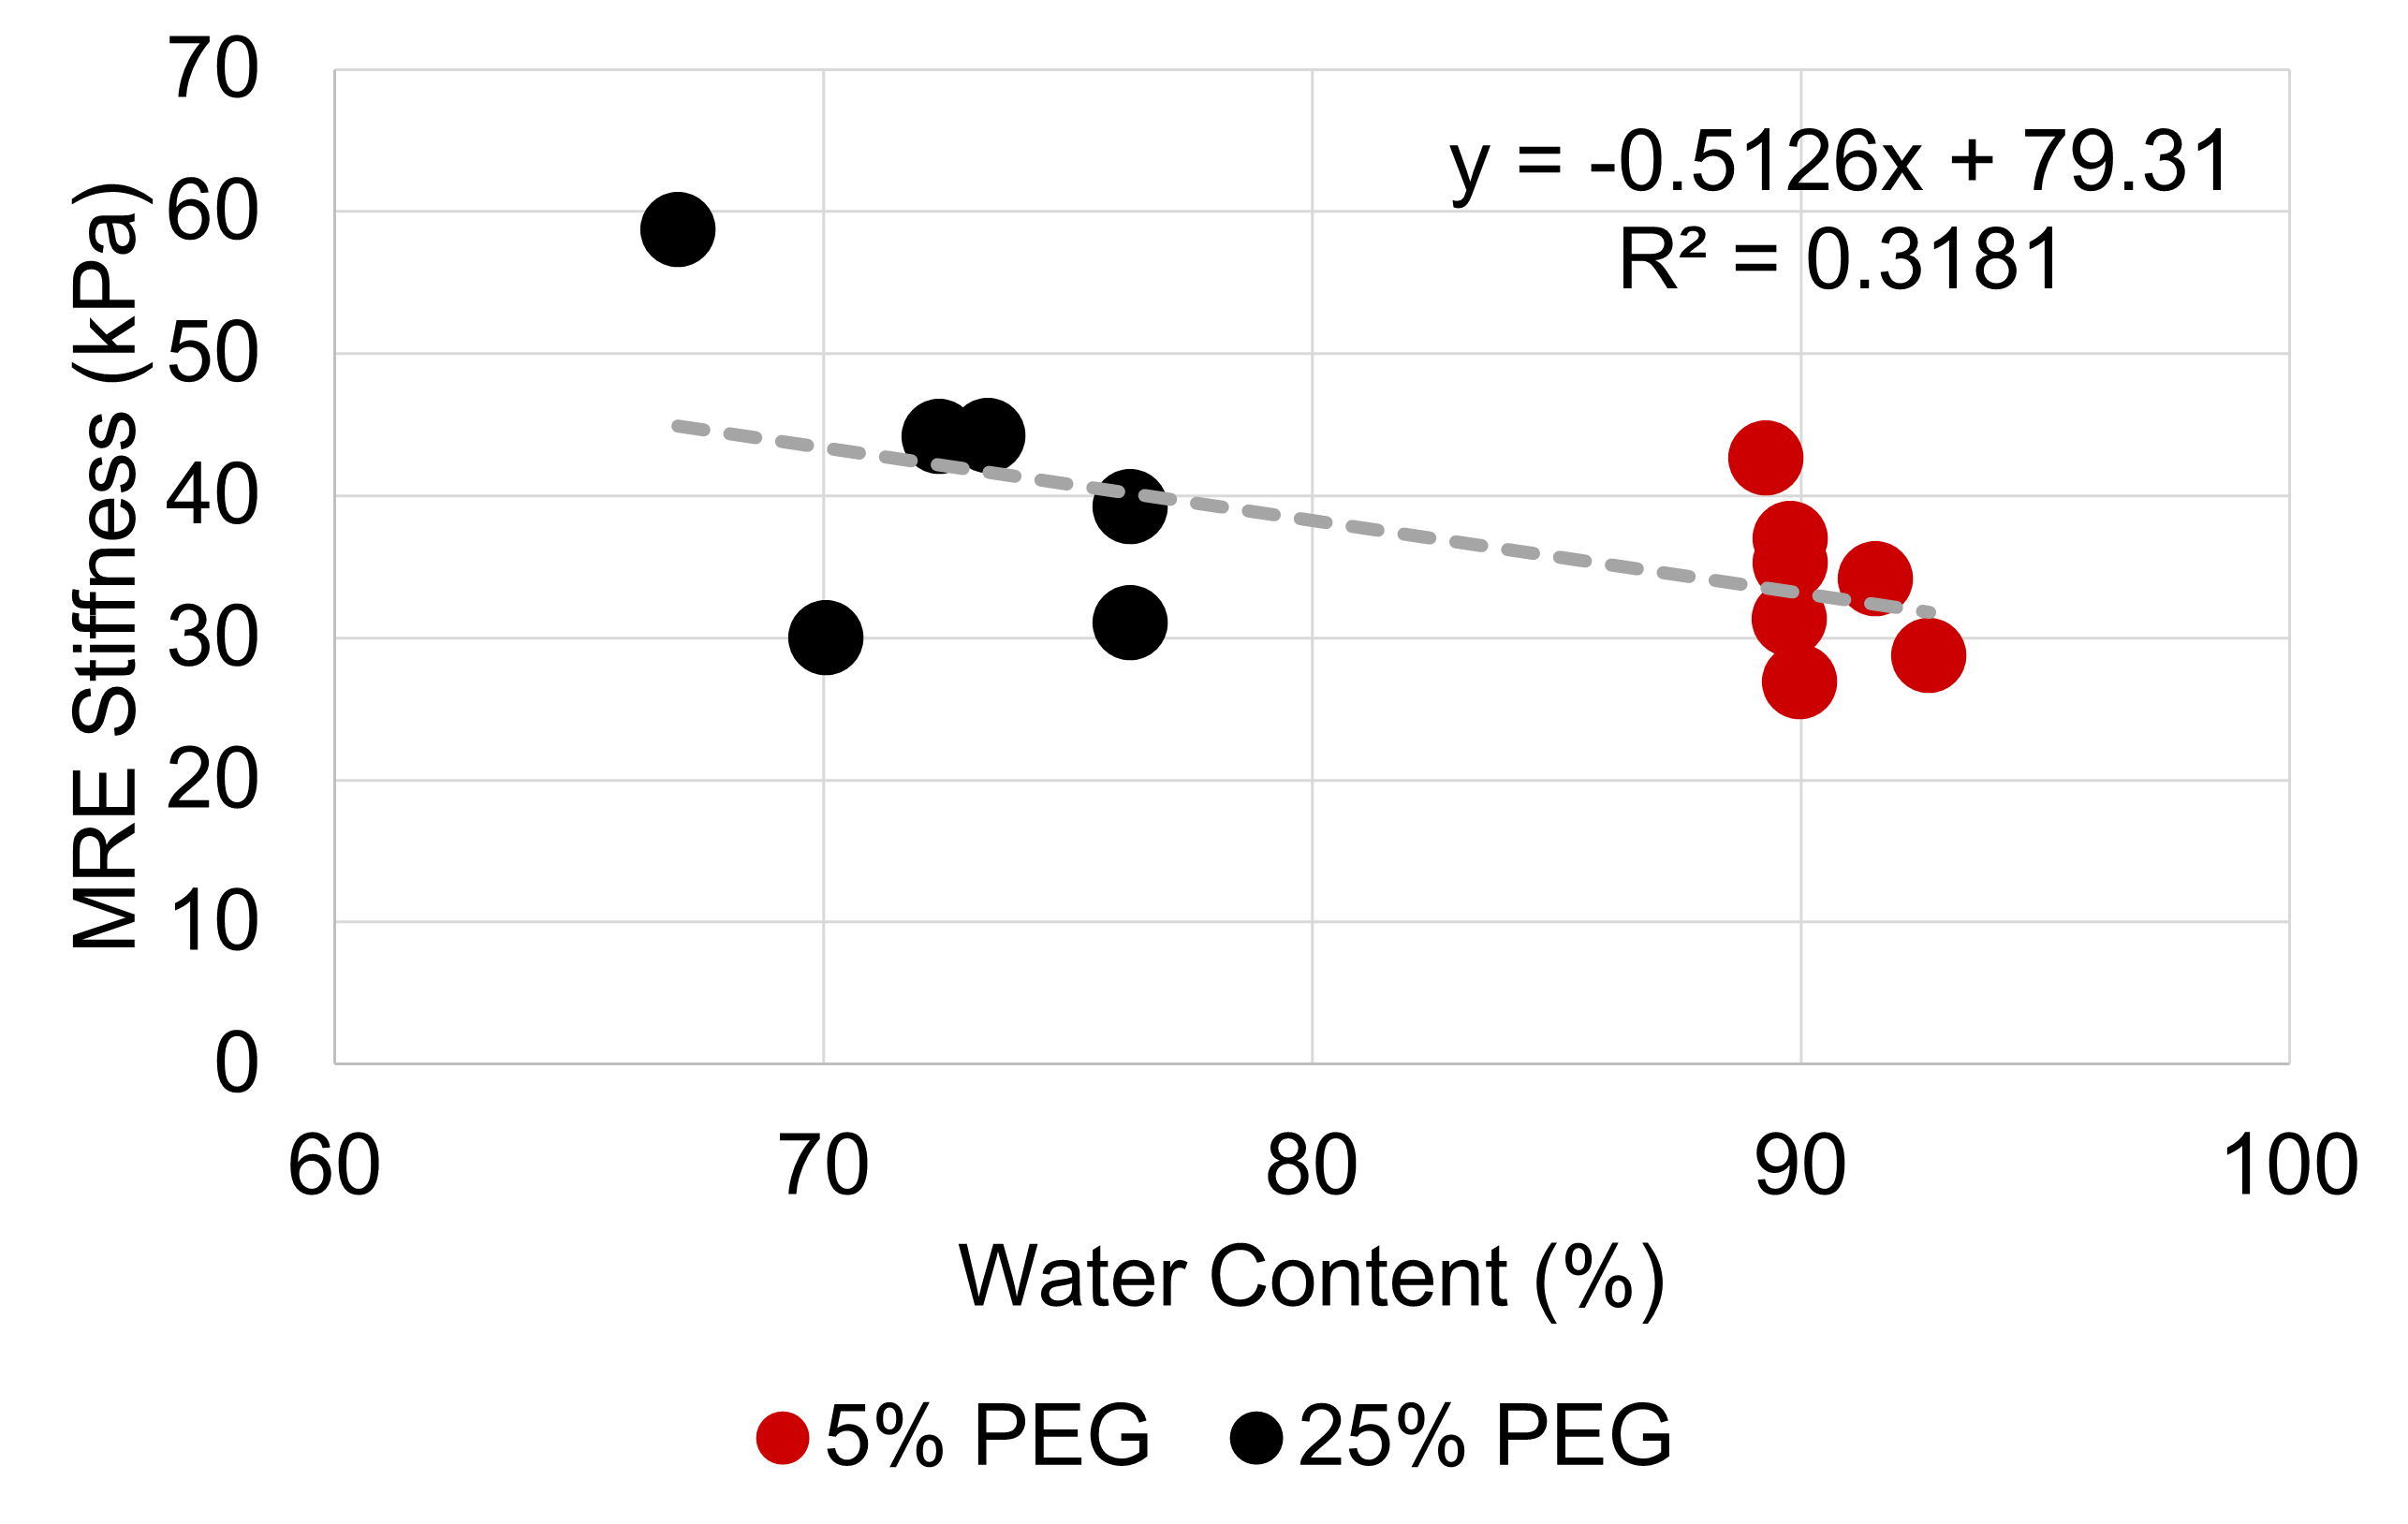
Figure 1: Correlation between water content and
MRE-derived shear stiffness for the NP region.
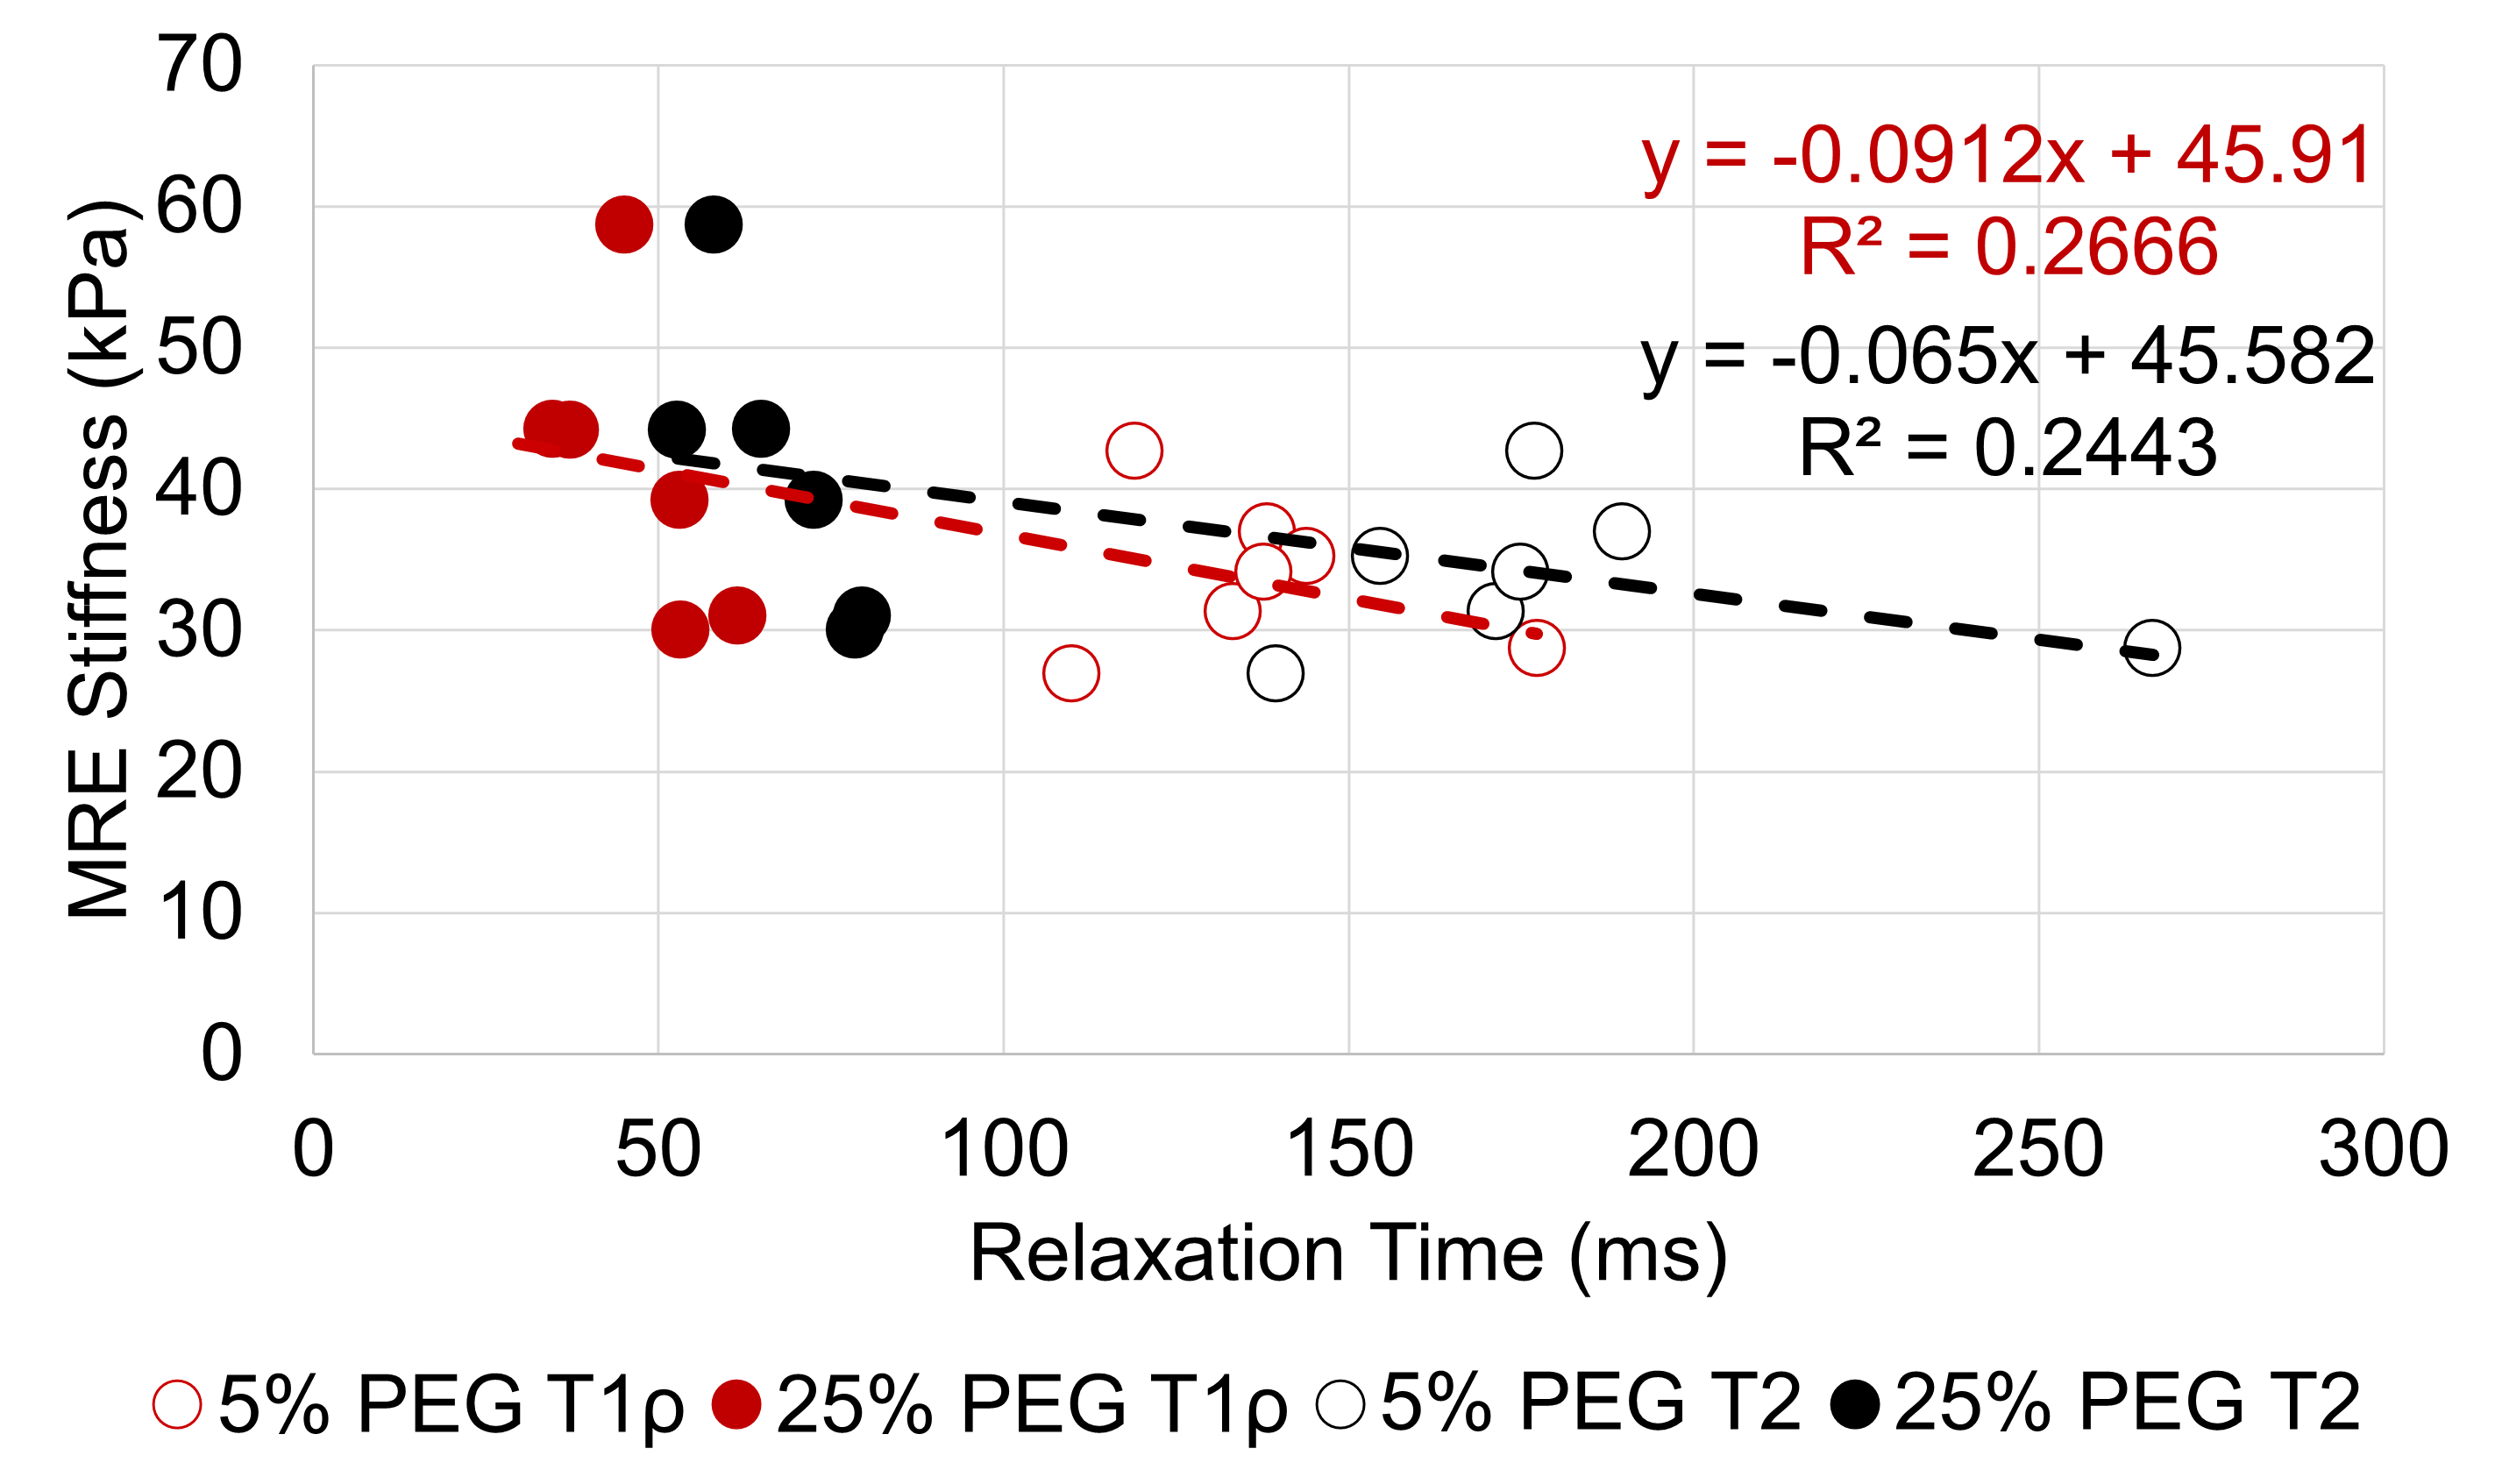
Figure 2: Correlation between T1ρ & T2 relaxation time and MRE-derived
shear stiffness for the NP region.
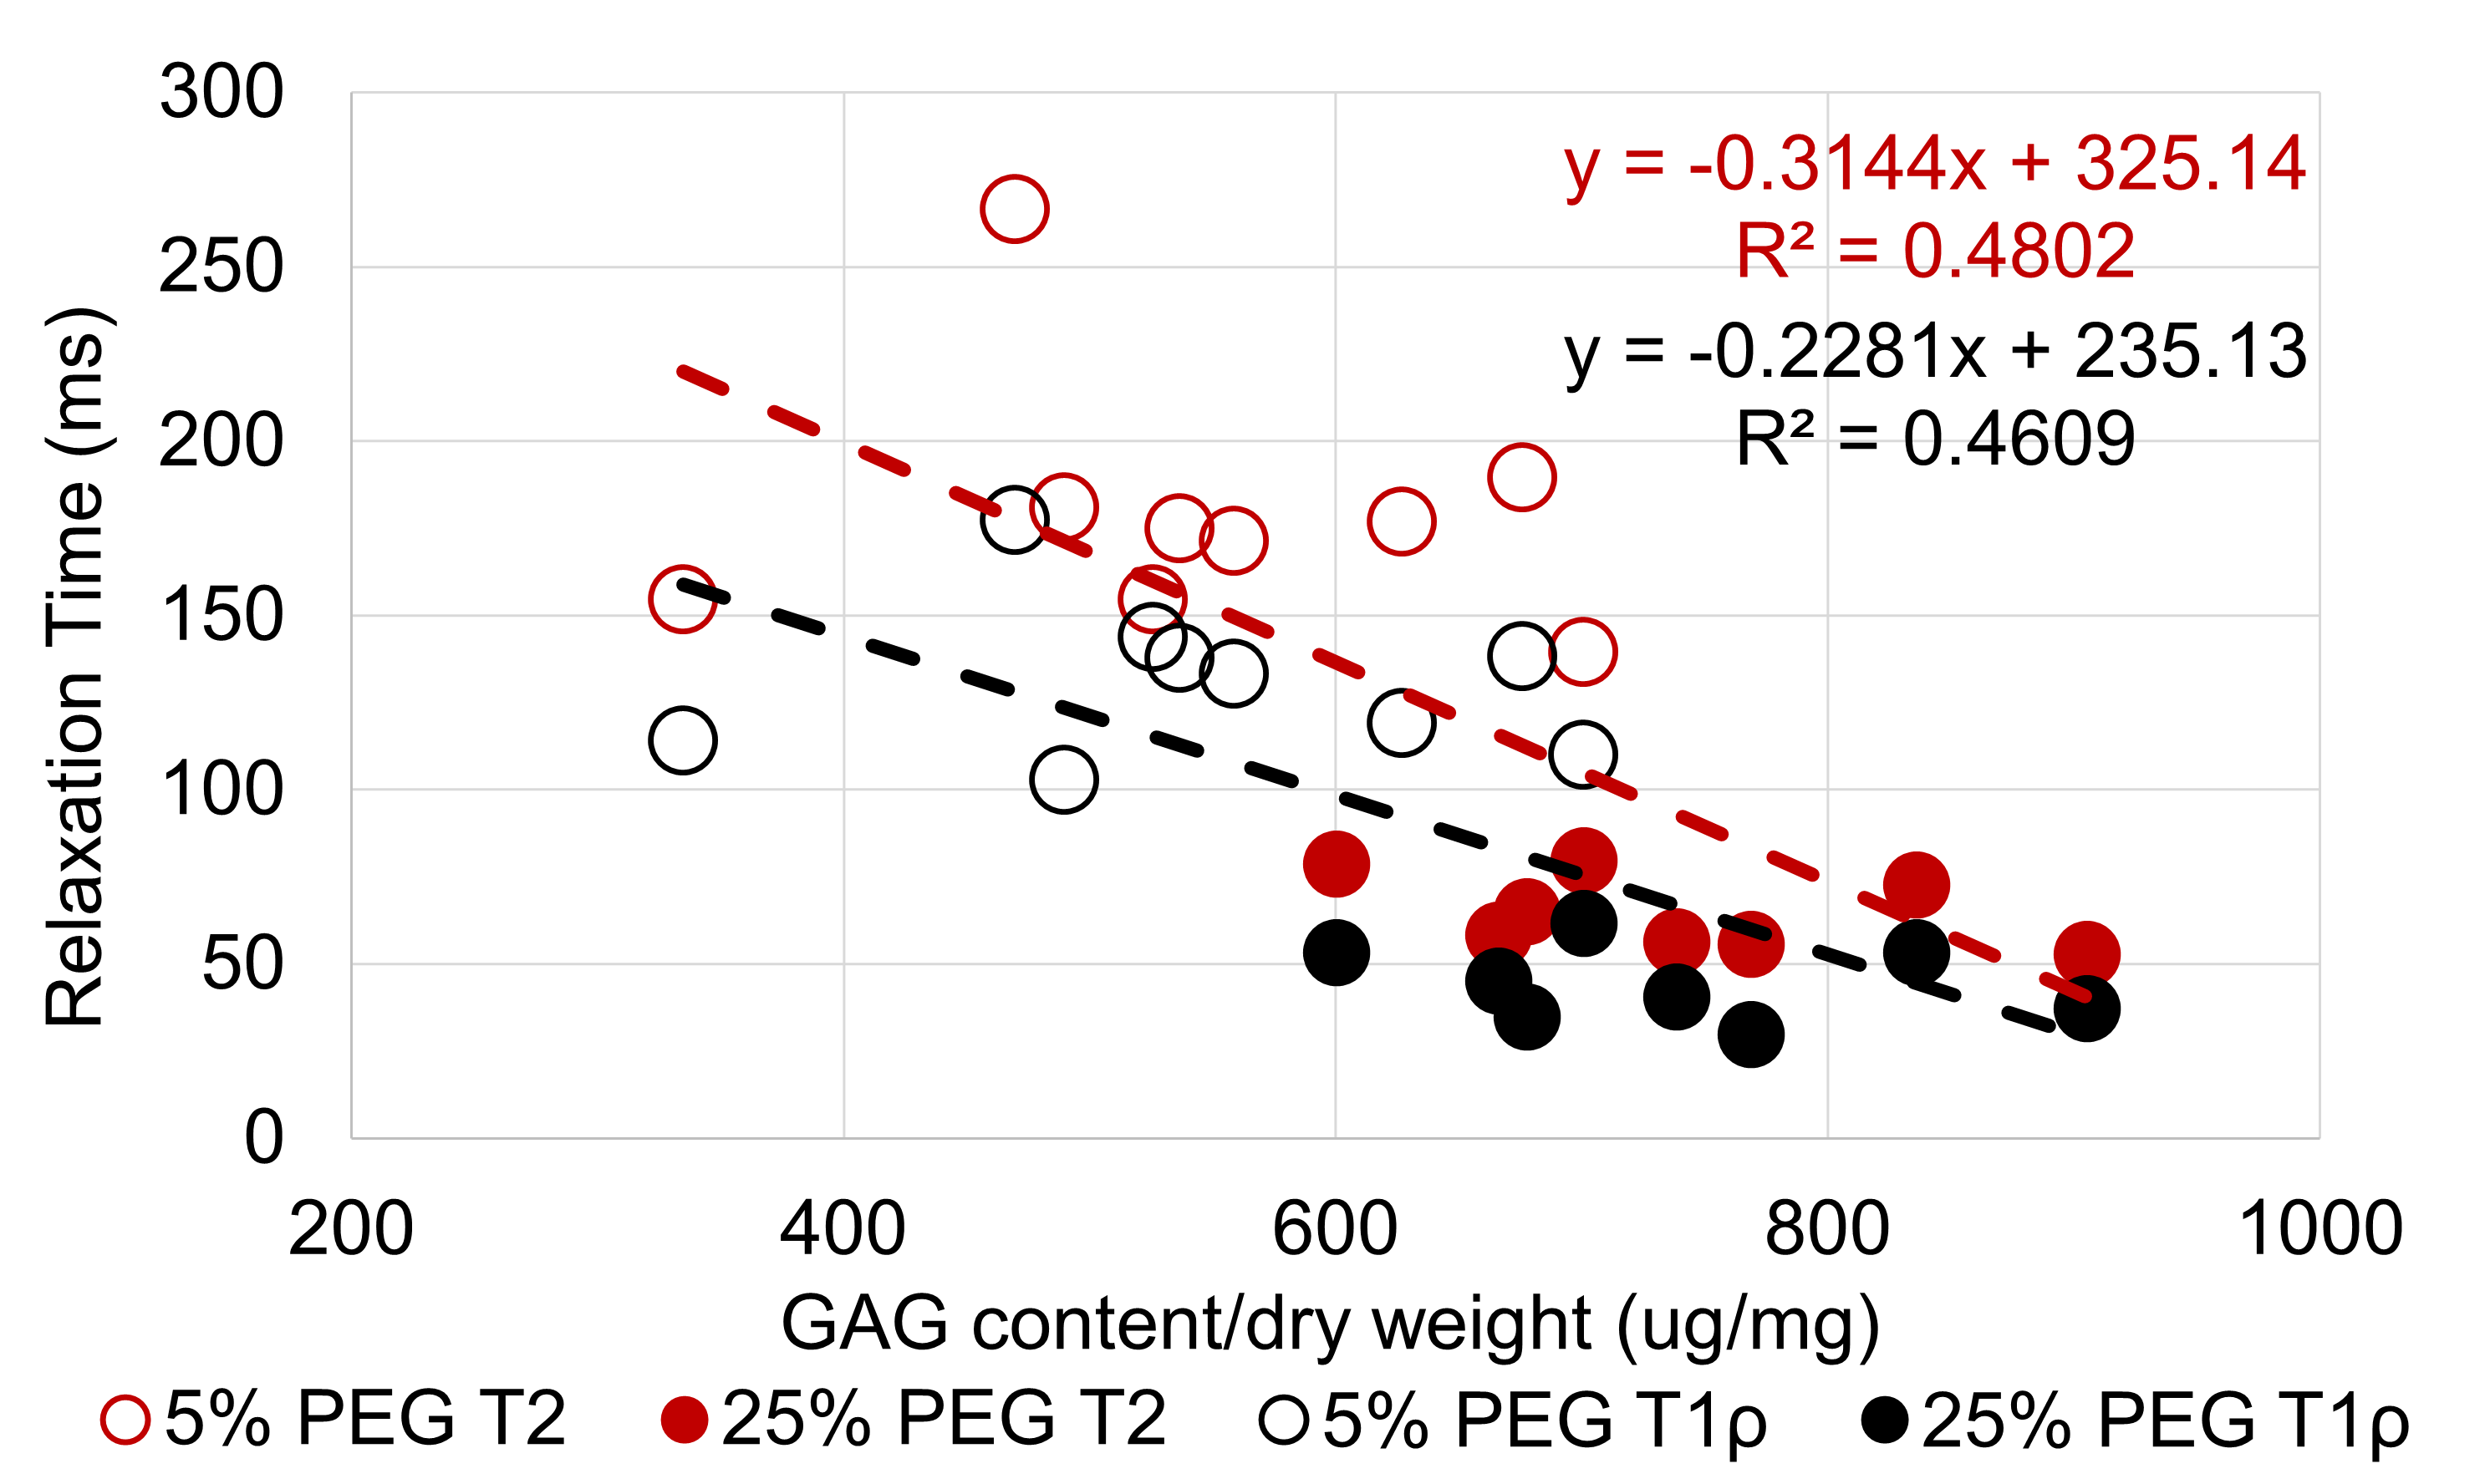
Figure 3: Correlation between GAG content and T1ρ & T2 relaxation time for the
NP region.
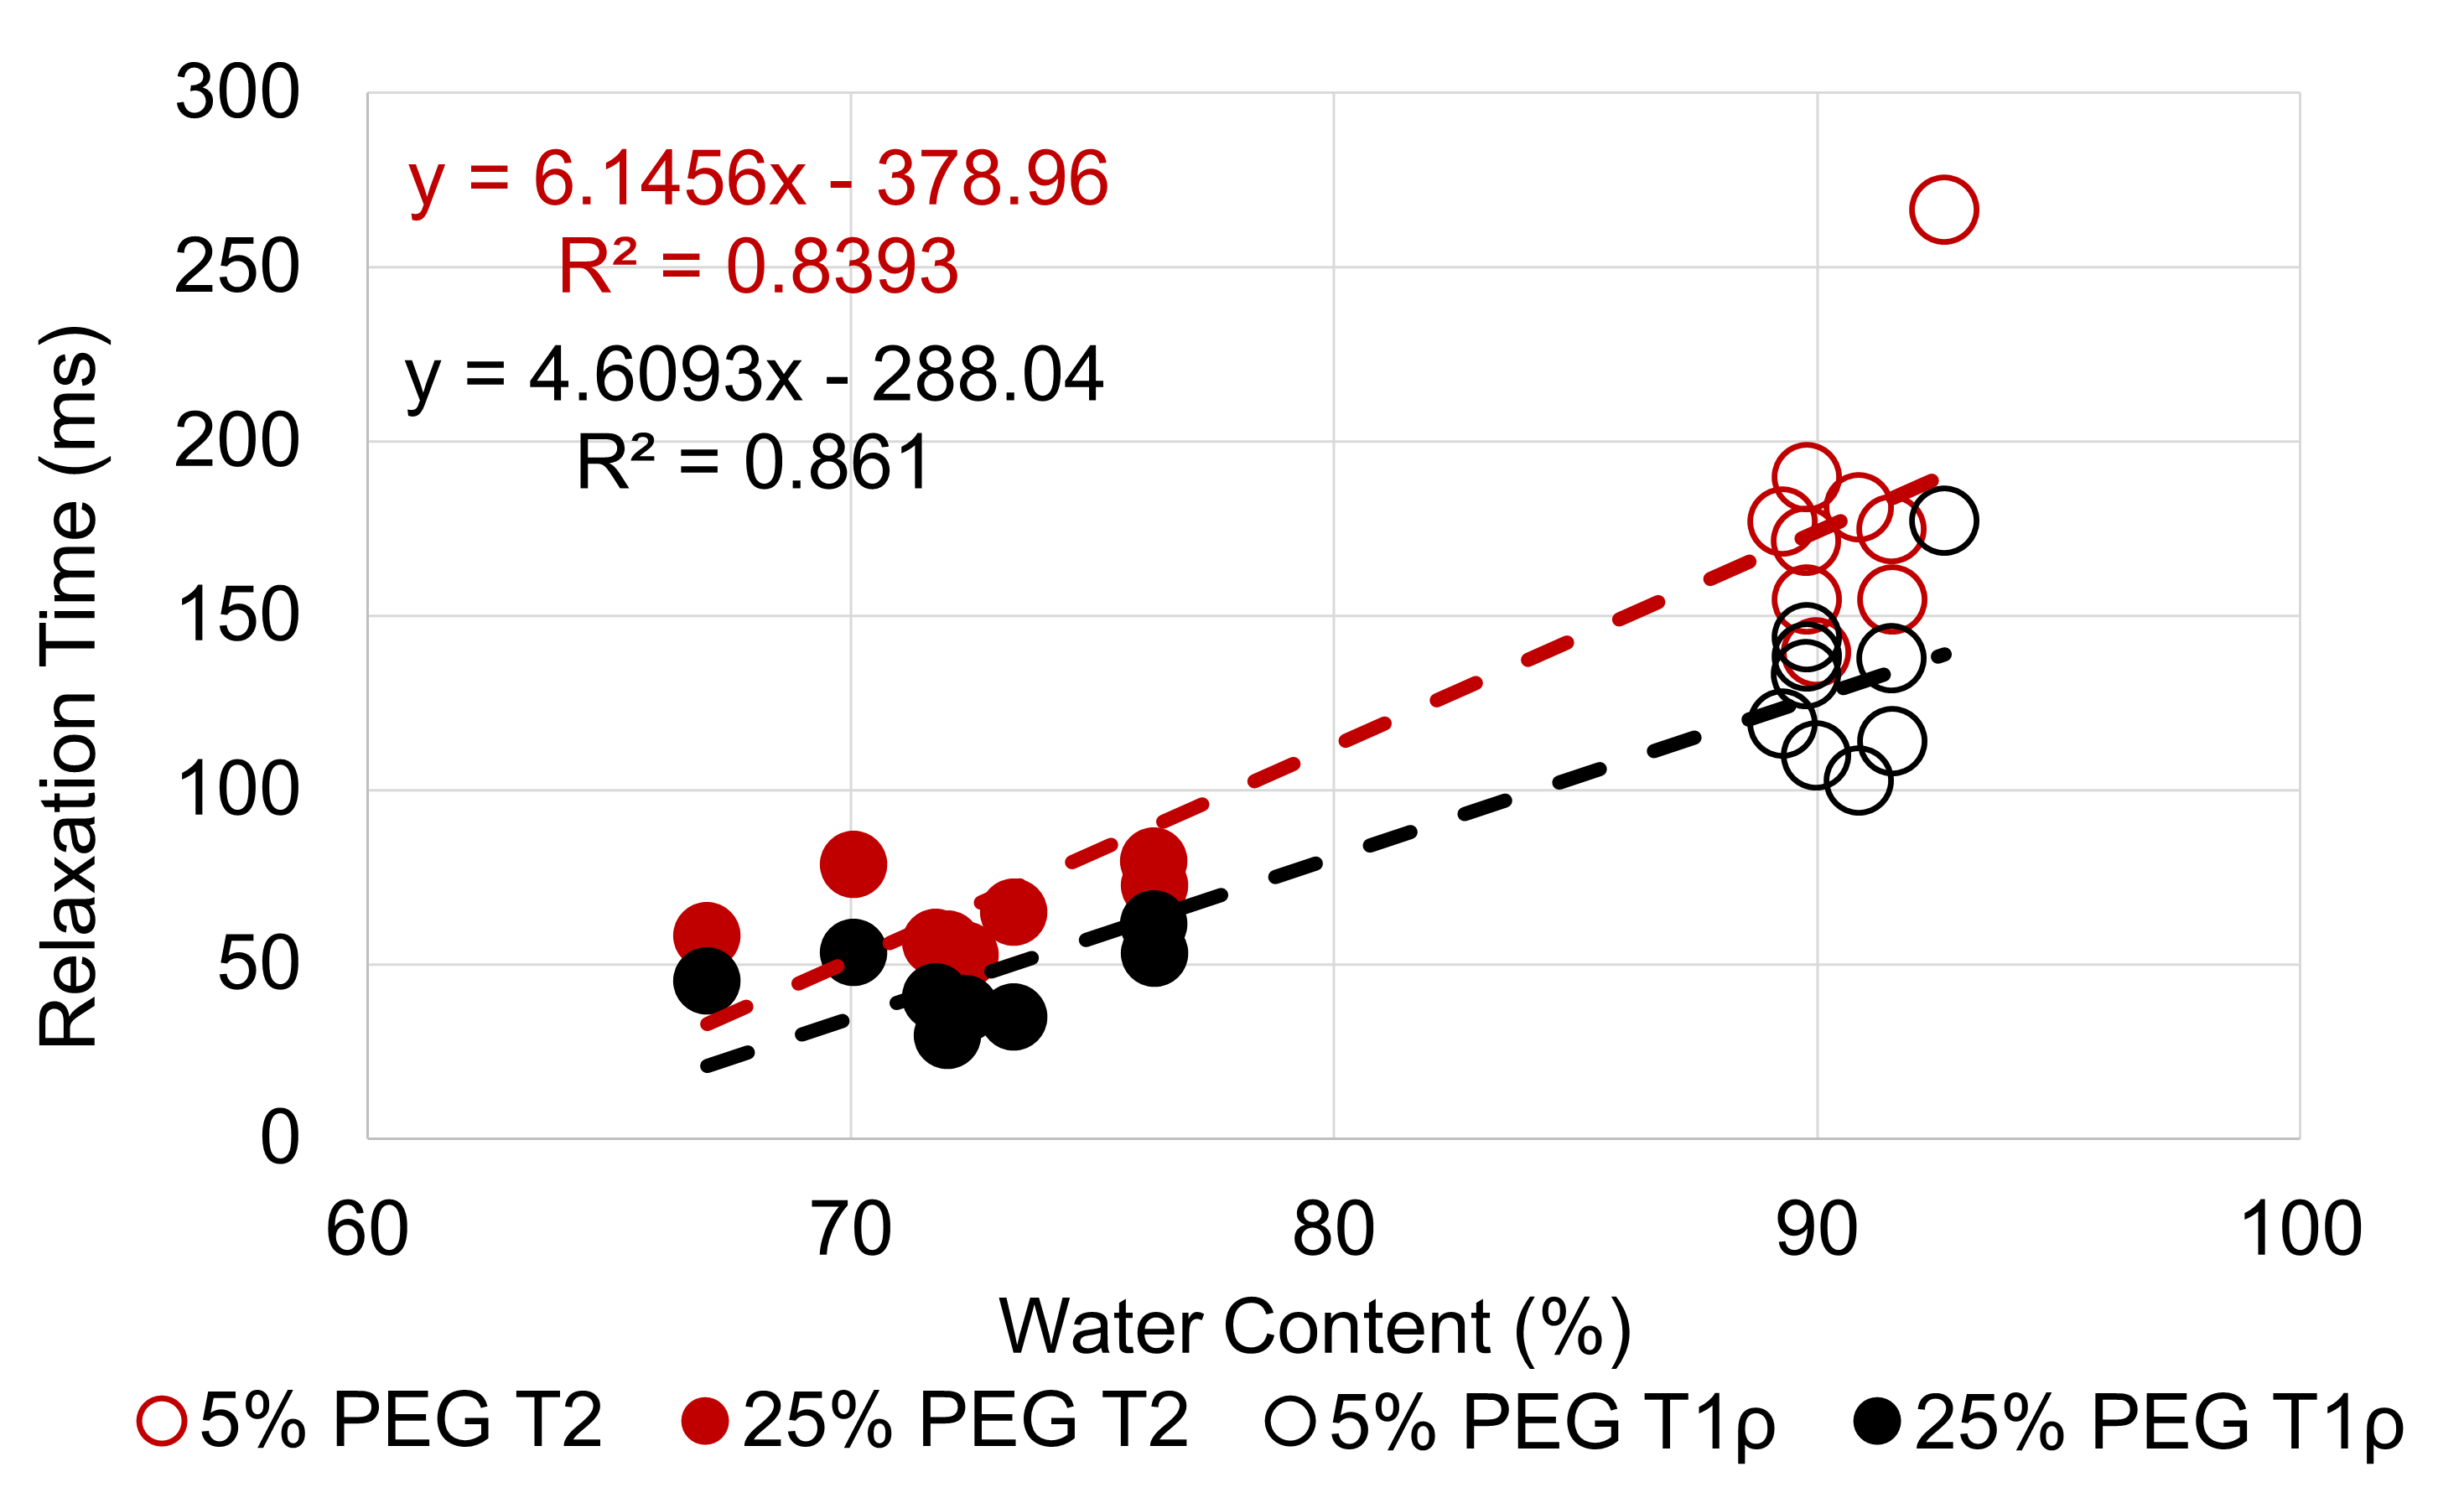
Figure 4: Correlation between water content and T1ρ & T2 relaxation time for the
NP region.
DOI: https://doi.org/10.58530/2023/2203