2201
Split spin-echo acquisition for ultrashort T2* mapping: a simulation study1School of Physics and Engineering, ITMO University, Saint Petersburg, Russian Federation
Synopsis
Keywords: Data Acquisition, Pulse Sequence Design
MRI serves as a non-invasive way of assessing the degree of iron overload. This is done via T2*-mapping commonly performed with muti-echo gradient echo sequences. This approach fails in cases with extreme iron overload where the relaxation times drop down to submillisecond range. A method allowing ultra-short T2* mapping is simulated, employing a temporal acquisition offset in a spin-echo pulse sequence. Two acquisitions are suggested: one – before the spin-echo centre, and another – after, resulting in two different T2*-weighted images, acquired with half-line radial encoding. This method allows obtaining T2*-weighted images with weightings starting effectively at zero echo time.Introduction
Iron overload is a frequent consequence of a number of systemic disorders such as anemia or thalassemia. Iron overload occurs in different body parts, including spleen, heart, and liver. MRI often serves as a non-invasive way of assessing the degree of iron overload in the selected organ. This is done via T2*-mapping commonly performed with muti-echo gradient echo sequences1. This approach fails in the cases with extreme iron overload, where the T2* relaxation times drop down to single- or sub-millisecond range2. In those cases common combinations of radiofrequency (RF) and gradient pulses can take up to a few milliseconds to produce the first detectable signal. Therefore alternative T2*-mapping methods are needed for extra-short T2* times mapping.Theory
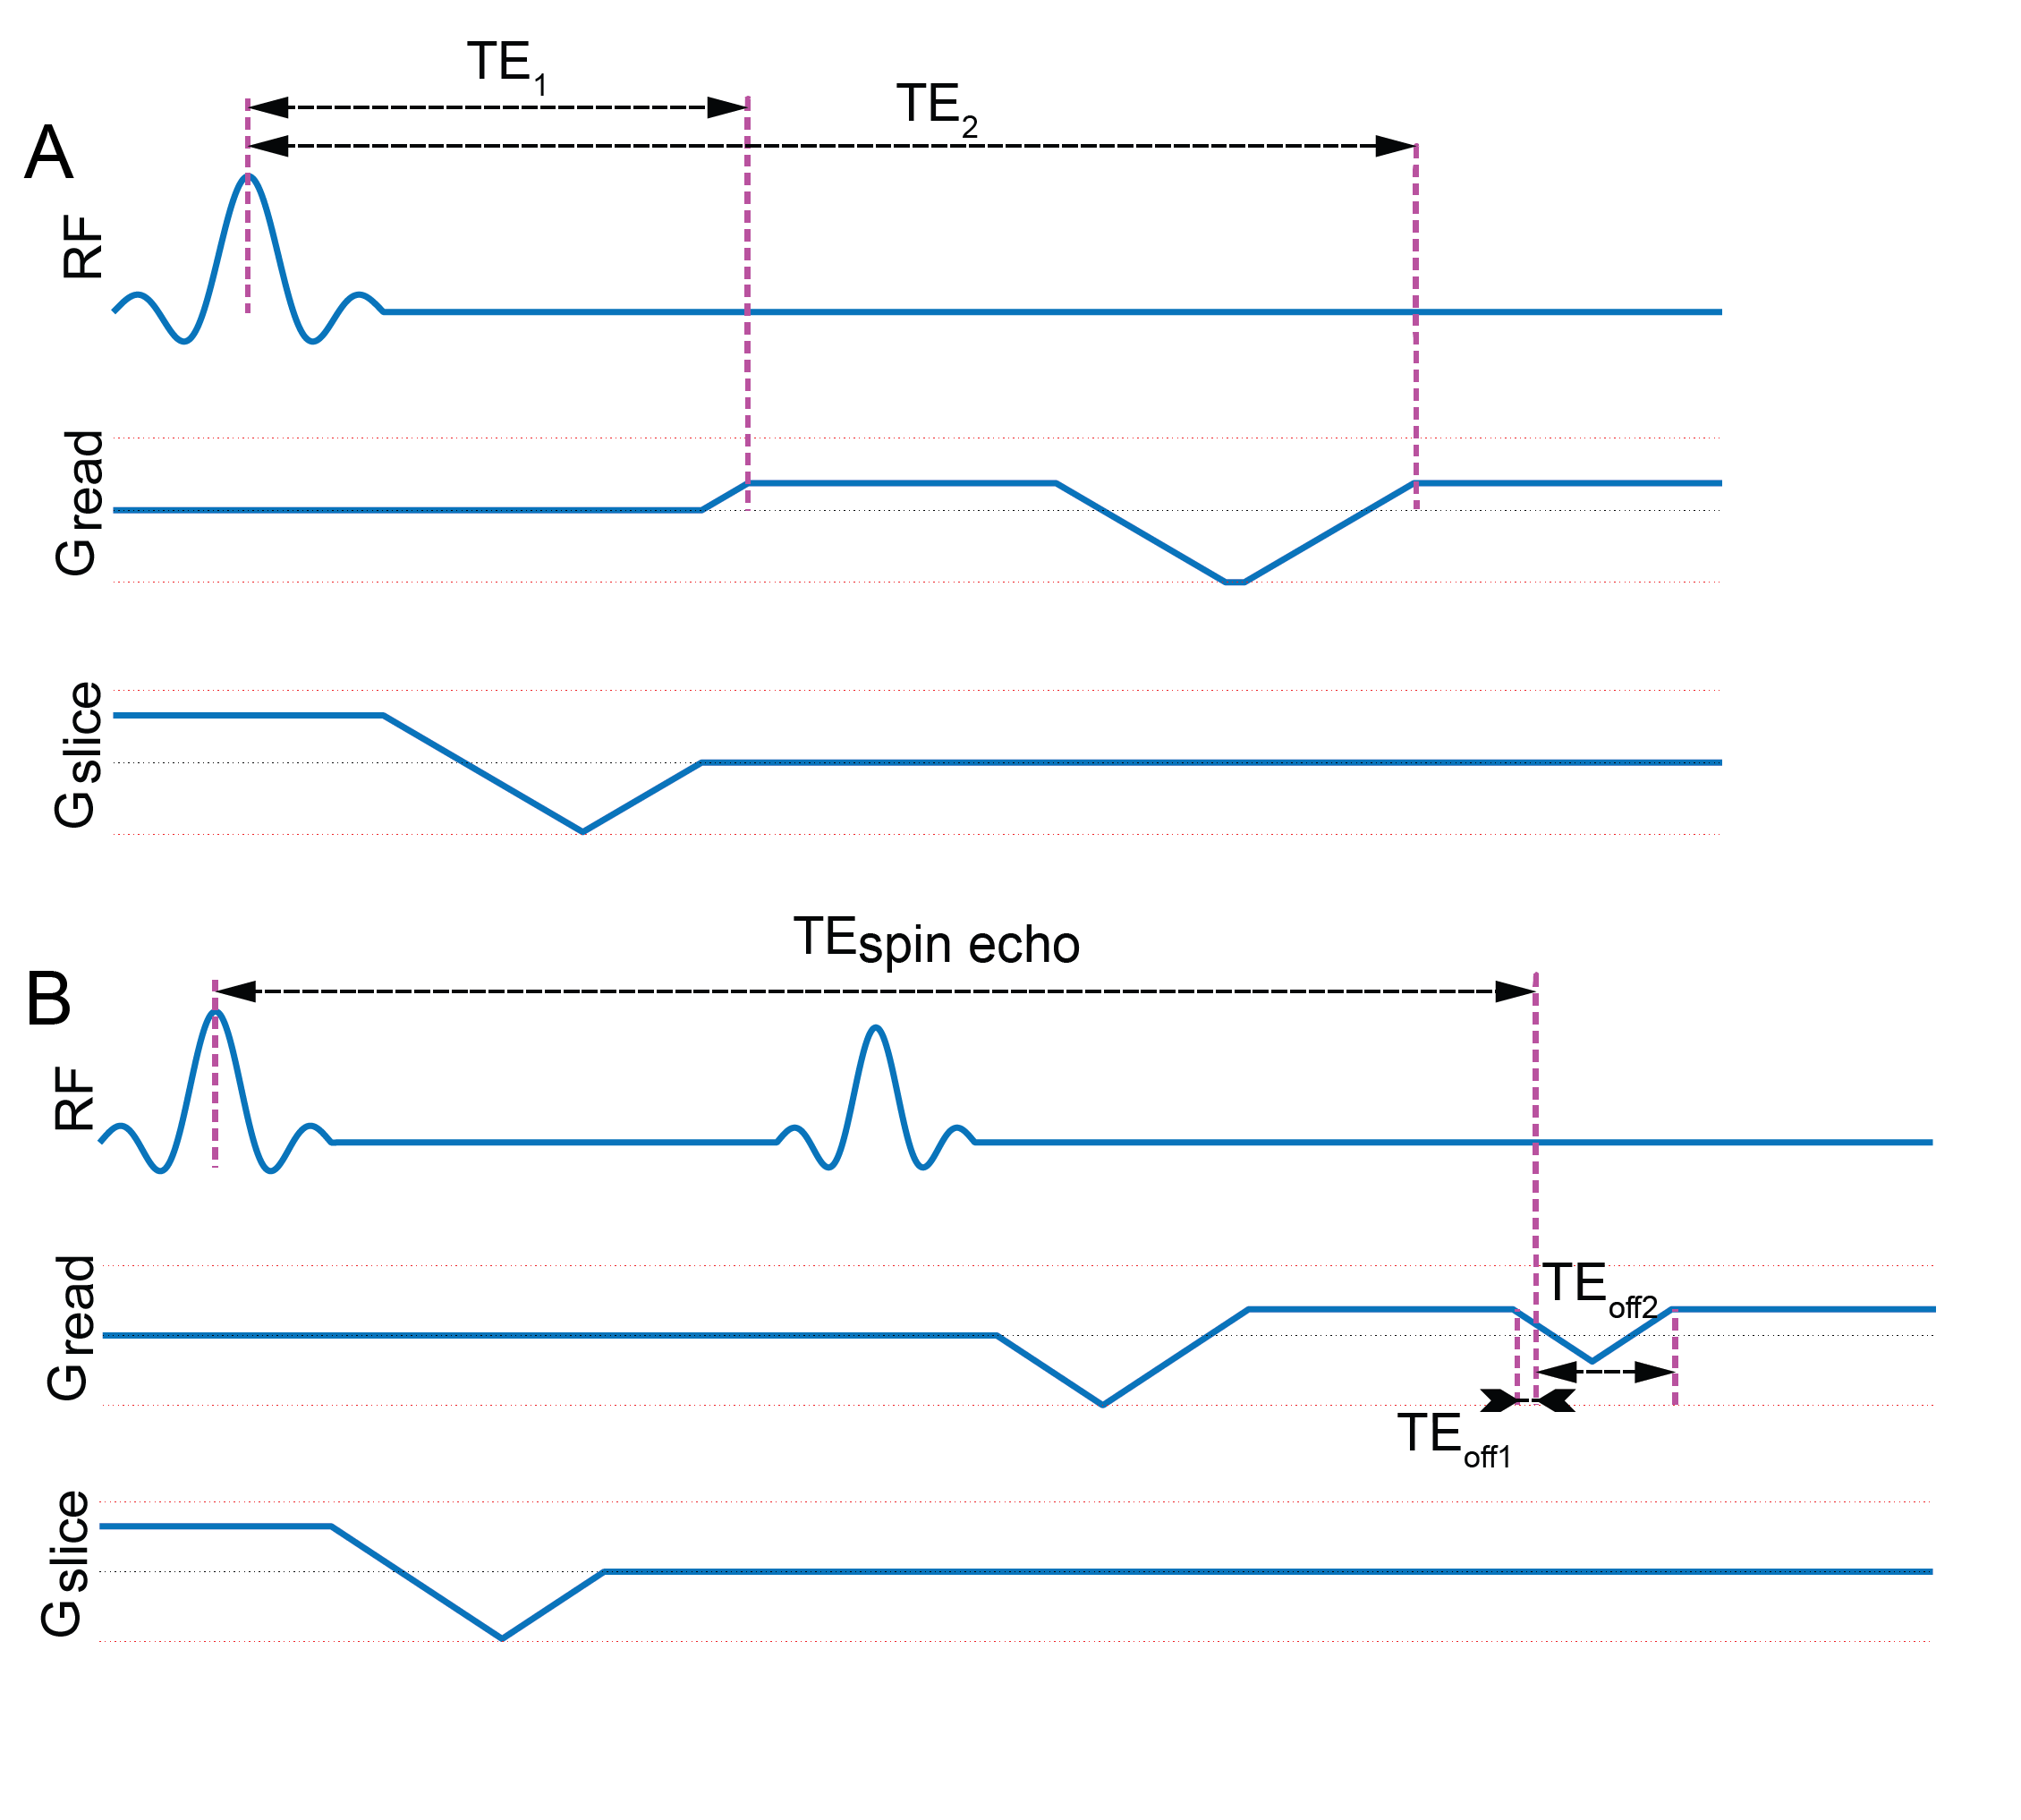
A method allowing ultra-short T2* times mapping can be constructed by employing an acquisition offset in a spin-echo pulse sequence3. While the spin-echo amplitude is T2-weighted, the echo mirrors the free induction decay and thus follows the T2* decay, the signal is thus proportional to$$e^{-\frac{TE}{T_2}}e^{-\frac{|TE_{off}|}{T_2^*}}$$
where TEoff is the time offset from the centre of the spin-echo.
The signal maximum occurs in the centre of the spin-echo far from any gradient switching and RF-pulses contrary to the classic gradient echo sequence, where the signal maximum occurs during or right after the RF-pulse. Two acquisitions can be fit under the envelope of the spin-echo (one – before, and another – after the echo maximum), resulting in two differently T2*-weighted images. A half-line radial encoding (Fig. 1, B) is suggested as an encoding scheme. This method allows acquiring T2*-weighted images with weightings starting effectively at TEoff=0.
Simulation
The sequence suggested in Fig. 1,B was tested here via Bloch simulation. The source T2* distribution for the simulations was derived from an image out of the Combined Healthy Abdominal Organ Segmentation (CHAOS) dataset4. The image intensity values were used after scaling as the source T2* values. The scaling was performed to provide mean T2* = 3 ms. over the image. Additional scaling was applied to the liver and spleen, so that the mean liver T2* became 1 ms and the mean spleen T2* bacame 0.5 ms (Fig. 2). The proton density was assumed to be uniformly distributed, as well as the T1 and the T2 relaxation time, the latter were both considered infinite for the simulation purposes.Excitation and refocusing in the SE-UTE sequence was performed with the 3-lobe sinc-shaped pulses, with flip angles of 90 and 180. The duration of the excitation pulse was chosen to be 0.8767 ms (the value found to provide shortest excitation and slice-selection gradient refocusing in the gradient echo sequence), the duration of the refocusing pulse was 0.25 ms. Gradient system parameters were selected as maximum gradient value of 80 mT m-1, gradient slew rate of 200 T m-1 s. The encoding parameters were selected to correspond to the CHAOS dataset imaging parameters (i.e., 435×435 mm2 imaging FoV, 8 mm thick slice, bandwidth of 523 Hz per pixel). The 256×256 points Cartesian encoding from the CHAOS dataset was substituted with half-line radial encoding with 128 points per spoke and 256*π ≈ 804 spokes uniformly distributed from 0 to 2π. The simulation was performed with TEspin echo = 10 ms, a list of offset TE1 from 0 to 4 ms with 0.2 ms step, and a list of offset TE2 from 0.1 to 4.1 ms with 0.2 ms step. The minimum time required for the dephasing and refocusing gradient blip between TE1 and TE2 for the desired imaging parameters was found to be 72.3 µs, therefore a 0.1 ms difference between the two acquisitions was feasible. The T2* relaxation was simulated by splitting each voxel into 301 Lorentzially distributed frequency isochromats with the full with at half maximum corresponding the desired voxel T2*.
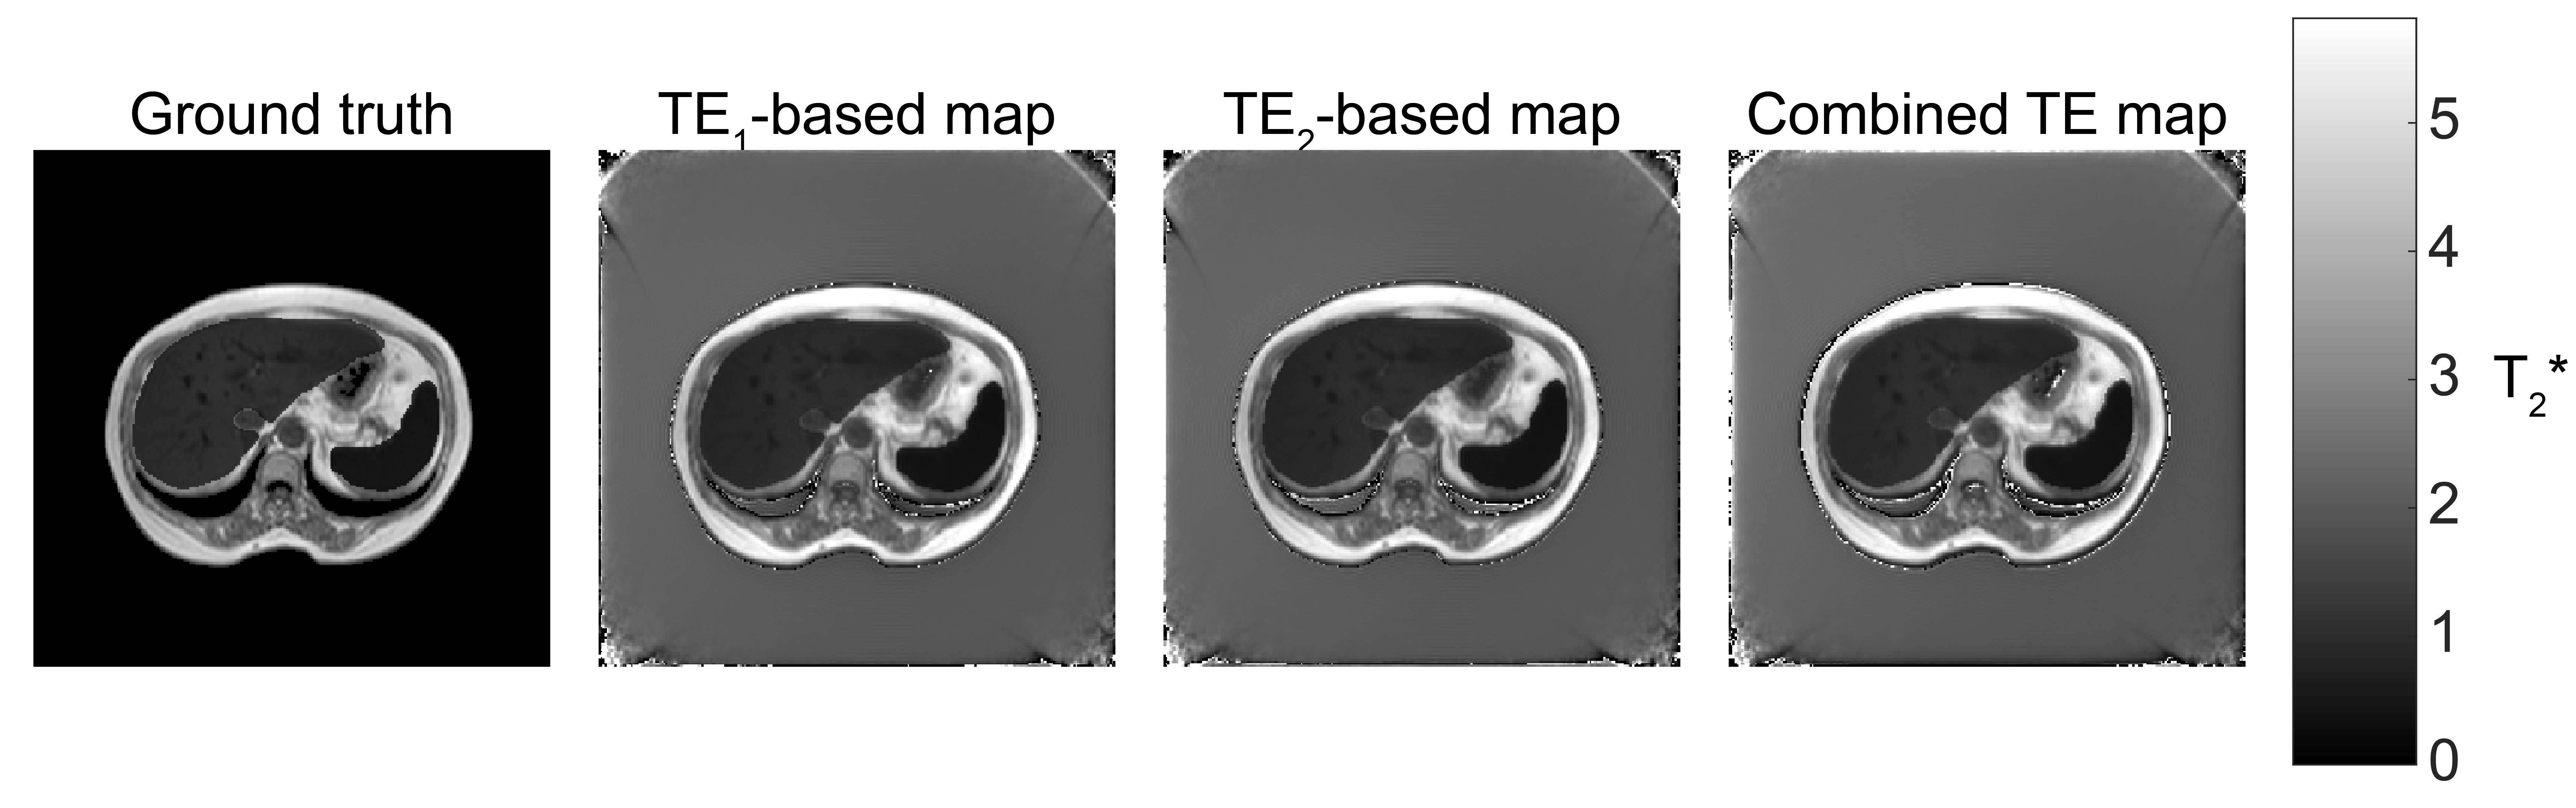
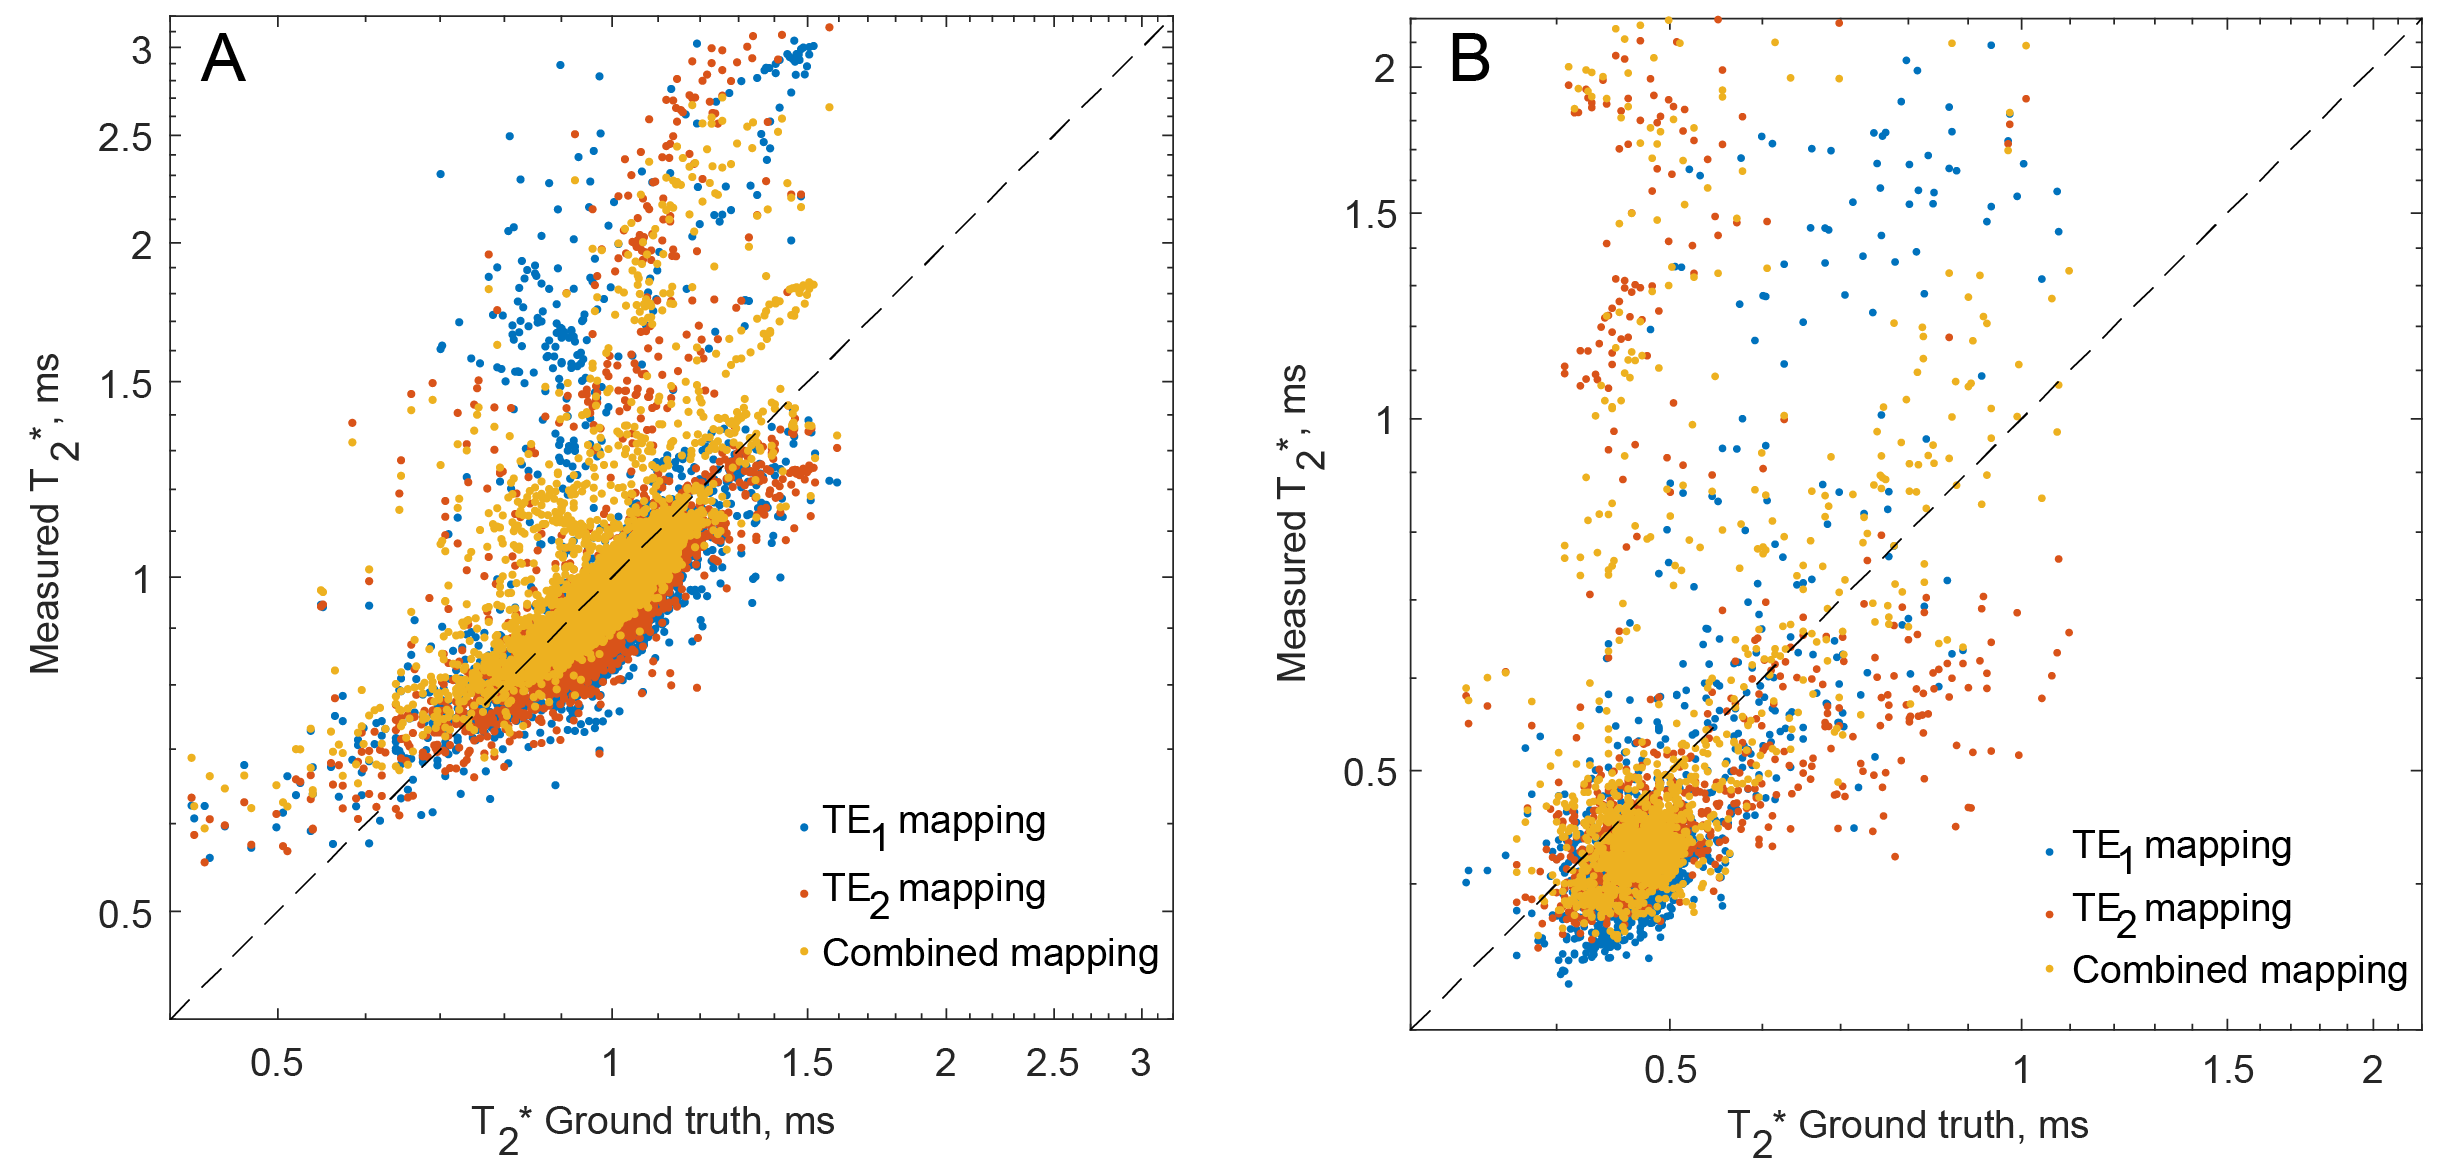
The simulated data from all the isochromats and voxels was summed to provide the complex left- and right-sided half-echo signals, corresponding to offset echo times TE1 and TE2 respectively. These were gridded to the 256×256 Cartesian k-space using convolution with a Kaiser-Bessel function kernel5. The resulting k-spaces were Fourier-transformed into images and each pixel was fit with a single-exponential decay function to obtain three T2*-maps. The three maps were ones calculated from only the images acquired at TE1, only images acquired at TE2, and maps acquired from the combined TE1 and TE2 images. The liver and the spleen relaxation times were extracted through the existing CHAOS segmentation and their distributions compared to the ground truth map.
Results
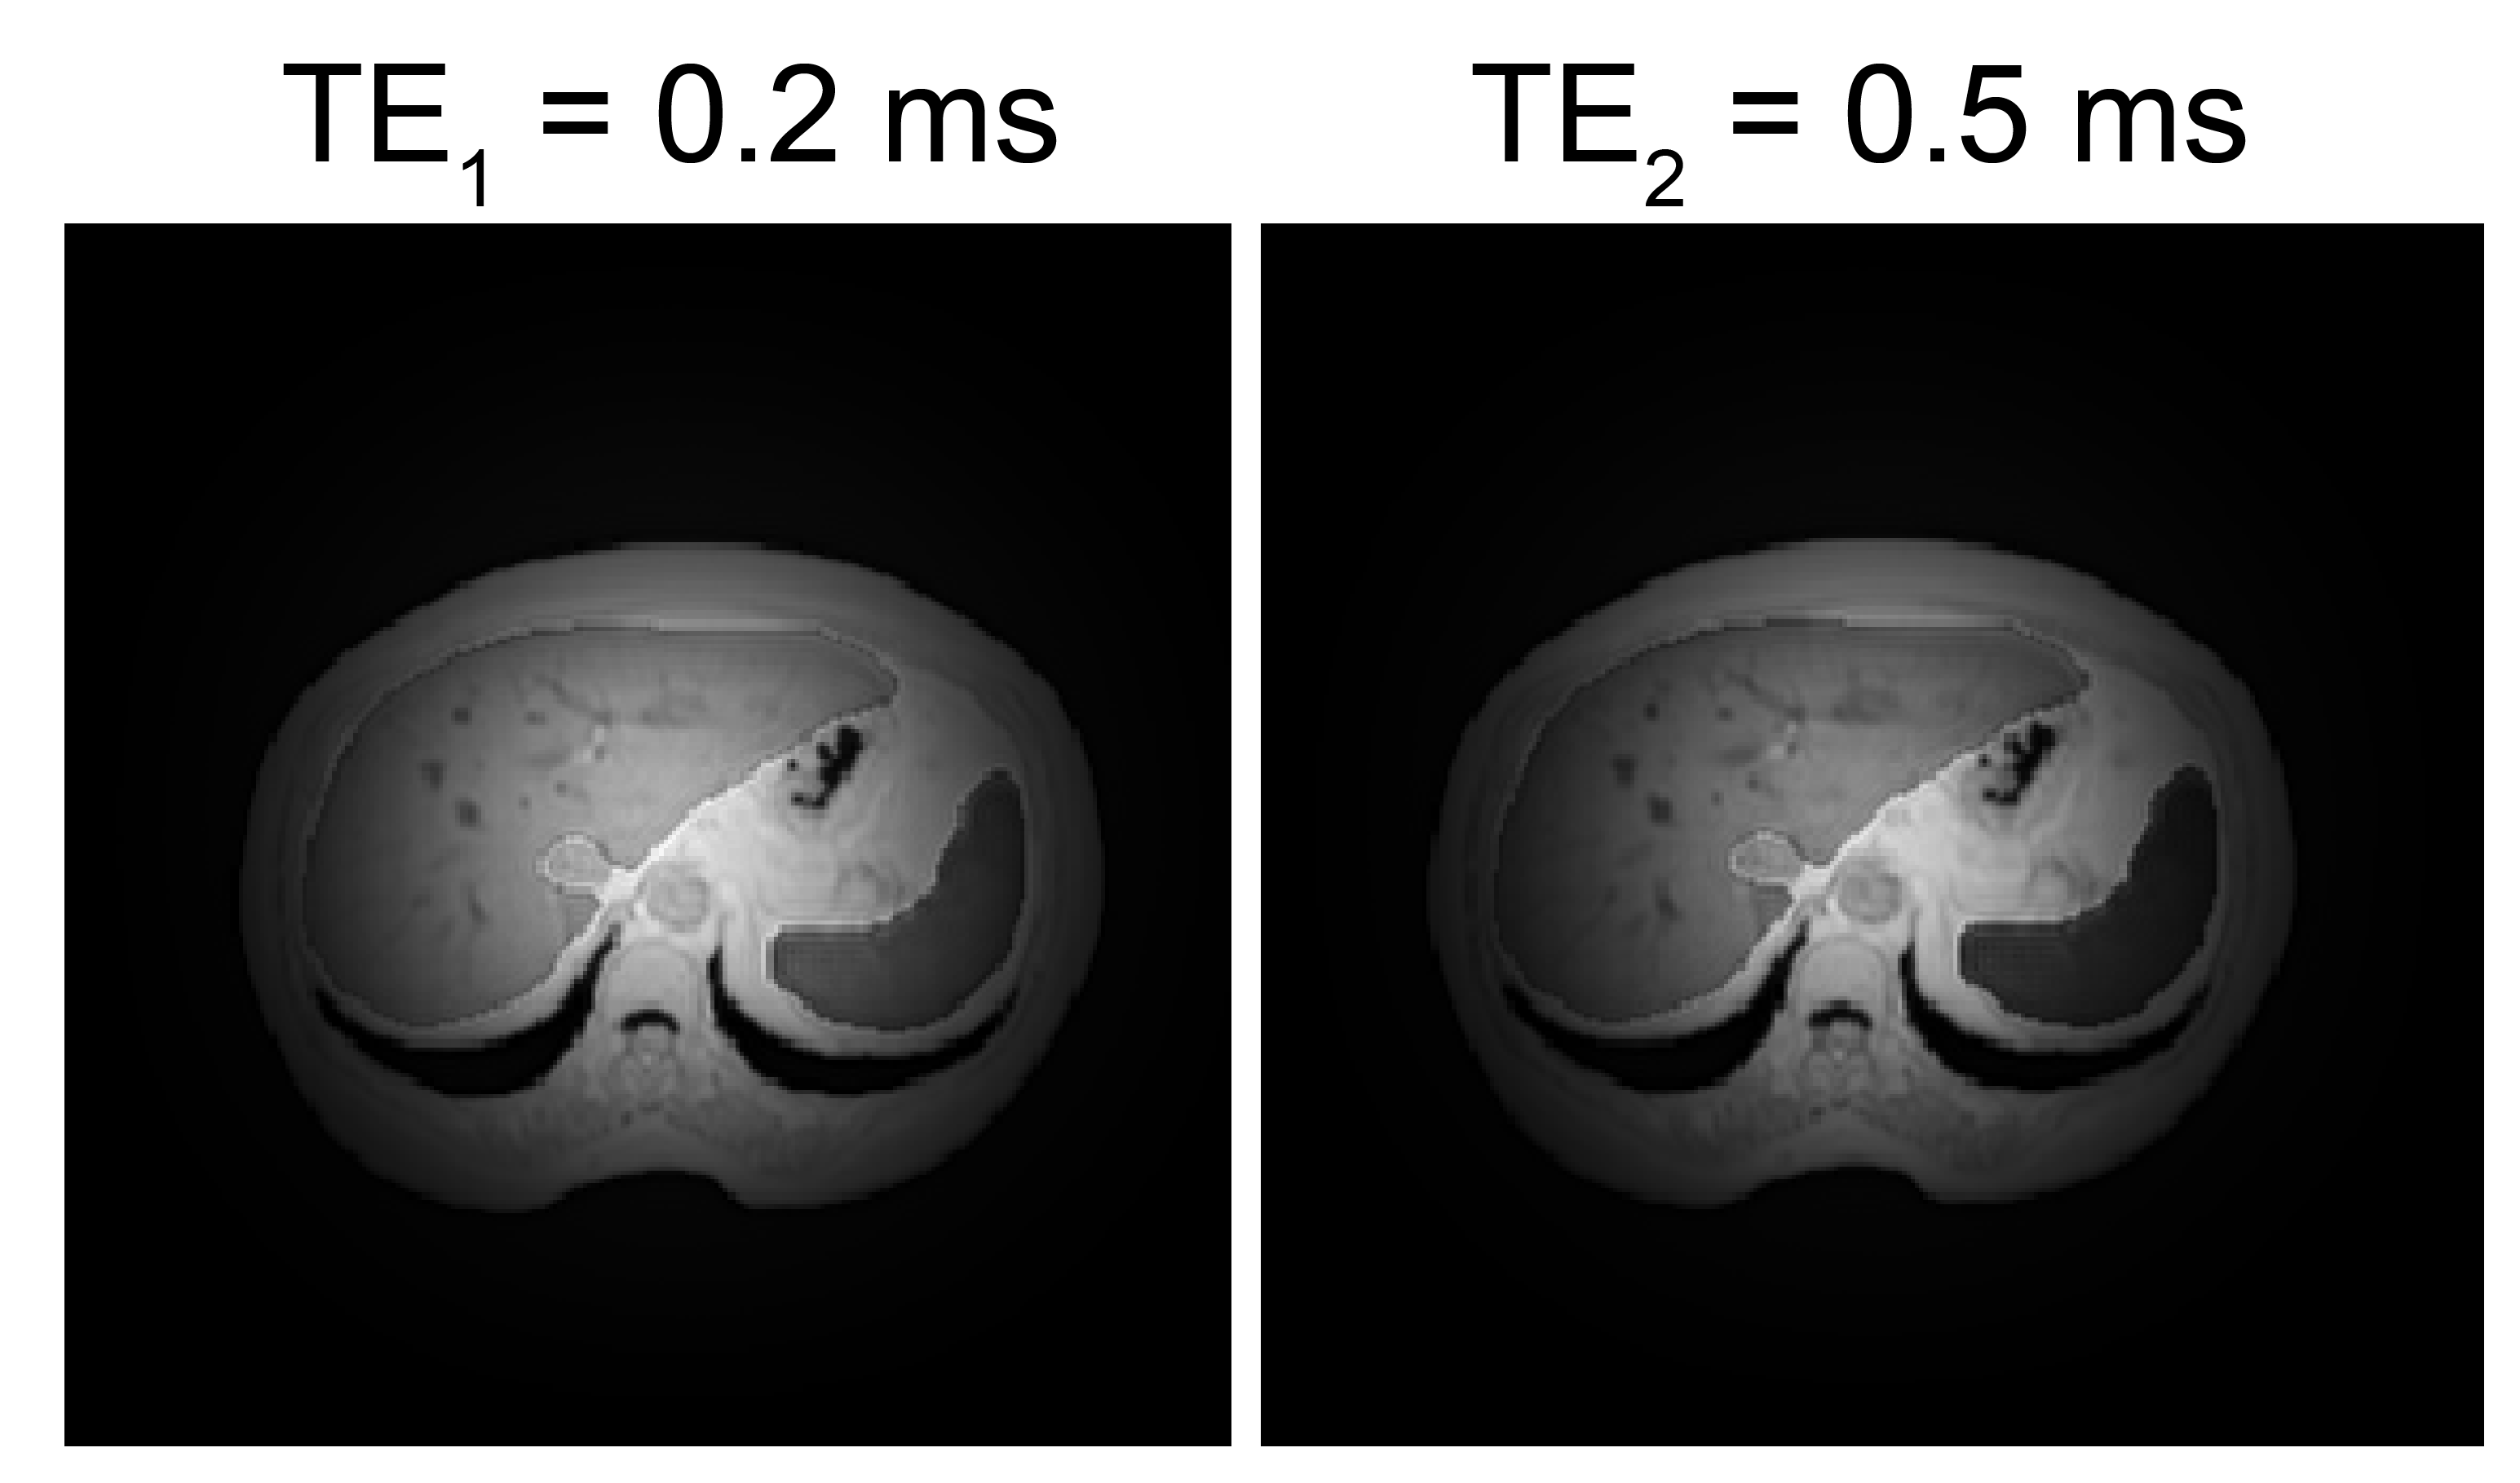
The T2*-weighted images were successfully reconstructed from the simulated radial encoding data without significant artifacts: only small intensity drop on the image edges was present, related to the radial encoding and gridding procedures (Fig. 3). The T2* decays in all three fits (TE1, TE2 and combined) were single-exponential and were able to provide millisecond-order and submillisecond order T2*-mapping (Fig. 2 and Fig. 4).Conclusion
A spin-echo pulse sequence with two off-center semi-echo acquisitions was proposed here for ultra-short T2* measurements. The abdominal image acquisition was simulated with the proposed sequence and data for T2* relaxation measurements was acquired. T2* relaxation maps were calculated and were found to largely correspond to the simulation ground truth.Acknowledgements
The work was supported by the Ministry of Science and Higher Education of the Russian Federation (075-15-2021-592).References
1. Tang MY, Chen TW, Zhang XM, et al. GRE T2 * -weighted MRI: Principles and clinical applications. BioMed Research International. 2014;2014:1–12.
2. Labranche R, Gilbert G, Cerny M, et al. Liver Iron Quantification with MR Imaging: A Primer for Radiologists. RadioGraphics. 2018;38(2):392–412.
3. Bernstein MA, King KF, Zhou ZJ. Handbook of MRI pulse sequences. Amsterdam: Academic Press; 2004.
4. Kavur AE, Gezer NS, Barış M, et al. CHAOS Challenge - combined (CT-MR) healthy abdominal organ segmentation. Medical Image Analysis. 2021;69:101950.
5. Jackson JI, Meyer CH, Nishimura DG, et al. Selection of a convolution function for Fourier inversion using gridding (computerised tomography application). IEEE Transactions on Medical Imaging. 1991;10(3):473–8.
Figures