2196
Snapshot CEST at 3T using 3D True FISP
Yupeng Wu1, Zhichao Wang2, Qifan Pang1, Gaiying Li1, Mengying Chen1, Xu Yan3, Caixia Fu4, Yang Song3, and Jianqi Li1
1Shanghai key lab of magnetic resonance, East China Normal University, Shanghai, China, 2Zhejiang Lab, Hangzhou, China, 3MR Scientific Marketing, Siemens Healthineers, Shanghai, China, 4MR Application Development, Siemens Shenzhen Magnetic Resonance Ltd, Shenzhen, China
1Shanghai key lab of magnetic resonance, East China Normal University, Shanghai, China, 2Zhejiang Lab, Hangzhou, China, 3MR Scientific Marketing, Siemens Healthineers, Shanghai, China, 4MR Application Development, Siemens Shenzhen Magnetic Resonance Ltd, Shenzhen, China
Synopsis
Keywords: Pulse Sequence Design, CEST & MT, GRE FLASH TrueFISP
For clinical implementation, chemical exchange saturation transfer (CEST) imaging must be fast with high signal‐to‐noise ratio (SNR), 3D coverage, and produce robust contrast. In general, CEST imaging with fast low angle shot GRE sequence (FLASH) can achieve fast acquisition, but may yield low SNR efficiency. This study evaluated APT and NOE maps for single saturation 3D CEST imaging with True FISP and FLASH sequences, respectively. We found that True FISP could achieve better SNR of Z-spectrum and obtain more reliable CEST effects contrast. 3D True FISP sequence is expected to become a more promising 3D CEST-GRE sequence for clinical application.Introduction
Chemical exchange saturation transfer (CEST) allows for indirect detection of diluted molecules by their saturation transfer to the abundant water pool such as peptides and proteins, glutamate, and glucose derivatives1,2. Spatial correlations between isolated amide CEST and gadolinium ring enhancement have been reported3. Changes in nuclear Overhauser enhancement (NOE) were also shown to correlate with histology and be a measure for brain tumor therapy response4. Many previously published applications of CEST evaluated Z‐spectrum asymmetry (MTRasym) to identify CEST contrast while removing direct water saturation effects5. MTRasym approaches can be performed with a limited number of scans and are therefore relatively fast, which can be performed clinically in 3D whole brain. But MTRasym can not separate APT and NOE effects. In order to obtain reliable CEST comparison, it is often necessary to collect dozens of frequency offset points to form the Z-spectrum.To this end, various fast readout sequences have been deployed, such as TSE6, EPI7 and GRE8. The TSE CEST sequence yields high image quality with minimal artifacts, but it is relatively slow and suffers from a relatively high SAR. Fast imaging with EPI readout yields superior acquisition efficiency9,10, however, it suffers from susceptibility-related image distortion and ghosting artifacts from lipid signals, which may interfere with CEST imaging. It has been proposed to use single saturation 3D fast low angle shot GRE (FLASH) for rapid sampling11,12.FLASH can achieve faster acquisition than TSE CEST with relatively low SAR, but may yield lower SNR efficiency. True FISP sequence can achieve higher SNR than FLASH at the same spatial and temporal resolution, so the purpose of this study is to verify that True FISP can collect Z-spectrum with better SNR and achieve more reliable CEST comparison.
Methods
Imaging was performed on a 3T whole‐body MRI system (MAGNETOM Prisma; Siemens Healthcare, Erlangen, Germany) on 5 healthy volunteers. The vendor’s Head/Neck 64-channel coil was used for signal reception.The CEST sequence consisted of a presaturation module followed by a gradient echo readout using centric spiral reordering (Figure 1). The presaturation module consisted of a train of 28 Gaussian‐shaped RF pulses with pulse time tpulse= 100 ms, and B1,mean= 0.6 µT. After each train of CEST saturation pulses, a crusher gradient was applied to destroy residual transversal magnetization. At the end of CEST saturation module, fat saturation was applied, resulting in total saturation time tSat = 3 seconds. Z‐spectrum data were obtained after saturation at 55 irradiation frequency offsets: two –300 ppm for unsaturated reference images, ±50 ppm, ±35 ppm, ±20 to ±11 ppm in steps of 3 ppm, -10 to 10 ppm in steps of 0.5 ppm. The imaging parameters were field of view = 220 × 180 × 90 mm3, matrix size = 128 × 104 × 18, voxel size = 1.7 × 1.7 × 5 mm3, TR = 3.6 ms, TE = 1.8 ms, flip angle = 6 ° (FLASH sequence) or 26 ° (True FISP sequence), bandwidth = 700 Hz/pixel. These settings resulted in a readout time of tRO = 2.2 seconds. Recovery time after each acquisition was tRe = 0.6 seconds. The acquisition time of each offset was TA = tSat+tRO+ tRe = 5.8 seconds. A generalized auto-calibrating partially parallel acquisition (GRAPPA) with an acceleration factor of 2 in the right-left direction and elliptical sampling were used to reduce acquisition time. For 55 irradiation frequency offsets, the total scanning time of Z-spectrum was about 5.5 minutes.
Neural network fitting was used to fit Z-spectrum to obtain images of APT and NOE effects13.
The standard deviation of the difference between the fitted Z-spectrum and the collected Z-spectrum far from the CEST effects was used to measure the noise of the Z-spectrum. The smaller the standard deviation is, the lower the noise of Z-spectrum is.
Results
Figure 2 shows the APT, NOE effects, Z-spectrum noise maps of a healthy volunteer collected by True FISP and FLASH sequences. Compared with FLASH sequence, the APT and NOE effects maps collected by True FISP sequence show a more obvious contrast of gray white matter in the brain. It can be seen that the noise of Z-spectrum collected by True FISP was obviously smaller than FLASH.Figure 3 shows the mean noise of Z-spectrum in 9th slice of each volunteer, which demonstrates that the noise of Z-spectrum collected by True FISP was significantly reduced compared with FLASH.
Discussion
In this study, we used 3D True FISP and 3D FLASH sequences to collect Z-spectrum. The two acquisition methods used the same saturation mode, acquisition time and spatial resolution. The results show that 3D True FISP sequence can collect Z-spectrum with better SNR compared with 3D FLASH sequence. This study is only a preliminary result, parameter optimization and clinical application evaluation are required in the future study.Conclusion
In conclusion, True FISP sequence produces more reliable CEST comparison, thus is more suitable for 3D CEST-GRE acquisition than FLASH.Acknowledgements
No acknowledgement found.References
1. Forsen S, Hoffman RA. Study of moderately rapid chemical exchange reactions by means of nuclear magnetic double resonance. J Chem Phys. 1963;39:2892-2901.2. Ward K, Aletras A, Balaban R. A new class of contrast agents for MRI based on proton chemical exchange dependent saturation transfer (CEST). J Magn Reson. 2000;143:79-87.
3. Zaiss M, Windschuh J, Paech D, et al. Relaxation‐compensated CEST‐MRI of the human brain at 7T: unbiased insight into NOE and amide signal changes in human glioblastoma. NeuroImage. 2015;112:180–188.
4. Meissner JE, Regnery S, Korozowski A, et al. NOE‐mediated CEST imaging of glioma at 7 Tesla aids early response evaluation of patients undergoing radio‐chemotherapy. In: Proceedings of the Joint Annual Meeting ISMRM‐ESMRMB, Paris, France, 2018. p. 408.
5. Zhu H, Jones CK, van Zijl PC, et al. Fast 3D chemical exchange saturation transfer (CEST) imaging of the human brain. Magn Reson Med. 2010;64:638–644.
6. Zhao X, Wen Z, Zhang G, et al. Three-dimensional turbo-spin-echo amide proton transfer MR imaging at 3-Tesla and its application to high-gradehuman brain tumors. Mol Imaging Biol. 2013;15(1):114-122.
7. Mueller S, Stirnberg R, Akbey S, et al. Whole brain snapshot CEST at 3T using 3D-EPI: Aiming for speed, volume, and homogeneity. Magn Reson Med.2020;84(5):2469-2483.
8. Mougin OE, Coxon RC, Pitiot A, et al. Magnetization transfer phenomenon in the human brain at 7 T. Neuroimage. 2010;49(1):272-281.
9. Akbey S, Ehses P, Stirnberg R, et al. Whole-brain snapshot CEST imaging at 7 T using 3D-EPI. Magn Reson Med. 2019;82(5):1741-1752.
10. Huang J, Zhang M, Lu J, et al. A fast chemical exchange saturation transfer imaging scheme based on single-shot spatiotemporal encoding. Magn Reson Med. 2017;77(5):1786-1796.
11. Deshmane A, Zaiss M, Lindig T, et al. 3D gradient echo snapshot CEST MRI with low power saturation for human studies at 3T. Magn Reson Med. 2019;81(4):2412-2423.
12. Zaiss M, Ehses P, Scheffler K. Snapshot‐CEST: optimizing spiral‐centric‐reordered gradient echo acquisition for fast and robust 3D CEST MRI at 9.4 T. NMR Biomed. 2018;31:e3879.
13. Wang Z, Zhao Y, Yan X, et al. CEST imaging with neural network fitting of the human brain at 3T. 29th ISMRM Conference, 2021;3708.
Figures
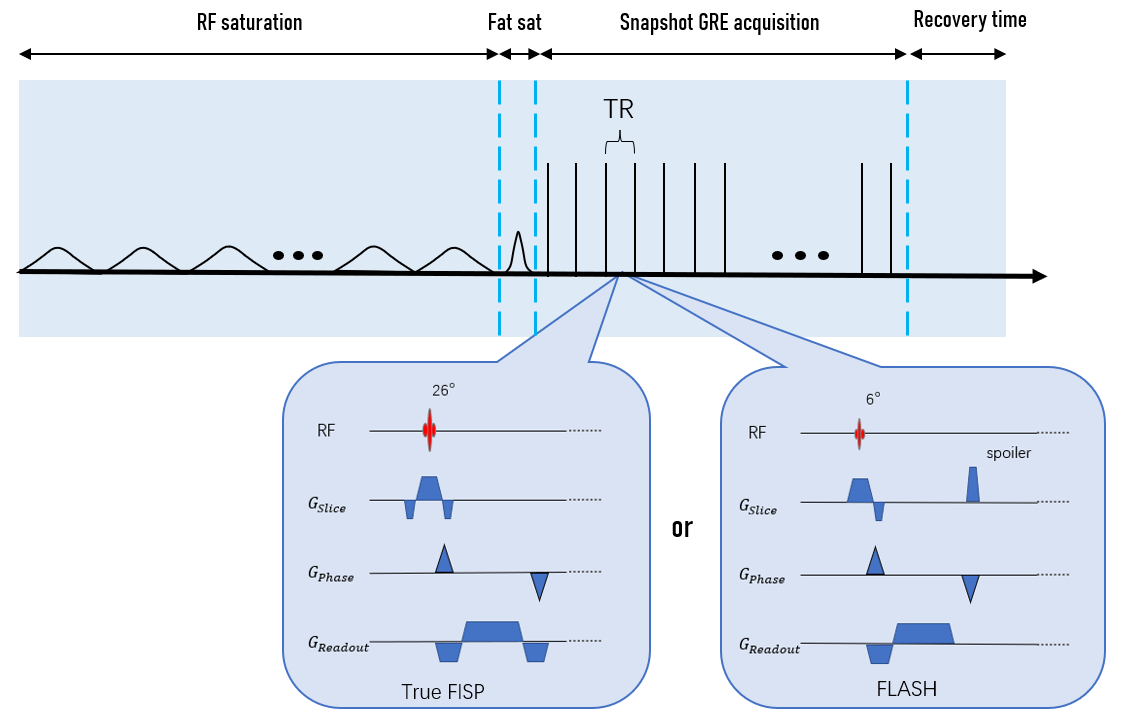
Figure 1 A schematic diagram of the whole-brain 3D CEST-GRE MRI sequence. The pulse sequence consists of a train of Gauss RF pulses for CEST saturation, a fat saturation RF pulse, and 3D GRE imaging module.
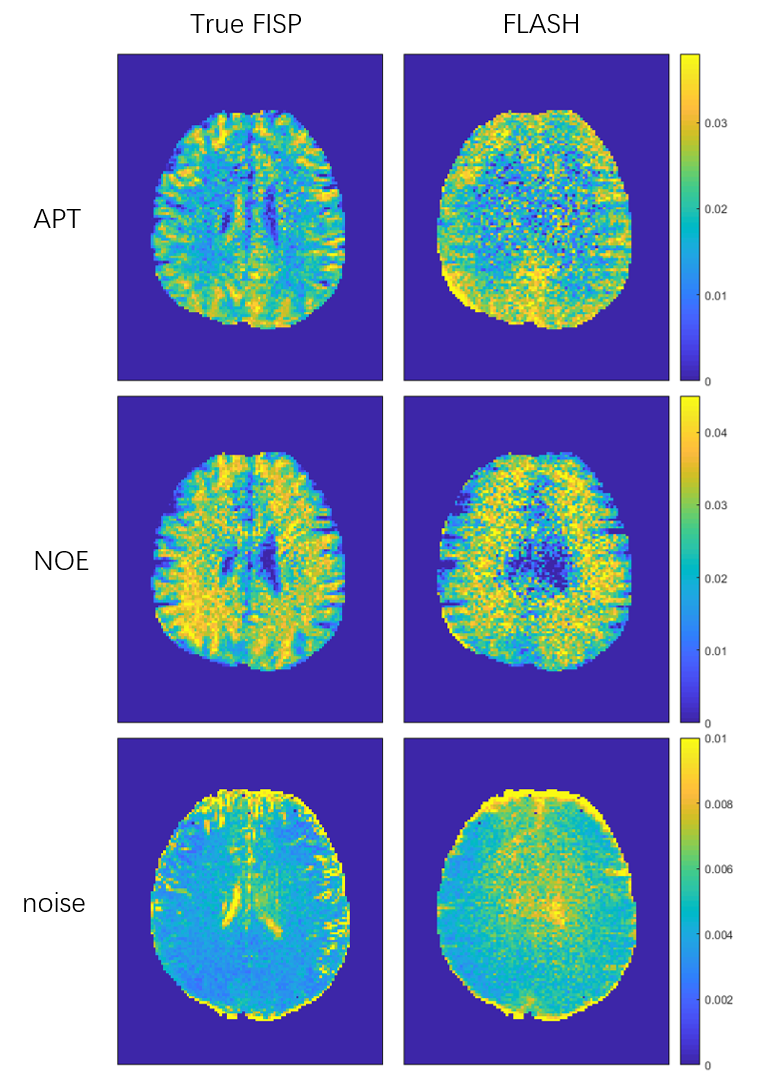
Figure 2 The APT, NOE, Z-spectrum noise maps obtained
from a healthy volunteer by True FISP sequence (1st column) and FLASH sequence (2nd column).
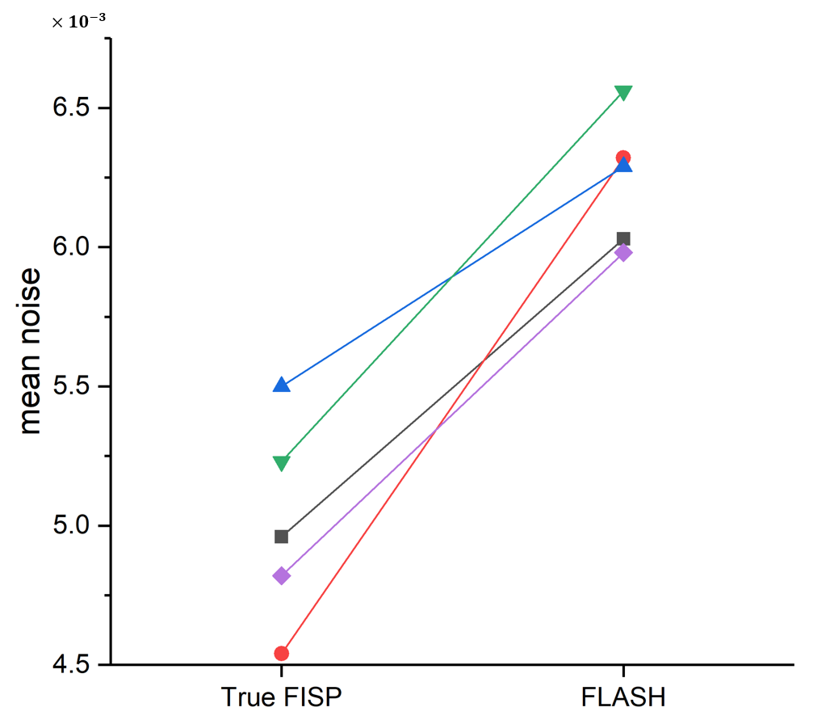
Figure 3 Mean noise of
Z-spectrum from the 9th slice for each subject scanned by True FISP and
FLASH sequences.
DOI: https://doi.org/10.58530/2023/2196