2194
Synthetic MRI derived Quantitative Maps in Diagnosis of Endometrial Carcinoma1Women's Hospital of Nanjing Medical University, Nanjing Maternity and Child Health Care Hospital, Nanjing, China, 2GE Healthcare, MR Research China, Beijing, China
Synopsis
Keywords: Data Analysis, Cancer
This study aimed to investigate whether synthetic-MRI can diagnose endometrial carcinoma (EC). 116 patients were recruited, including submucous myomas(SM),endometrial hyperplasia and endometrial polyps(EH&EP) and EC. Synthetic MRI derived T1, T2 and proton density(PD) mapping were obtained for each patient. Significantly different T1 and T2 were shown between EC and SM, and the optimal diagnostic efficacy was for T1+T2 with AUC of 0.865 . T2 and PD were also different between EC and EH&EP. The corresponding optimal diagnostic efficacy was for T2+PD with AUC of 0.690. With these findings, synthetic-MRI may thus be effective in differentiating EC from other intrauterine diseases.Introduction
Endometrial carcinoma (EC), as a malignant tumor of uterus, is the most common gynecological disease in perimenopause. In recent years, the incidence of EC has increased worldwide[1]. As a malignant tumor, it is necessary to detect and treat EC at early stage. However, it remains difficult to differentiate endometrial cancers from endometrial thickening, endometrial polyps and submucous myomas. Therefore, effective diagnostic methods are required. Magnetic resonance image compilation (MAGiC), as one type of synthetic MRI, is a recently proposed fast and reproducible quantitative MRI technique. Accurate relaxation times (T1 and T2) and proton density mapping by multi-echo acquisition of multiple saturation-recovery using turbo spin-echo readout, can be obtained simultaneously in a single scan, and accommodated to the clinical setting[2]. Multiple contrast-weighted images can then be reconstructed based on the relaxation properties of tissues in this technique. Previous studies have reported that MAGiC derived mappings have achieved excellent correlations with conventional MRI techniques, and has been applied in brain, breast and prostate, mainly for disease classification and differentiation between benign and malignant[2-5]. However, at present, few research has explored MAGiC in the diagnosis of EC. Therefore, this study aimed to investigate the feasibility of MAGiC derived quantitative mapping in distinguishing endometrial carcinoma from other intrauterine diseases.Materials and Methods
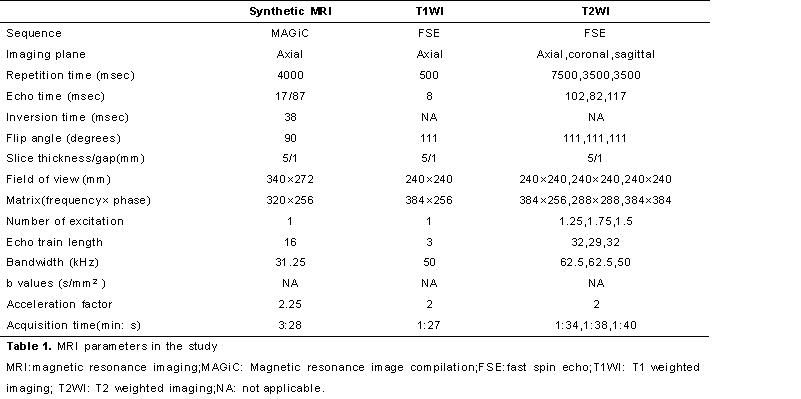
SubjectsA total of 116 patients were recruited in the study,including submucous myomas(n=25,mean age 40 years ranging from 25-63 years),endometrial hyperplasia and endometrial polyps(n=32,mean age 46 years ranging from 21-78 years),and endometrial carcinoma(n=59,mean age 54 years ranging from 30-69 years). All patients were confirmed by pathological analysis after surgery. MR ImagingA 3.0-T MR scanner (SIGNA Architect, GE Healthcare) with a 30-channel adaptive image receive coil was used for all subjects. The scan parameters of applied MAGiC and FSE sequences were presented in Table 1. Data analysisAll MAGIC data were post-processed using a vendor-provided program(MAGIC,v.100.1.1). The corresponding T1, T2, and PD mapping were obtained accordingly for each patient. Two radiologists were independently employed to manually draw three regions of interest (ROI)s with size of 30~50 mm2 in the center slice displaying the maximal area of Lesion on T1, T2, and PD images. The corresponding T1, T2 and PD values were obtained and the mean level of each metric was applied for further analysis. Statistical analysisStatistical analyses were performed using SPSS (version 23.0) and MedCalc software (version 15.2.2). Intra-class correlation coefficients analysis was applied to assess the inter-observer agreement of each parameter measurement over two radiologists. One-way analysis of variance (ANOVA) test together with independent sample t-test were applied to test the differences of T1, T2, and PD among three patient groups. Receiver operating characteristic curve (ROC) with the area under the curve (AUC) was used to evaluate the diagnostic efficacy of each quantitative parameters in EC differentiation from SM and EH&EP diseases. ROC curves were compared with Delong test. P<0.05 was considered statistically significant.Results
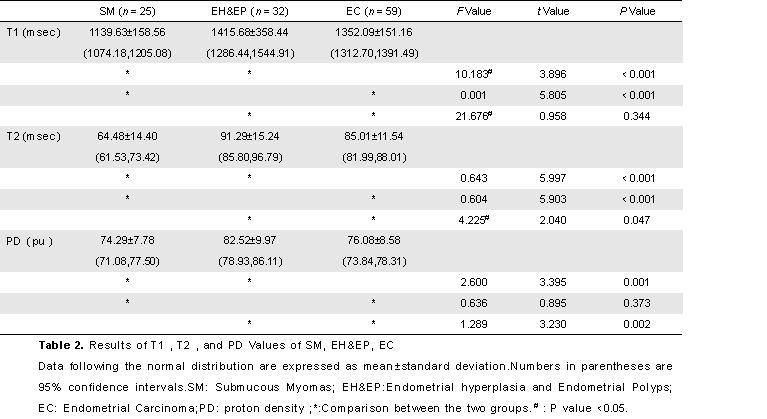
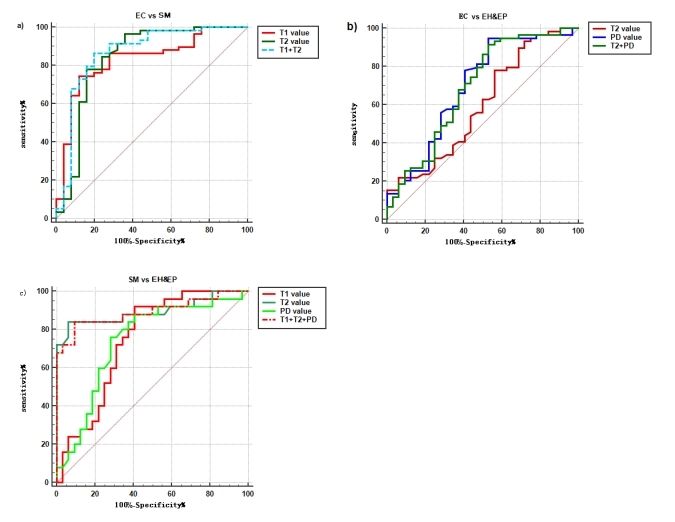
Excellent inter-observer agreement of each parameter measurement was confirmed by high ICCs (>0.90 for each parameter).The differences of T1 and T2 values between EC and SM were significant (T1:1352.09±151.16ms vs 1139.63±158.56ms,F(1,82)=0.001,p﹤0.001;T2: 85.01±11.54ms vs 64.48±14.40ms,F(1,82)=0.604,p﹤0.001;Table 2).Robust diagnostic efficacies were also shown for T1,T2 and T1+T2 with high AUCs of 0.830,0.839 and 0.865, respectively(Figure1a), which were comparable among the three models with Delong test (all p>0.05).The differences of T2 and PD values between EC and EH&EP were significant(T2:85.01±11.54ms vs 91.29±15.24ms,F(1,89)=4.225,p﹤0.05; PD:76.08±8.58pu vs 82.52±9.97pu,F(1,89)=1.289,p﹤0.05). Good diagnostic efficacies were validated for T2,PD and T2+PD with high AUCs of 0.598, 0.695 and 0.690, respectively(Figure1b). Delong test(all p>0.05) showed no statistical difference among the three models.T1,T2 and PD values were different between SM and EH&EP (T1:1139.63±158.56ms vs 1415.68±358.44ms,F(1,55)=10.183,p﹤0.001;T2:64.48±14.40ms vs 91.29±15.24ms,F(1,55)=0.643,p﹤0.001;PD:74.29±7.78pu vs82.52±9.97pu,F(1,55)=2.600,p=0.001).The AUCs of T1, T2, PD and T1+T2+PD were 0.744,0.895,0.739 and 0.892, respectively, indicating excellent diagnostic efficacies (Figure1c). With Delong tests, significantly different diagnostic efficacy was separately revealed for T2 and T1+T2+PD, if compared with T1 and PD, while comparable result was found between T2 and T1+T2+PD(all p﹤0.05).Discussion and Conclusions
In this study, the feasibility of MAGIC, as a synthetic MRI, in distinguishing endometrial carcinoma from other intrauterine diseases was investigated. With MAGIC derived quantitative mapping, different T1 and T2 were shown between EC and SM, different T2 and PD were found between EC and EH&EP, and different T1,T2 and PD were revealed between SM and EH&EP .In histological characteristics,SM derived from dense smooth muscle tissue with lower T1, T2 and PD values, was different from EH&EP and EC which derived from endometrium.Malignant lesions have more abundant solid components which might cause reduced extracellular space and free water content, resulting in shorter T2 and PD values. In addition, robust efficacies were also validated with high AUCs for these quantitative metrics in diagnosing EC from other two benign diseases. In conclusion, MAGIC derived quantitative maps can be considered effective in differentiating endometrial carcinoma from other intrauterine diseases.Acknowledgements
No acknowledgement found.References
1. Liang L,Zhu Y,Li J,et al. Immune Subtypes and Immune Landscape Analysis of Endometrial Carcinoma.[J] .J Immunol, 2022, 209(8): 1606-1614.
2. Gao W,Zhang S,Guo J,et al. Investigation of Synthetic Relaxometry and Diffusion Measures in the Differentiation of Benign and Malignant Breast Lesions as Compared to BI-RADS. J Magn Reson Imaging,2021, 53(4), 1118-1127.
3. Cui Y,Han S,Liu M,et al. Diagnosis and Grading of Prostate Cancer by Relaxation Maps From Synthetic MRI.J Magn Reson Imaging, 2020, 52(2): 552-564.
4. Sun SY,Ding Y,Li Z, et al. Multiparameter MRI Model With DCE-MRI, DWI, and Synthetic MRI Improves the Diagnostic Performance of BI-RADS 4 Lesions.Front Oncol, 2021, 11: 699127.
5. Matsuda M,Tsuda T,Ebihara R, et al.Triple-negative breast cancer on contrast-enhanced MRI and synthetic MRI: A comparison with non-triple-negative breast carcinoma.Eur J Radiol, 2021, 142: 109838.
Figures