2193
The diagnostic value of synthetic MRI in predicting the activity of Graves ophthalmopathy1416 Hospital of Nuclear Industry, Chengdu, China, 2GE Healthcare, MR Research, Beijing, China
Synopsis
Keywords: Quantitative Imaging, Head & Neck/ENT
In this study, we aim to investigate the performance of quantitative measurements from synthetic MRI in predicting the disease activity of Graves’ ophthalmopathy (GO). 40 patients with different Clinical Activity Scores are investigated. We found a trend that the muscles’ T1, T2 and PD values increased with increasing CAS level, spatially for T2 values. Furthermore, fact that T2 escalation in ‘inactive’ CAS groups compared with healthy controls, indicate CAS staging may underestimate disease activity. We conclude that synthetic MRI have potential to predict clinical activity of GO, and T2 value has the highest diagnostic efficiency.Introduction
Graves’ ophthalmopathy (GO) is an autoimmune disease associated with hyperthyroidism. Although the incidence rate of GO is relatively low, it has a significant impact on the quality of life of patients, whether in mental health or socio-economic status [2]. Although the vast progress has been made during past years and the understanding of GO’s pathogenesis have been improved significantly, however, effective treatment of GO is still problematic. The clinical efficacy is closely related to the stage of the disease [3,4]. To date, Clinical Activity Scores (CAS) has been the most widely accepted tool to assess GO severity and activity. However, these classifications can be subject to clinical experience and patient status. Studies have confirmed that even some GO patients in CAS3 are not sensitive to hormonal therapy and their symptoms do not improve [6].At the same time, studies have found that CAS evaluation criteria are not fully applicable to Asian patients [7]. A more objective assessments are needed. Recently proposed synthetic MR methods, the magnetic resonance image compilation (MAGiC) with multiecho and multidelay acquisition method can simultaneously quantify tissues’ intrinsic magnetic properties, and investigates relaxometry measures T1, T2 relaxation time and proton-weighted (PD). To the best of our knowledge, there have been no attempts applying MAGiC in GO patients. The purpose of this study was to explore the feasibility of applying synthetic MRI technology to thyroid eye disease and to explore its correlation with CAS.Methods
From June 2021 to September 2021, patients with thyroid related eye disease who were also received orbital MRI in in our hospital were prospectively collected. Finally, 40 patients were included in the study, including 17 males and 23 females, with an average age of 30±7 years. Patients were divided into three groups according to CAS scoring system. Another 20 matched healthy volunteers were collected as the control group. All patients underwent MR exams with a 3.0 T scanner (Signa Architect, GE Healthcare, Milwaukee, WI). The quantitative measurements, including T1, T2 and PD maps (Figure 1) were generated from the raw data produced by MAGIC imaging sequence using a vendor-provided program (MAGiC, version 100.1.1). Manual ROI measurements were performed in bilateral superior, inferior, medial and external rectus muscles. Paired T test and One-way ANOVA test was used to analyze the differences among different groups. ROC was used to evaluate the diagnostic efficacy of T1, T2 and PD in predicting GO activity.Results
There were no significant differences in T1, T2 and PD values between different extraocular muscles, left and right muscles in the control group (ALL P >0.05). There were statistically significant differences in T1, T2 and PD values between different extraocular muscles, left and right muscles in the GO group (ALL P <0.05, Table 1).The maximum T2 value of synthetic MRI technique for predicting the activity of extraocular muscle was 0.845 under ROC, and the 95% confidence interval was 0.792~0.903. With 73.5ms as the critical value, the diagnostic sensitivity and specificity were 83.5 % and 73.6 % respectively.The area under ROC for T1 prediction activity at the same level was 0.662, and the 95% confidence interval was 0.587~ 0.736. With 1201.5ms as the critical value, the diagnostic sensitivity and specificity were 58.7% and 78.2%.The area under ROC for PD prediction activity at the same level was 0.696, and the 95% confidence interval was 0.624-0.767. With 78.95ms as the critical value, the diagnostic sensitivity and specificity were 66.1 % and 67.8 %, (Figuer 2).Acknowledgements
We gratefully acknowledge research support from GE Healthcare.
References
1. Smith TJ, Hegedüs L. Graves’ disease. N Engl J Med. 2016;375:1552–1565.
2. Bartalena L, Baldeschi L, Boboridis K, et al. The 2016 European Thyroid Association / European Group on Graves’ Orbitopathy Guidelines for the Management of Graves’ Orbitopathy. Eur Thyroid J, 2016,5(1):9-26.
3. Tachibana S, Murakami T, Noguchi H, et al. Orbital magnetic resonance imaging combined with clinical activity score can improve the sensitivity of detection of disease activity and prediction of response to immunosuppressive therapy for Graves' ophthalmopathy. Endocr J, 2010, 57(10): 853-861.
4. AI-Sharif E, Alsuhaibani AH. Fat-removal orbital decompression for thyroid associated orbitopathy: the right procedure for the right patient. Saudi J Ophthalmol,2017,31(3):156161.
5. J-P V,Gilquin J. Gravess Disease. N Engl J Med, 2017,376 ( 2):184-185.
6. Seigo Tachibana,Tsukasa Murakami,Hitoshi Noguchi,et al.Orbital magnetic resonance imaging combined with clinical activity score can improve the sensitivity of detection of disease activity and prediction of response to immunosuppressive therapy for Graves' ophthalmopathy.Endocrine journal,2010,57(10):p.853-861.
7. Wang Y, Zhang S, Zhang Y, et al. A single-center retrospective study of factors related to the effects of intravenous glucocorticoid therapy in moderate-to-severe and active thyroid-associated ophthalmopathy. BMC Endocr Disord. 2018;18(1):13. Published 2018 Feb 20.
8. Mourits M P, Koornneef L, Wiersinga W M, et al. Clinical criteria for the assessment of disease activity in Graves’ ophthalmopathy: a novel approach . Br J Ophthalmol,1989,73 ( 8 ):639-644.
9. Chen W, Hu H, Chen HH, Su GY, Yang T, Xu XQ, Wu FY. Utility of T2 mapping in the staging of thyroid-associated ophthalmopathy: efficiency of region of interest selection methods. Acta Radiol. 2020 Nov;61(11):1512-1519.
10. Prummel MF, Gerding MN, Zonneveld FW, et al. The usefulness of quantitative orbital magnetic resonance imaging in Graves 'ophthalmopathy. Clin Endocrinol (Oxf), 2001 ,54 (2): 205 209 .
Figures
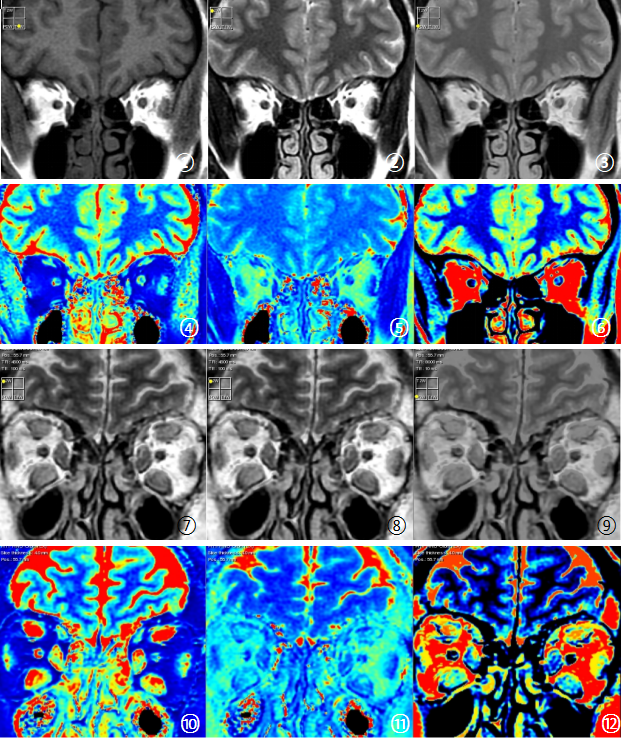
Figure1 Synthetic MRI images of experimental group and healthy controls
① to ⑥ are the schematic diagram of healthy controls synthetic MRI images, which are T1WI, T2WI, PDWI, T1MAPPING, T2MAPPING and PDMAPPING, respectively ⑦ -Synthetic MRI images of the experimental group were consistent with those of the healthy controls.
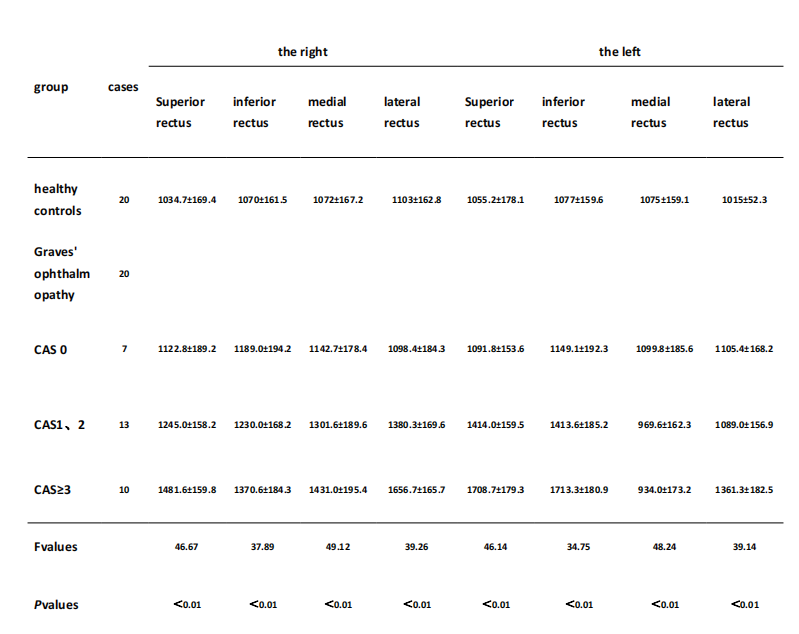
TableⅠ. Difference in T1 values of extraocular muscles between patients with Graves' ophthalmopathy and healthy controls
There were statistically significant differences in extraocular musclesT1 values between the experimental group and the healthy controls group. And There were differences in T1 values between the left and right eyes. The measured values showed a gradual increase trend.
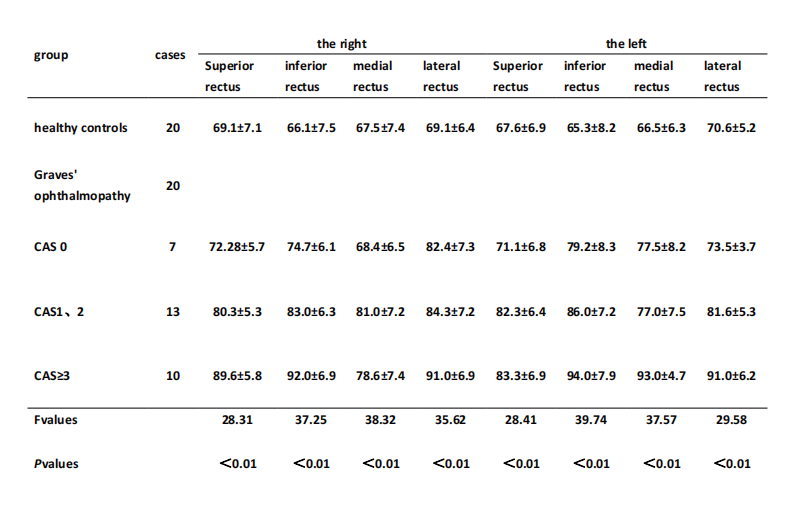
TableⅡ. Difference in T2 values of extraocular muscles between patients with Graves' ophthalmopathy and healthy controls
There were statistically significant differences in extraocular musclesT2 values between the experimental group and the healthy controls group. There were differences in T2 values between the left and right eyes. The measured values showed a gradual increase trend.
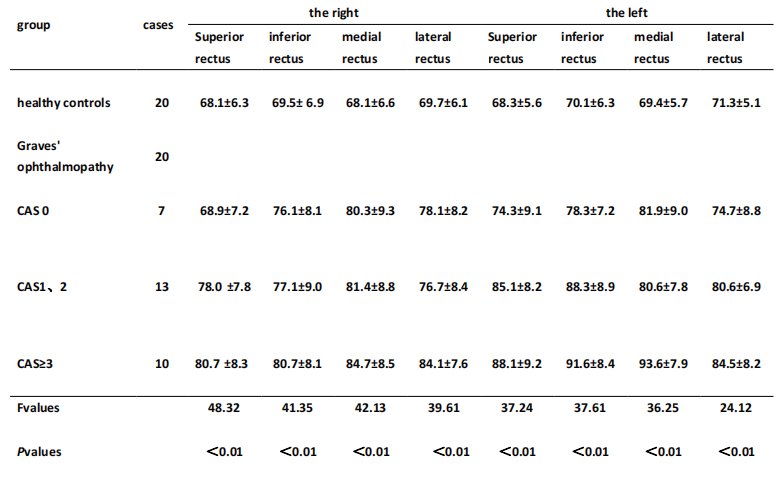
Table Ⅲ. Difference in PD values of extraocular muscles between patients with Graves' ophthalmopathy and healthy controls
There were statistically significant differences in extraocular muscles PD values between the experimental group and the healthy controls group. There were differences in PD values between the left and right eyes. The measured values showed a gradual increase trend.
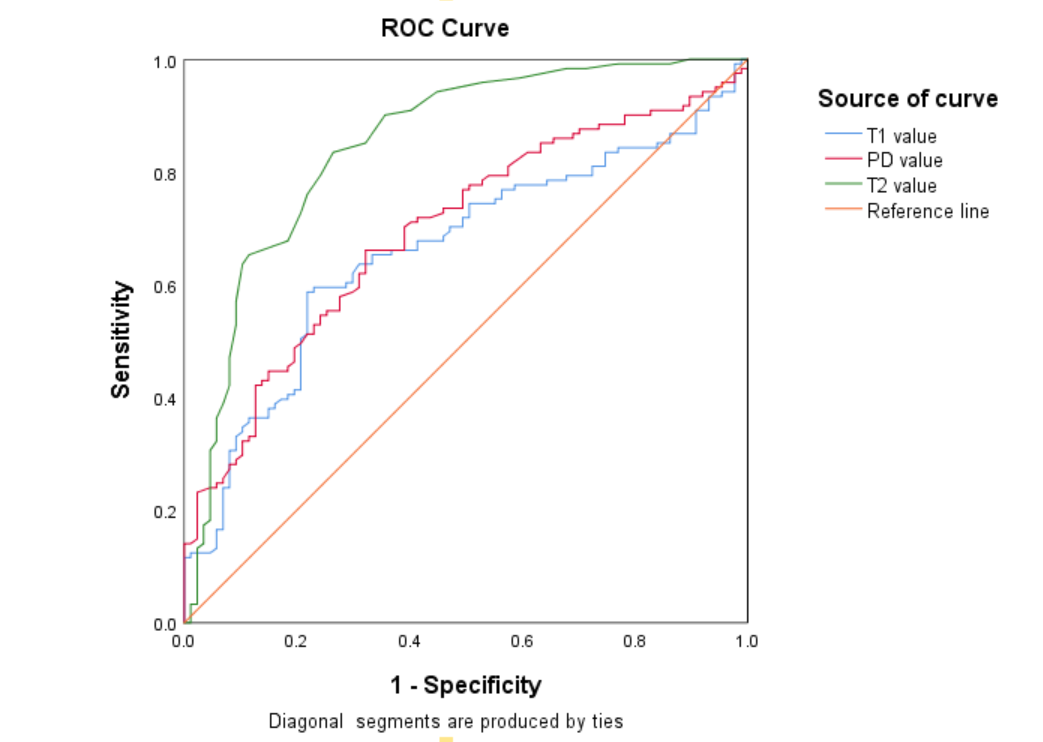
Figure 2 Diagnostic efficacy
The area under the ROC curve of maximum T2values was 0.845, 95% confidence interval was 0.792-0.903 ,with a cut-off value of 73.5ms, the diagnostic sensitivity was 83.5 %, the specificity was 73.6 %. The area under the ROC curve of T1values was 0.662, 95% confidence interval was 0.587-0.736, 1201.5ms was used as the cut-off value, the diagnostic sensitivity was 58.7 %, the specificity was 78.2 %. The area under the ROC curve of PDvalues was 0.696. With the cut-off value of 78.95ms, the diagnostic sensitivity was 66.1 %, and the specificity was 67.8 %.