2190
Simultaneous T1 T2 T2* quantification using 2D EPI-MRF by shuffled sampling and compressed time-resolved reconstruction with B0 B1+ correction
Di Cui1, Xiaoxi Liu1, Peder E.Z. Larson1, and Duan Xu1
1University of California, San Francisco, San Francisco, CA, United States
1University of California, San Francisco, San Francisco, CA, United States
Synopsis
Keywords: MR Fingerprinting/Synthetic MR, MR Fingerprinting
A 2D EPI based MRF acquisition and reconstruction method was developed in this study. A shuffled acquisition order and pseudo-randomized sampling pattern was designed for 2D k-space and compressed time-resolved reconstruction was utilized for faster reconstruction. T1 T2 T2* were simultaneously quantified, B0, B1+ and proton density maps are generated.Introduction
Signal evolution model based multi-parametric quantification methods have shown great efficiency in quantitative MRI, including MR fingerprinting (MRF)[1], echo planar time-resolved imaging (EPTI)[2], quantitative transient-state imaging (QTI)[3], etc. EPI based traditional MRF tends to suffer from relatively long echo time (TE) and repetition time (TR) with off resonance and T2* induced problem, while time-resolved[2] method provides an option to reconstruct every echo along the echo train using signal based subspace reconstruction. In this work, we proposed a 2D EPI-MRF method with simultaneous T1, T2 and T2* quantification. A shuffled acquisition order and pseudo-randomized sampling pattern was designed for 2D k-space to enlarge the sparsity and signal incoherence. The compressed time-resolved method was proposed to accelerate the reconstruction and correct off resonance effect and Nyquist ghost.Methods
The sequence is based on an inversion recovery unbalanced steady state free precession (ubSSFP) MRF sequence, Figure 1(a-b) shows the sequence diagram of consecutive time frames with a ramp up-down flip angle pattern. A pseudo-randomized ky-t plane in Figure1(c) was designed with the restrictions of (1) a variable density distribution, (2) limited $$$\Delta ky$$$ due to the duration and amplitude of blip gradients and (3) non-repeated outer k-space samples in adjacent TRs. To further increase the signal incoherence, a random ky line was sampled as the first echo, and followed by interleaved sampling of other lines as the ky-t sampling pattern, as in Figure 1(d).Acquired data was reconstructed in time-resolved manner with: $$\mathop{\text{argmin}}_{\alpha}\frac{1}{2}||FS\phi U_k^H\alpha-y ||_2^2 +\lambda|R(\alpha)|_* \space (1)$$
And the subspace image can be solved with alternating direction method of multipliers (ADMM). Compression method[4] in calculating the gradients of the l-2 term is not available since the off-resonance related phase term $$$\phi$$$ is not independent with time, thus the position of operator $$$U_k^H$$$ is fixed. Here we used a 2 dimensional decomposition similar to 2D-PCA to enable the compression in this case. The signal evolution can be divided into two independent parts – T1 and T2 weighted inter-TR signal and T2* weighted intra-TR signal due to the existence of spoiler, and the image series $$$x$$$ can then be decomposed as $$$\alpha = U_{2,k2} U_{1,k1}x$$$ instead, where $$$U_{1,k1}$$$ and $$$U_{2,k2}$$$ are calculated from inter-TR and intra-TR signal, respectively. Then $$$U_{k}^H$$$ could be replaced by $$$U_{1,k1}^H U_{2,k2}^H$$$, where $$$U_{2,k2}^H$$$ is still fixed with $$$\phi$$$ because they are both intra-TR variables, but $$$U_{1,k1}^H $$$ can switch positions to subsequent reduce the size of $$$A^H A$$$ and $$$A^H y$$$. The rank number in this work was k1 = 6 and k2 = 2, moreover, only the largest 8 coefficients out of $$$k_1 \times k_2$$$ were used in reconstruction. In 450 time frames, the compression rate in $$$A^H y$$$ is $$$\times 75$$$ and $$$ A^H A $$$ is $$$\times 5625$$$, which makes the reconstruction significantly faster. A locally low rank regularization term was utilized to resolve the residual artifacts.
The phase term $$$\phi$$$ in Eq 2 was estimated by solving Eq 1 with $$$U_{1,0}$$$, i.e. $$$k_1=0$$$. Each echo along TR is calculated separately with only inter-TR variations. Artifacts were not severe due to the contrast and high intensity of the first subspace order. The phase map for one echo was generated as the filtered phase of subspace image. The phase map corrects both off resonance effect and Nyquist ghost in reconstruction. Furthermore, off resonance map can be fitted with the phase map of all echoes according to the exact echo time for each EPI lobe. The whole reconstruction process is illustrated as Figure 2.
As mentioned, 2 dictionaries were generated for inter- and intra-TR signals with T1-T2 and T2* weighting respectively. A B1+ scale of 0.5~1.2 was simulated for the inter-TR dictionary. T1,T2,B1+ were matched with inter-TR dictionary and T2* was measured with intro-TR dictionary. B1+ was then fitted with a 2nd-order polynomial filter according to its smoothness as a prior.
The acquisition and reconstruction method were demonstrated with phantom and healthy volunteer studies. The in-house phantom was made with MnCl2 of 9 different concentrations for T1 varies from 0.4 to 1.45s and T2 from 0.038 to 0.18s. All the scans were performed on a GE 3T scanner (MR750, Waukesha, WI) with a 32-channel head coil. Other parameters include TR = 40ms, TI = 3.65ms, FOV = 224x224, resolution 1mm2, time frame 450, and scan time is 16s per slice.
Results
Figure 3 shows the intermediate results of phase map calculations, and subspace images after reconstruction, and dynamic images of different contrast before dictionary matching. Phase map difference between odd and even echoes is related to Nyquist ghost and eddy current. Figure 4 shows the quantitative maps generated from the reconstruction and dictionary matching.Discussion and Conclusion
A 2D EPI based MRF acquisition and reconstruction method was developed in this study. B0 and B1 can be corrected during the reconstruction based on these designs. T1 T2 T2* were simultaneously quantified, and B0, B1+ and proton density maps are generated as a bonus. A 3D implementation has the potential to further reduce the scan time.Acknowledgements
No acknowledgement found.References
1. Ma, Dan, et al. "Magnetic resonance fingerprinting." Nature 495.7440 (2013): 187-192.
2. Wang, Fuyixue, et al. "3D Echo Planar Time-resolved Imaging (3D-EPTI) for ultrafast multi-parametric quantitative MRI." NeuroImage 250 (2022): 118963.
3. Gómez, Pedro A., et al. "Designing contrasts for rapid, simultaneous parameter quantification and flow visualization with quantitative transient-state imaging." Scientific reports 9.1 (2019): 1-12.
4. Tamir, Jonathan I., et al. "T2 shuffling: sharp, multicontrast, volumetric fast spin‐echo imaging." Magnetic resonance in medicine 77.1 (2017): 180-195.
Figures
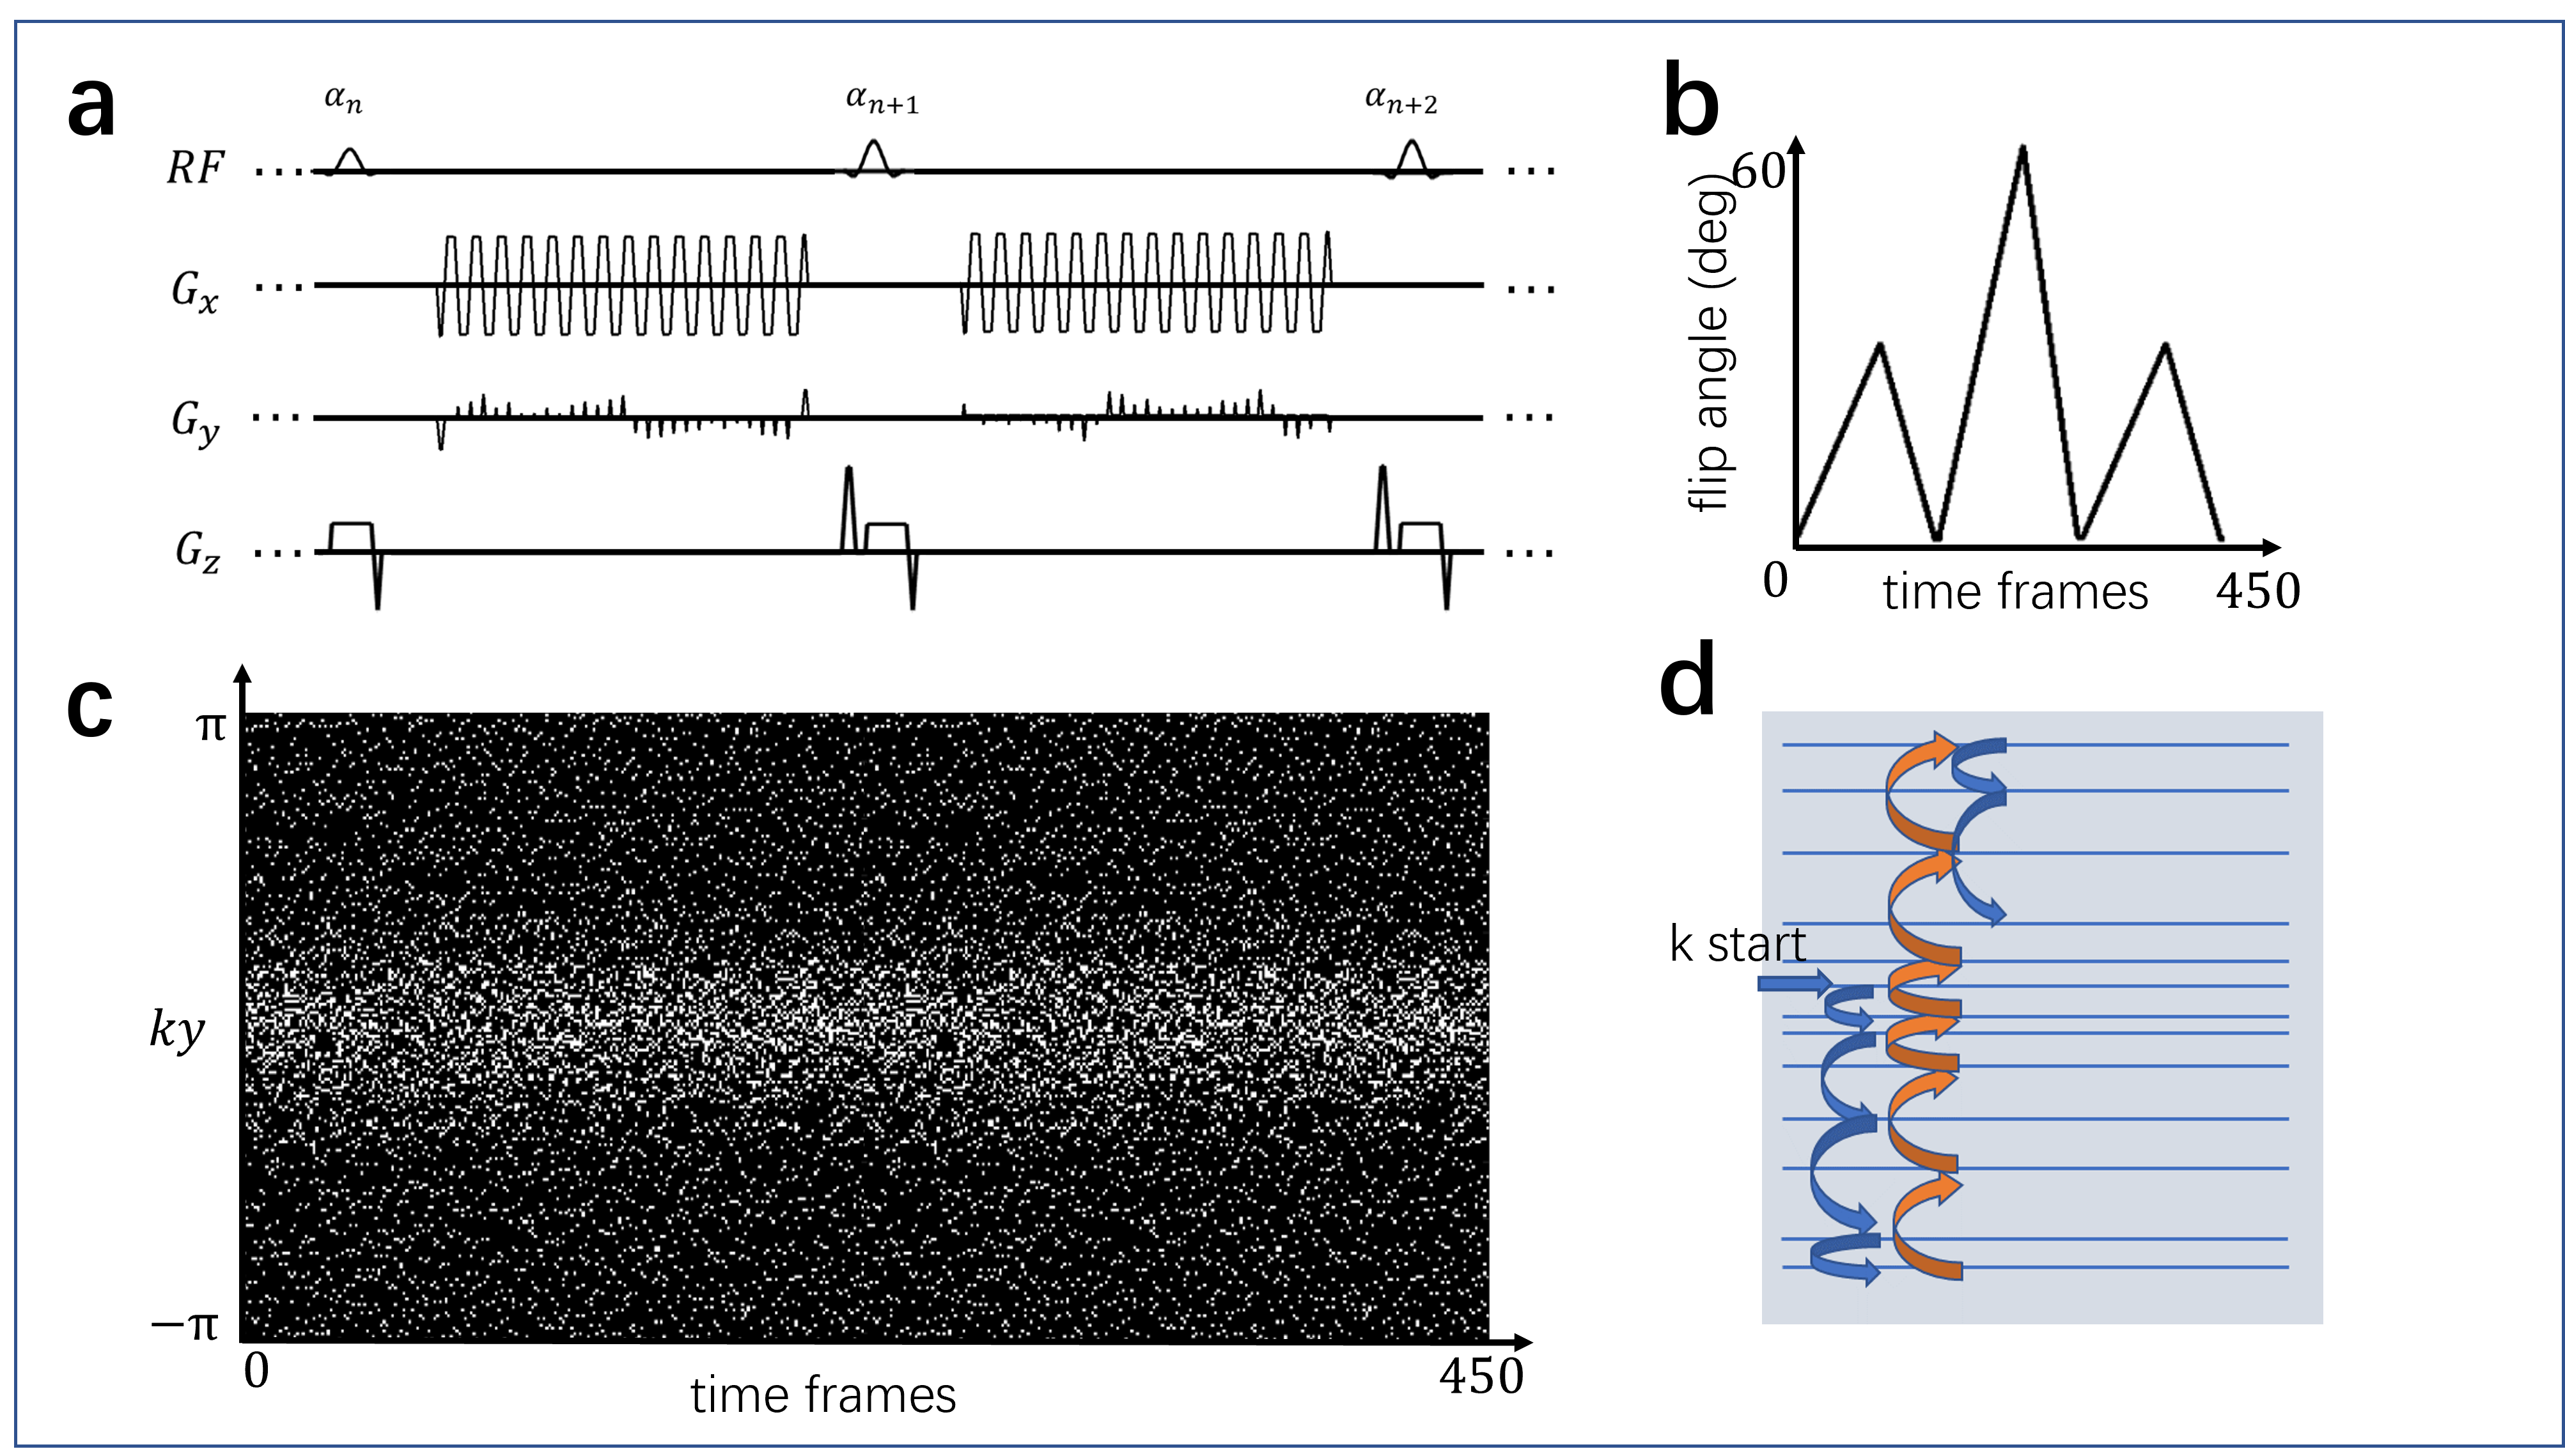
Figure 1 (a) Sequence diagram in consecutive time frames showing the EPI readout (b) Flip angle train (c) Pseudo-randomized sampling in ky-t domain (d) shuffled sampling order for each time frame
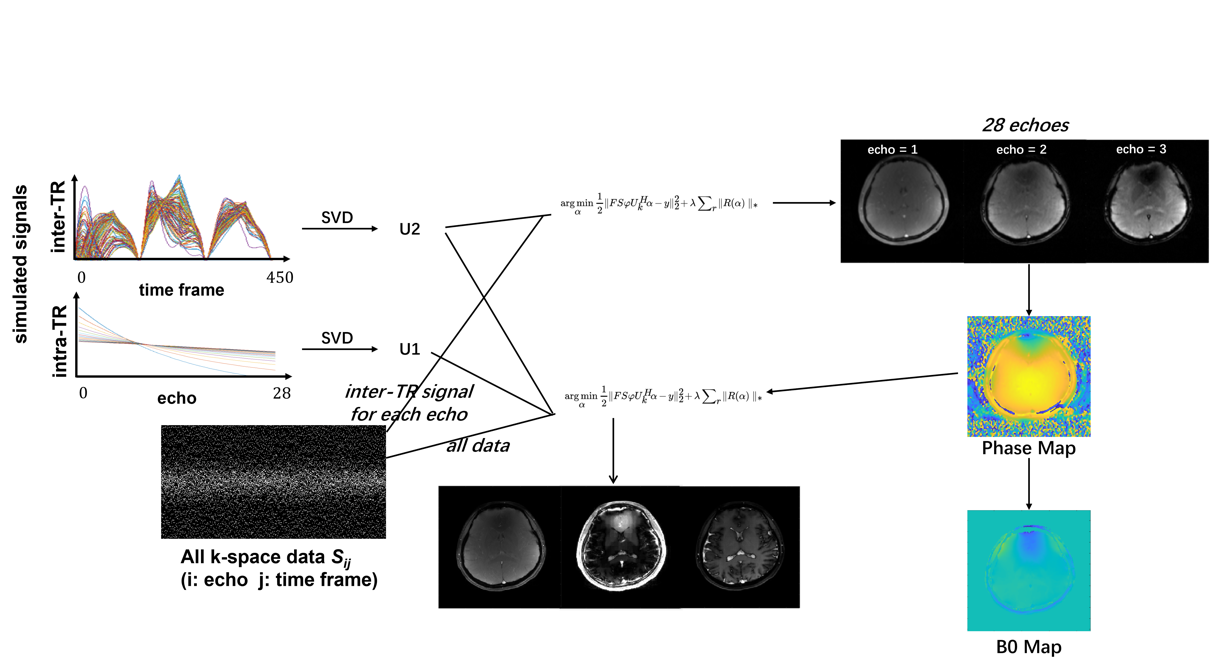
Illustration of reconstruction processes. Time dimension is transferred into intra- and inter-TR dimensions. In off resonance and N/2 ghost correction, only the inter-TR part and one subspace order was used to estimate the phase map
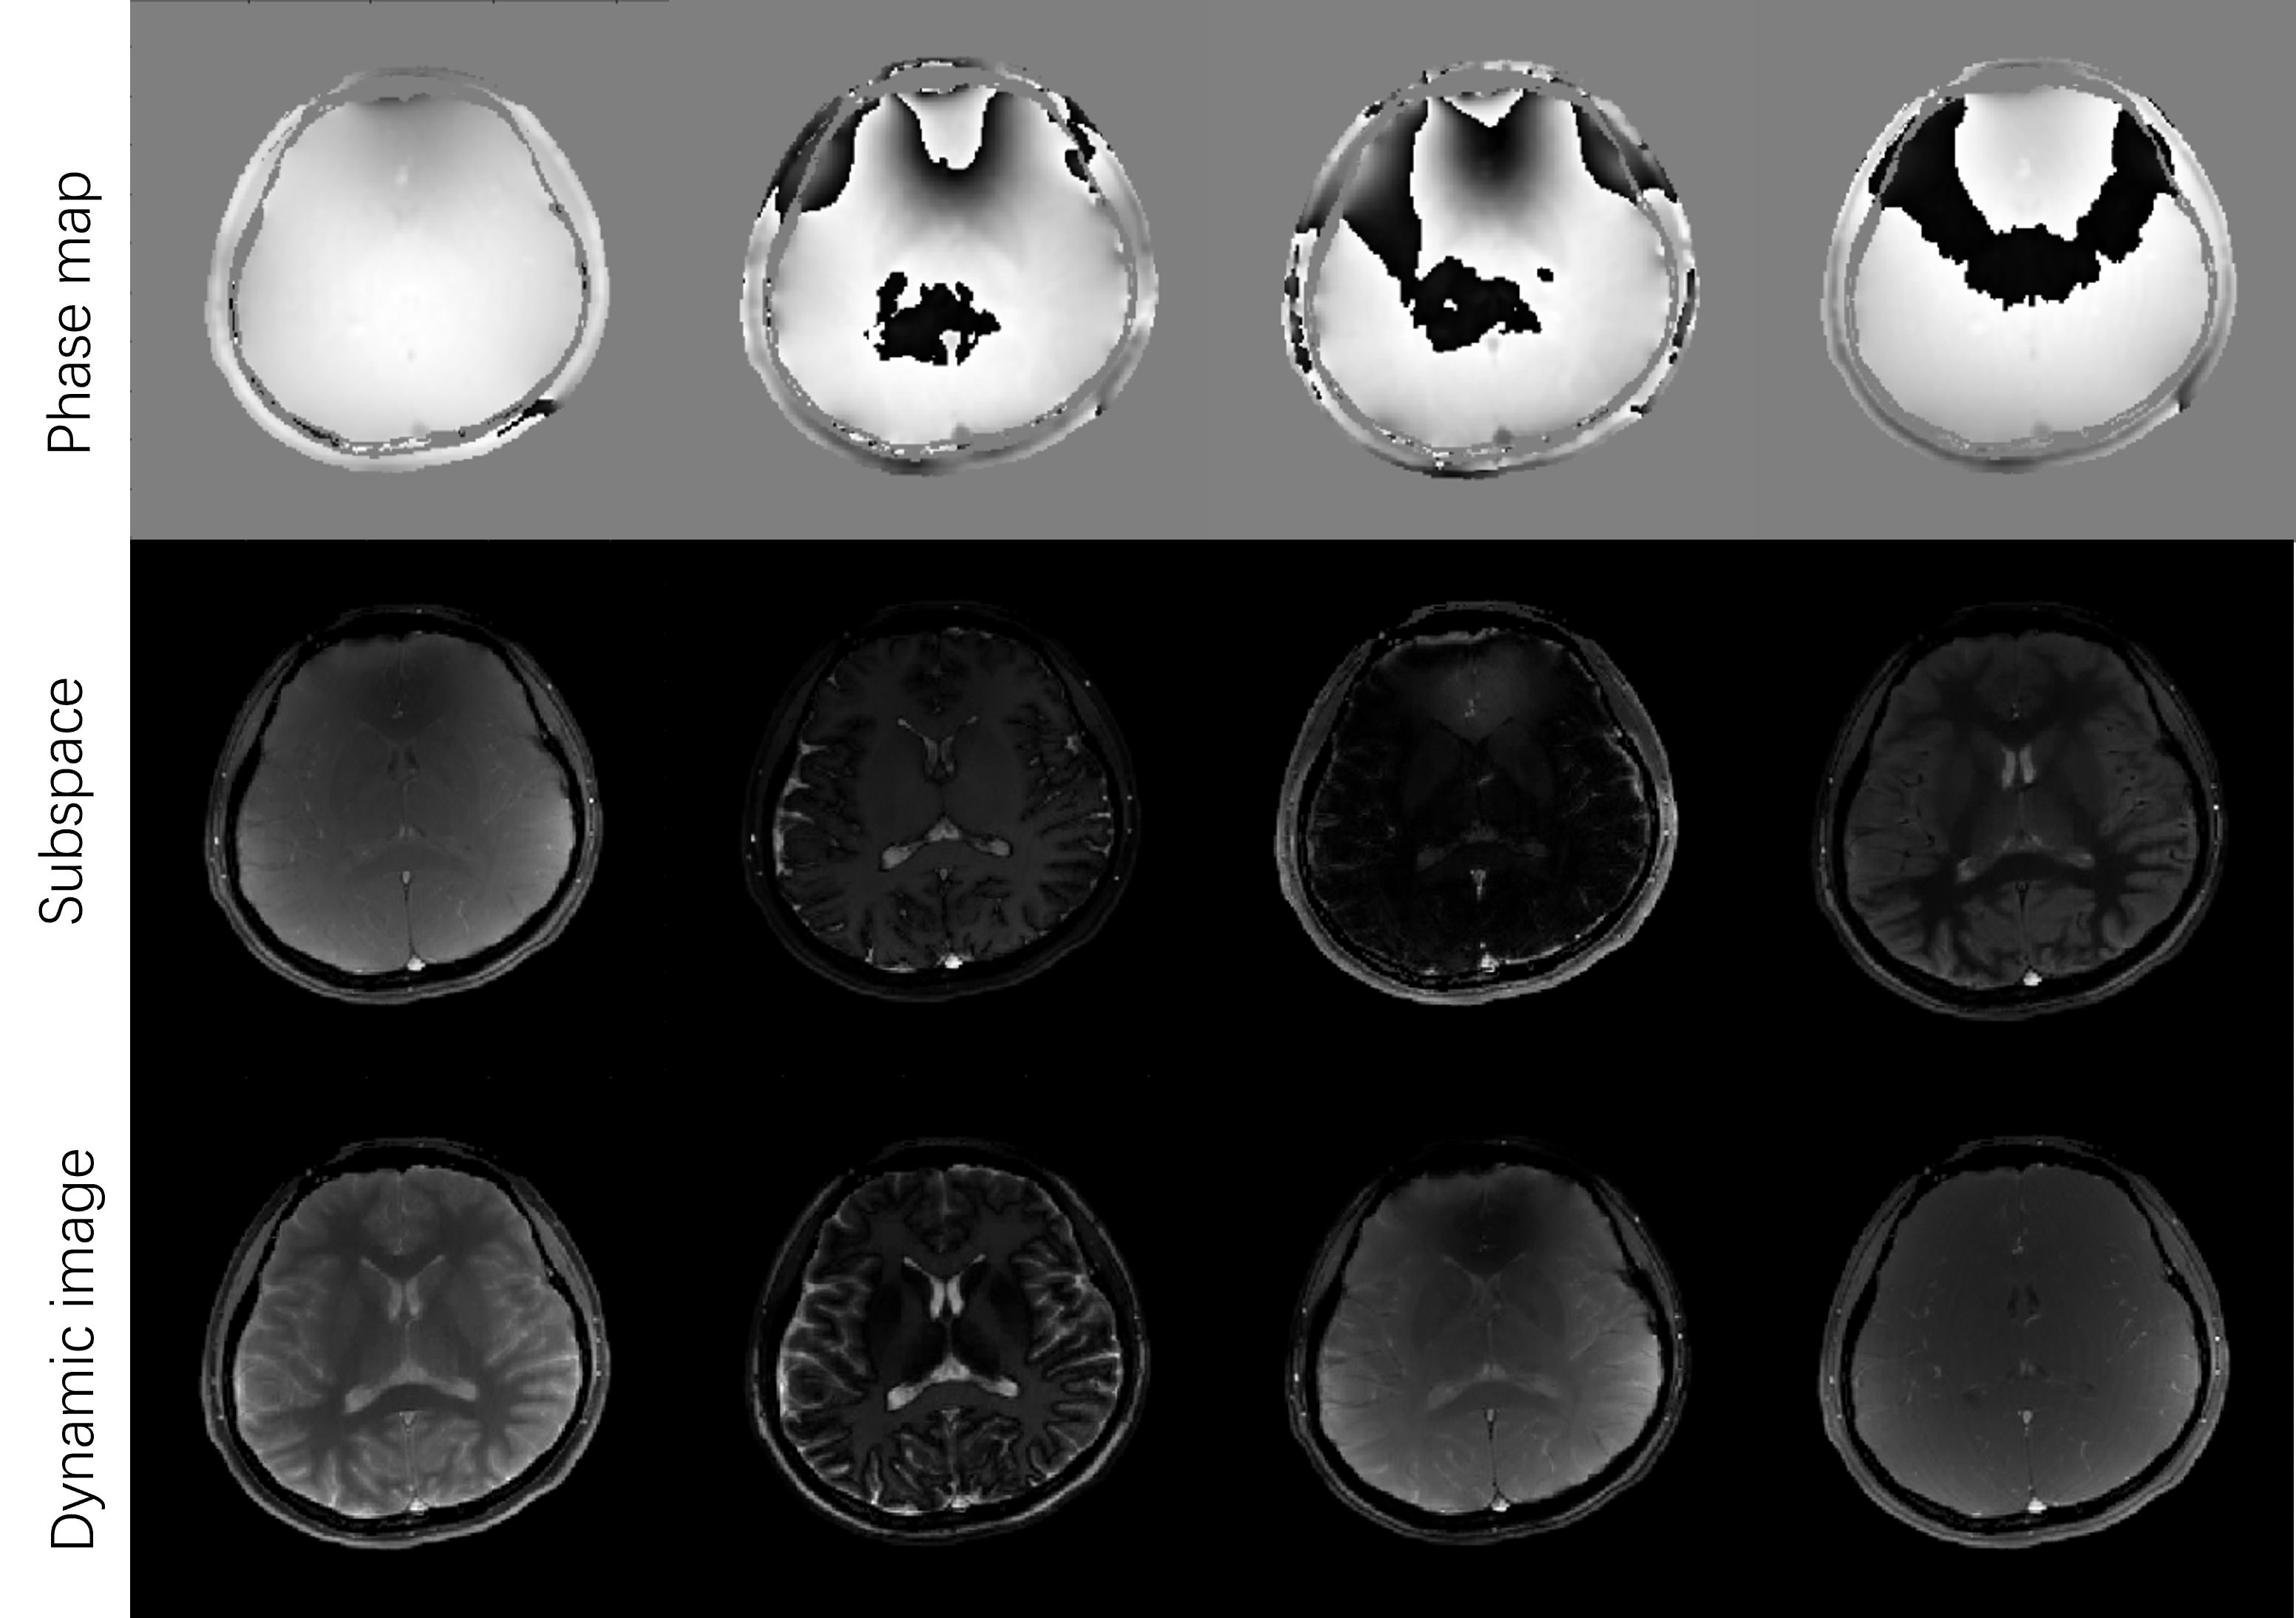
Intermediate images. First row, phase maps of 1st, 2nd and 13th, 14th echoes. Second row, examples of subspace images . Third row, multi-contrast dynamic images selected from 450x28 images
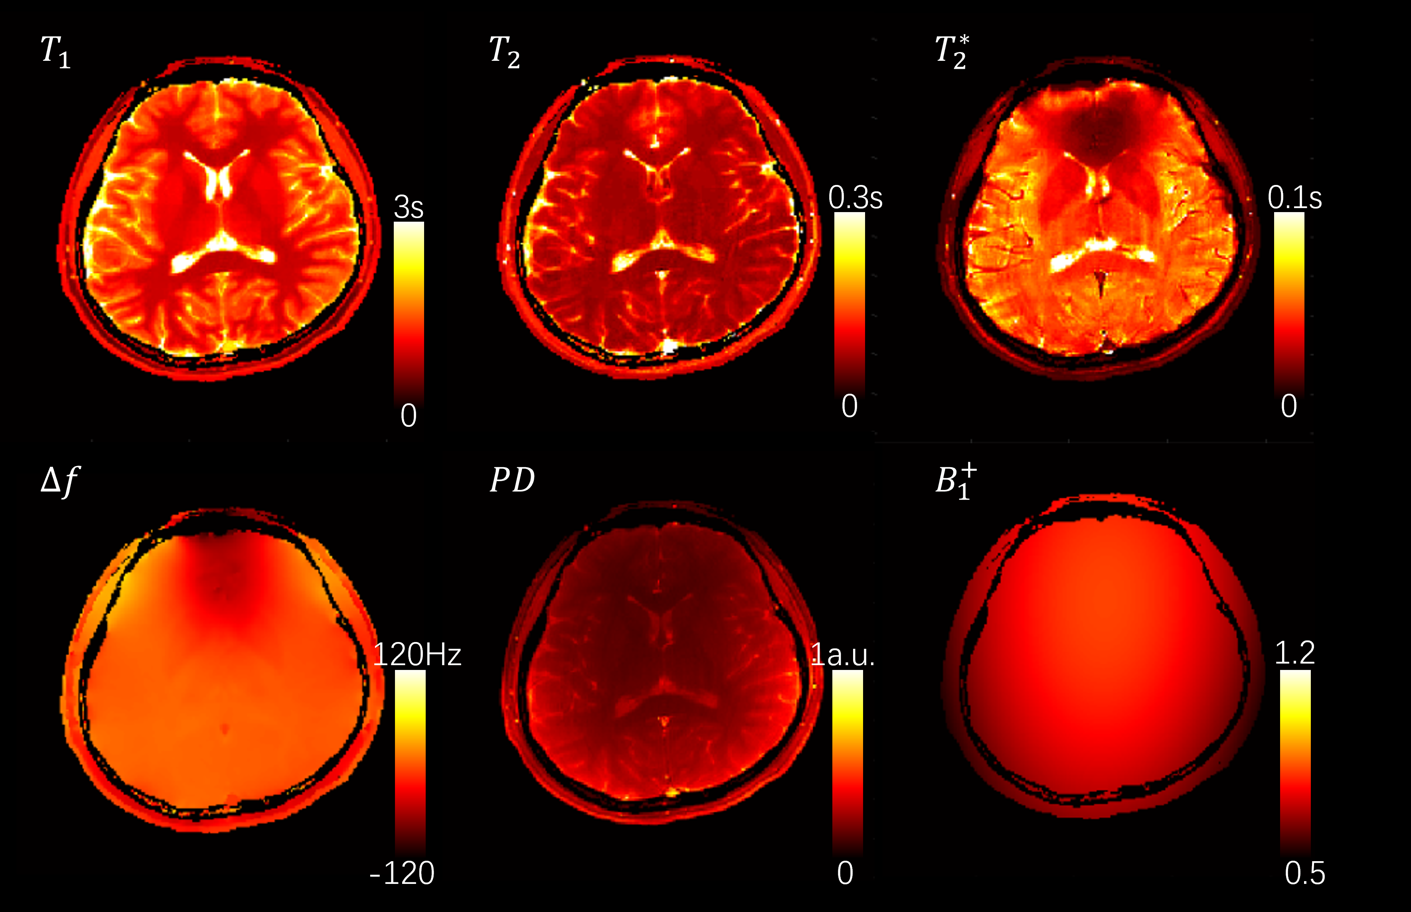
Quantitative maps from a single scan
DOI: https://doi.org/10.58530/2023/2190