2188
T1ρ Dispersion Characterization by Magnetic Resonance Fingerprinting1Imaging Institute, Cleveland Clinic, Cleveland, OH, United States, 2Department of Biomedical Engineering, Program of Advanced Musculoskeletal Imaging (PAMI), Cleveland Clinic, Cleveland, OH, United States, 3Department of Electrical, Computer, and Systems Engineering, Case Western Reserve University, Cleveland, OH, United States
Synopsis
Keywords: MR Fingerprinting/Synthetic MR, Quantitative Imaging, T1rho Dispersion
T1ρ dispersion is a potential biomarker that can characterize chemical exchange or diffusive exchange, complementary to other MR relaxometry parameters (e.g. T1, T2). However, T1ρ dispersion conventionally involves quantification of T1ρ at multiple spin-lock frequencies, which can require prohibitively long scan times and high radiofrequency pulse energy deposition. MR Fingerprinting (MRF) has been reported for quantification of T1ρ at a single spin-lock frequency. We propose a framework to enable T1ρ dispersion MRF data acquisition and reconstruction. We report initial simulation and real-world phantom results that demonstrate the feasibility of this MRF-based T1ρ dispersion characterization method.Introduction
T1ρ relaxation time is a tissue property that can be probed in order to assess tissue composition, e.g. glycosaminoglycan content in cartilage and fiber type proportion in skeletal muscle1. T1ρ characterizes longitudinal relaxation during the application of a “spin-locking” radiofrequency excitation magnetic (B1) pulse2. T1ρ is influenced by interactions of large biomolecules and water and is dependent on the spin-lock frequency (FSL) of the applied B1 field. T1ρ dispersion across FSL values is an additional magnetic property beyond single-frequency T1ρ that is sensitive to chemical exchange and diffusion or diffusive exchange3.T1ρ relaxation can be quantified via multiple spin-lock magnetization preparation pulses at a given FSL with varied spin-lock times (TSL) to acquire T1ρ-weighted images. Typically, curve-fitting of T1ρ-weighted images is performed using an exponential decay equation2. By quantifying T1ρ at multiple FSL values, the T1ρ dispersion of a tissue can be characterized. However, this approach can be prohibitively time consuming as it requires multiple scans at different FSL and can also require prohibitively high energy deposition rates at relatively high FSL values.
MR Fingerprinting (MRF) is a flexible, rapid imaging technique that can allow simultaneous quantification of multiple tissue properties4. In this work, we demonstrate the use of MRF for T1ρ dispersion characterization in simulation and physical phantom.
Methods
The T1ρ dispersion MRF method in this work is based on a previously reported T1ρ-MRF sequence5. Whereas the previous T1ρ-MRF sequence used spin-lock preparations at a single, fixed FSL, this method used variable FSL. TSL values were fixed to 40 ms for each spin-lock pulse. Variable flip angle, fixed repetition time, and fixed echo time were used. Spatial encoding used a Cartesian spiral undersampling pattern6.A model of T1ρ dispersive effects across FSL was used as part of dictionary generation, given by3
$$T_{1\rho}(\omega)=\frac{(q^2D)^2+\omega^2}{\gamma^2g^2D}=T_2+a^2\omega^2$$
which relates T1ρ, FSL ($$$\omega$$$), Hydrogen gyromagnetic ratio ($$$\gamma$$$), self-diffusion coefficient ($$$D$$$), spatial frequency of local magnetic field variation ($$$q$$$), and related mean gradient strength ($$$g$$$)3. The quantities $$$g^2D$$$ and $$$q^2D$$$ are related to T2 by $$$T_2=\frac{(q^2D)^2}{\gamma^2g^2D}$$$ and $$$a^2=\frac{1}{\gamma^2g^2D}$$$. Note that at FSL=0, T1ρ=T2. The dictionary is generated containing three parameters that characterize the relevant magnetic characteristics, namely: $$$T_1$$$, $$$T_2$$$, and $$$a$$$. After acquisition of T1ρ dispersion MRF data, a 3D spatial total variation-regularized, temporal low rank reconstruction was employed to suppress noise and undersampling artifacts and obtain tissue property maps.
A digital cylindrical phantom with known ground truth T1, T2, and T1ρ dispersion values was used for in silico implementation of the T1ρ dispersion MRF sequence. A 500 frame MRF sequence was used with acceleration factor R=60 and matrix size 192x192x16.
An agarose gel phantom with glucose addition was used to assess T1ρ dispersion using T1ρ dispersion MRF as compared to a reference method. The scanner was a Prisma 3T (Siemens Healthineers) and a 15-channel Tx/Rx knee coil was used. The reference method used MAPSS at matrix size 192x192x16 with T1ρ quantification at FSL=50, 100, 200, and 500 Hz. Four echoes were acquired for each FSL, with TSL=0, 10, 30, 70 ms. The total scan time was 10 min. The aforementioned T1ρ dispersion model was fitted to MAPSS T1ρ values for comparison with MRF. T1ρ dispersion MRF used the same sequence settings as in simulation but with matrix size 96x96x16 and a 2.5 minute scan time.
Results
Simulation results (Figures 1-3) show strong agreement between MRF and the ground truth reference values for T1, T2, and T1ρ dispersion ($$$a$$$). Phantom results (Figures 4-5) show similar trends as compared to the reference method, MAPSS, for T2 and T1ρ dispersion. Greater errors were observed at the high dispersion values for both simulation and physical phantom.Discussion
The feasibility of direct characterization of T1ρ dispersion by MRF was demonstrated. In simulation, strong agreement between ground truth and MRF estimated parameters was observed, however errors were greater for high T1ρ dispersion values. In phantom, generally good agreement between T1ρ dispersion maps derived from conventional T1ρ mapping and T1ρ dispersion MRF was observed, but with the highest dispersion values showing substantial errors for MRF, suggesting that sequence optimization would be needed depending on the range of values under investigation. T1ρ dispersion MRF may significantly reduce the required acquisition time as compared to conventional T1ρ dispersion collection at different spin-lock frequencies, and has the benefit of providing T1 and T2 maps in addition to T1ρ dispersion model parameters. The MRF T1ρ dispersion method will also enable reductions in radiofrequency pulse energy deposition or amplifier requirements as compared to conventional T1ρ dispersion acquisition methods. Thus, MRF may enable T1ρ dispersion characterization for a broader range of applications and system hardware. Dictionary size requirements pose memory and computational challenges given the wide range of T1, T2, and T1ρ dispersion values anticipated in practice. Deep learning-based dictionary generation7 and randomized SVD compression8 may address such dictionary related challenges. Further evaluation, including in vivo study and refinement of sequence and reconstruction parameters, is needed.Conclusion
A novel method for T1ρ dispersion characterization based on MR Fingerprinting was developed and feasibility was demonstrated in simulation and phantom. T1ρ dispersion MRF enables simultaneous quantification of T1, T2, and T1ρ dispersion as well as retrospective generation of T1ρ maps at any spin-lock frequency.Acknowledgements
This work was funded in part by the following sources: T32AR007505, K25AG070321. The content is solely the responsibility of the authors and does not necessarily represent the official views of the NIH.
References
1. Eck, B. L. et al. Quantitative MRI for Evaluation of Musculoskeletal Disease: Cartilage and Muscle Composition, Joint Inflammation, and Biomechanics in Osteoarthritis. Investigative Radiology (2022).
2. Yuan, J. & Wang, Y.-X. J. 1 T1rho MR Imaging. MRI: Physics, Image Reconstruction, and Analysis (2018).
3. Adelnia, F. et al. Tissue characterization using R1rho dispersion imaging at low locking fields. Magnetic Resonance Imaging 84, 1–11 (2021).
4. Sharafi, A., Zibetti, M. V., Chang, G., Cloos, M. & Regatte, R. R. 3D magnetic resonance fingerprinting for rapid simultaneous T1, T2, and T1ρ volumetric mapping of human articular cartilage at 3 T. NMR in Biomedicine (2022).
5. Eck, B. L. et al. 3D Cartesian T1rho Magnetic Resonance Fingerprinting Sequence Design for Evaluation of Cartilage and Skeletal Muscle in the Knee. ISMRM Annual Meeting (2022).
6. Liu, J. & Saloner, D. Accelerated MRI with CIRcular Cartesian UnderSampling (CIRCUS): a variable density Cartesian sampling strategy for compressed sensing and parallel imaging. Quant Imaging Med Surg 4, 57–67 (2014).
7. Yang, M., Jiang, Y., Ma, D., Mehta, B. B. & Griswold, M. A. Game of learning Bloch equation simulations for MR fingerprinting. arXiv preprint arXiv:2004.02270 (2020).
8. Yang, M. et al. Low rank approximation methods for MR fingerprinting with large scale dictionaries. Magnetic Resonance in Medicine 79, 2392–2400 (2018).
Figures
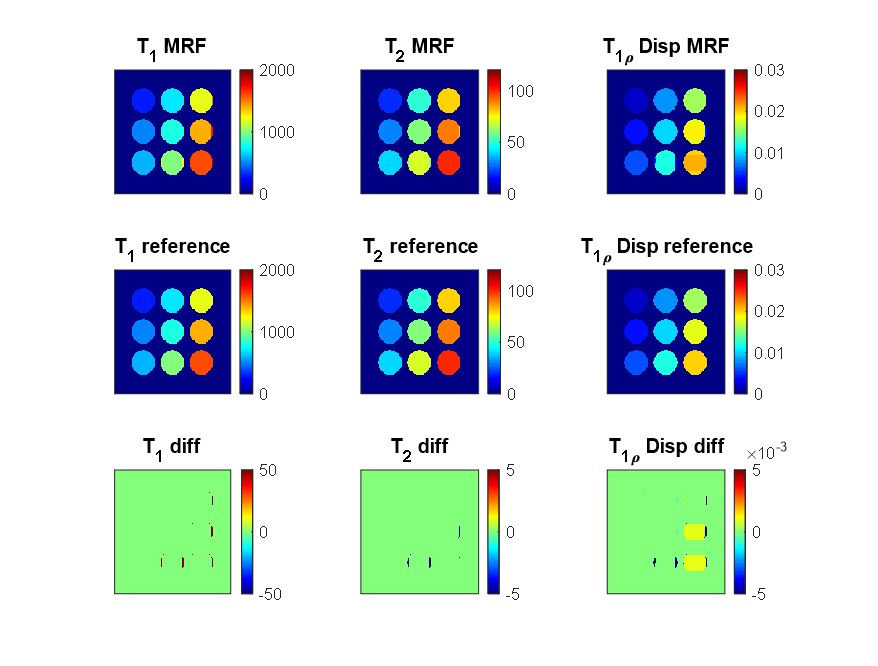
Figure 1. T1, T2, and T1ρ dispersion from MRF as compared to the ground truth reference. Units of T1 and T2 maps are ms, and units of T1ρ dispersion maps are (ms/Hz)1/2.
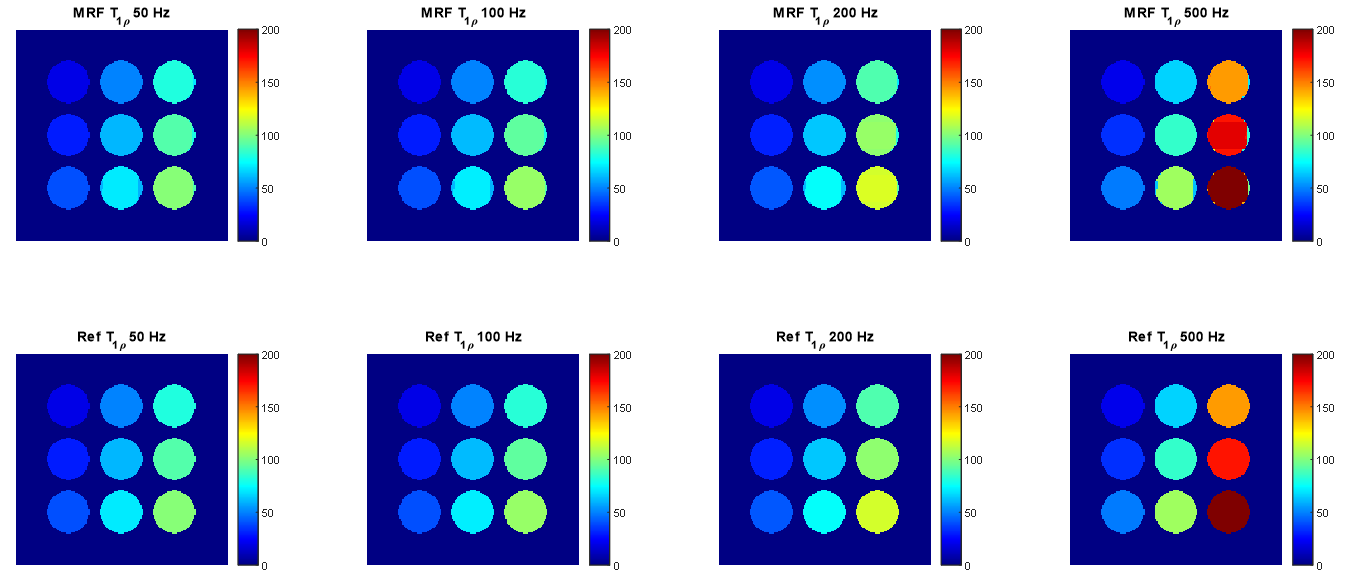
Figure 2. T1ρ maps retrospectively generated at FSL=50, 100, 200, and 500 Hz from MRF as compared to ground truth generated maps. Units of T1ρ maps are ms.
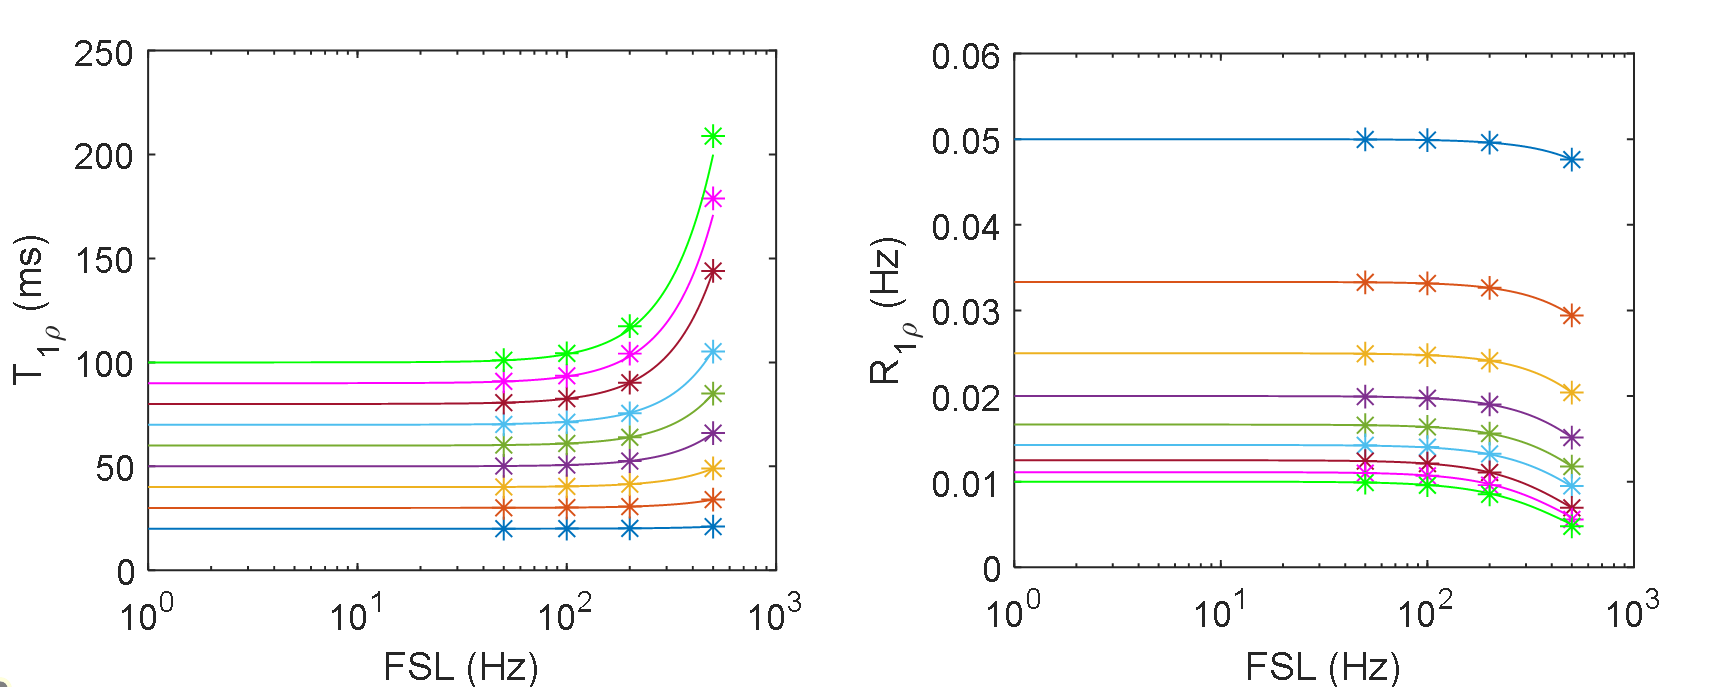
Figure 3. The measured T1ρ and R1ρ (R1ρ=1/T1ρ) in ROIs of the retrospectively MRF-derived maps (*) as compared to the ground truth dispersion curve (solid lines).
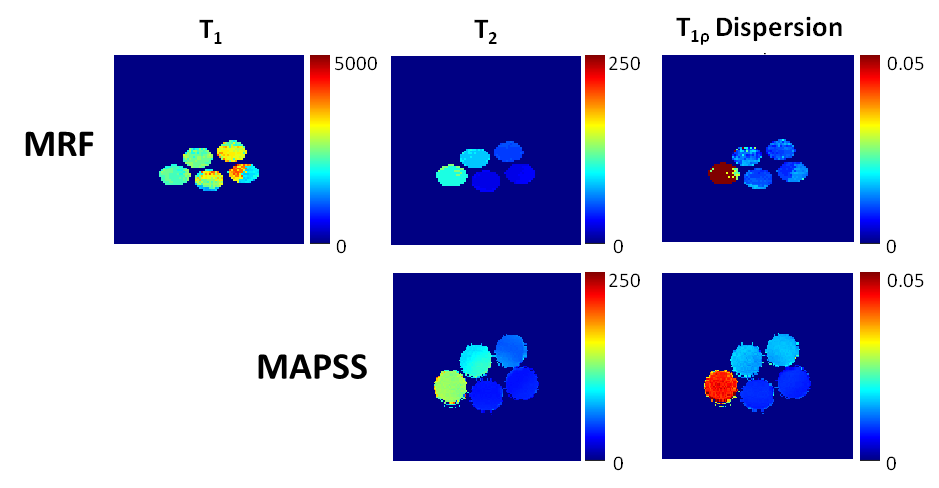
Figure 4. MRF estimated T1, T2, and T1ρ dispersion maps as well as MAPSS T2 and T1ρ dispersion maps for the agarose and glucose phantom. Units of T1 and T2 maps are ms, and units of T1ρ dispersion maps are (ms/Hz)1/2.
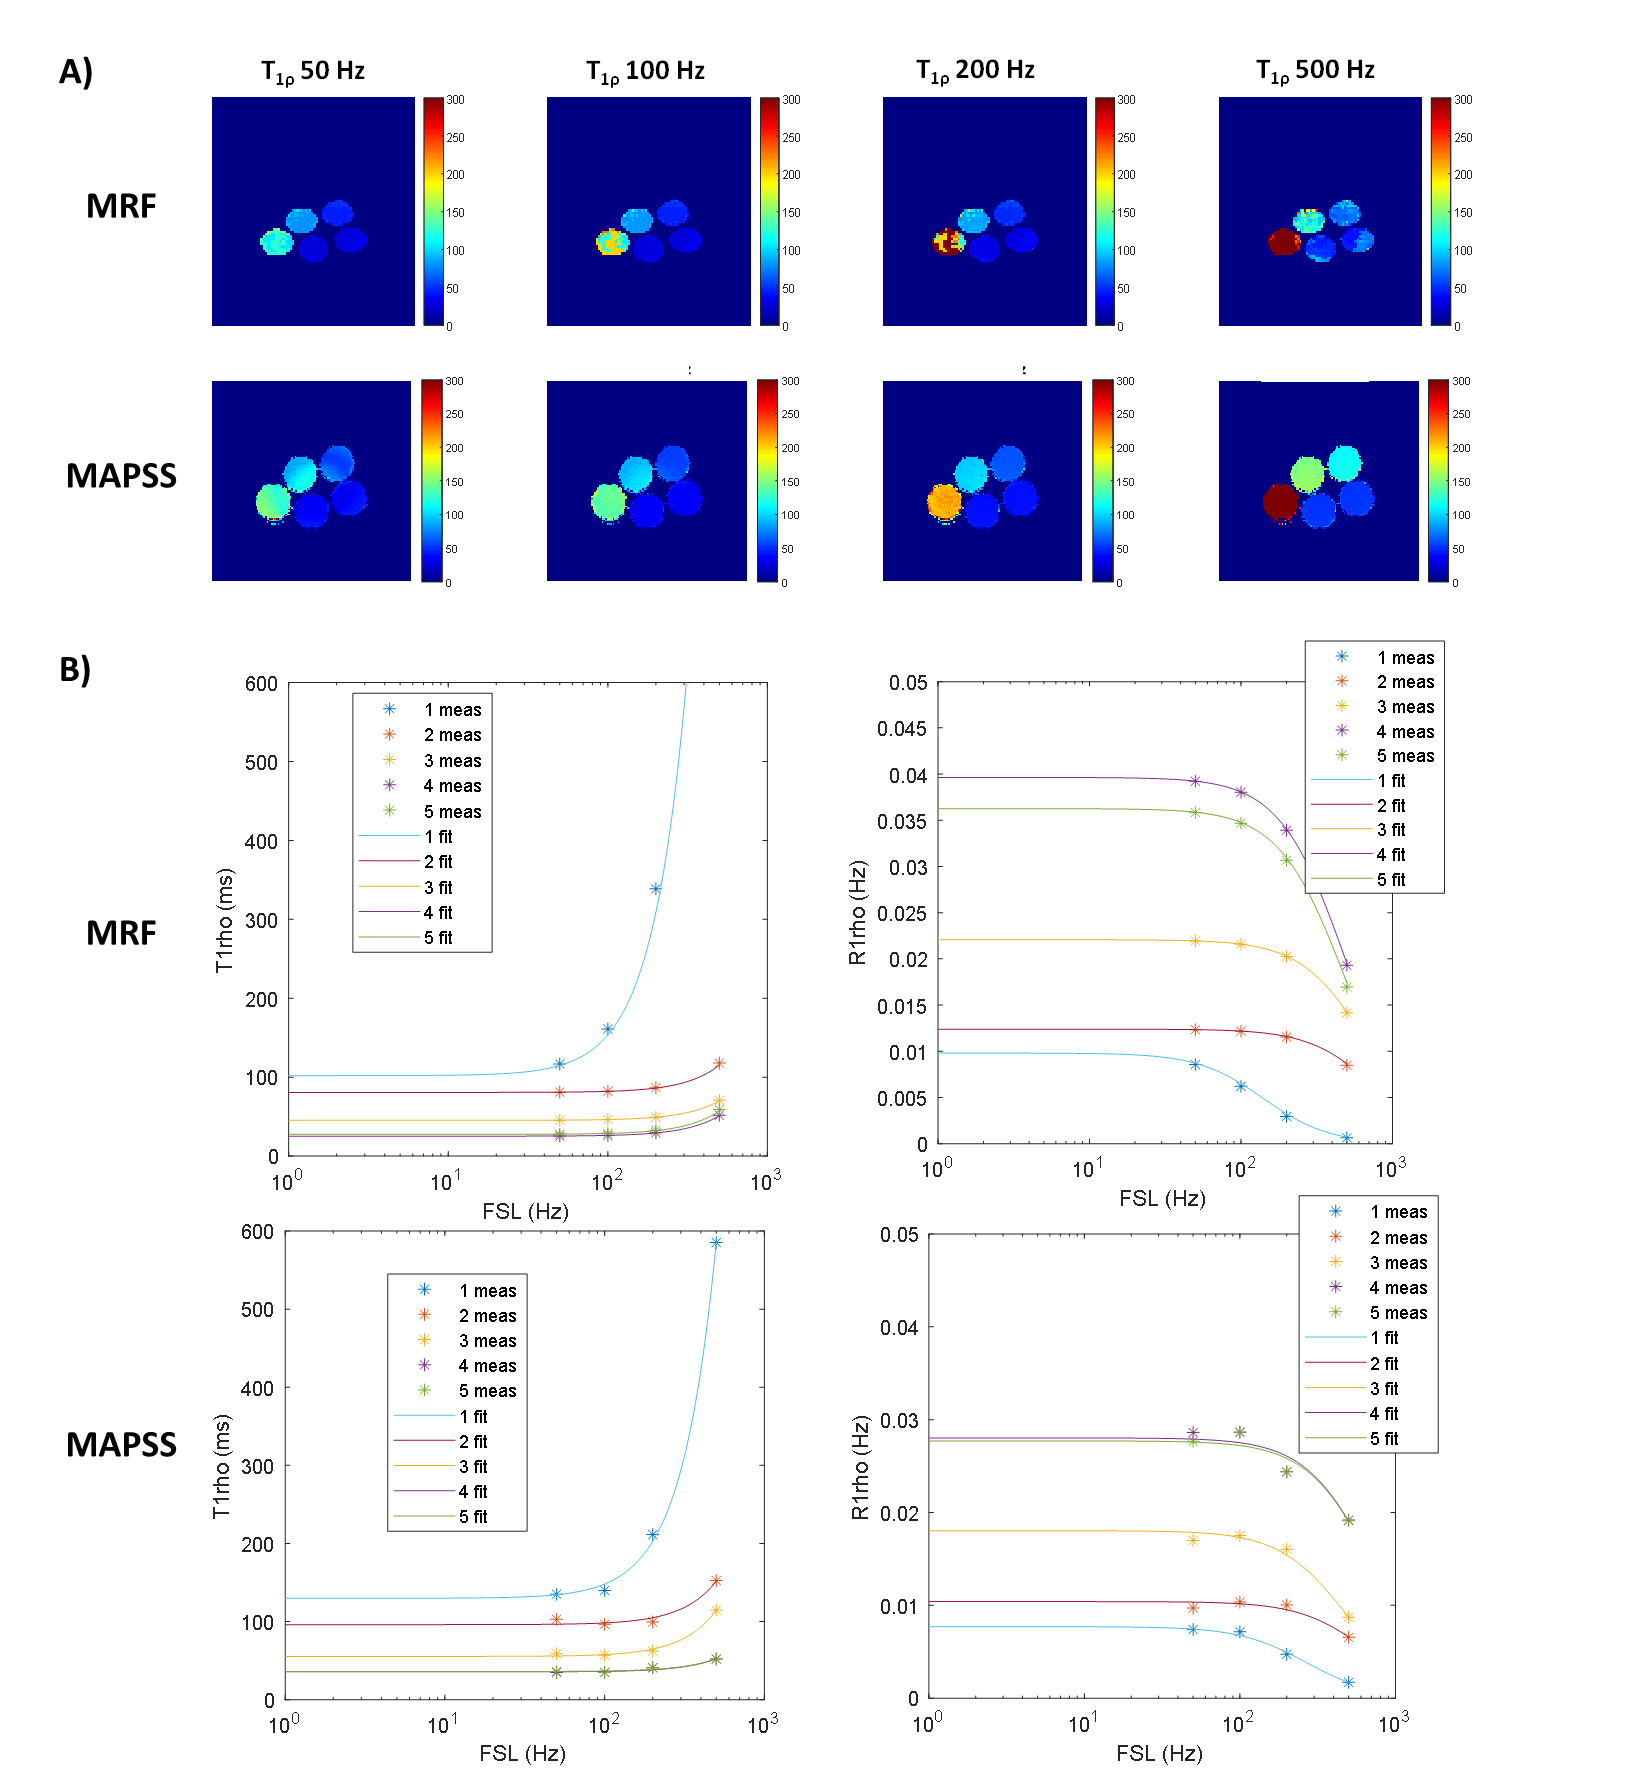
Figure 5. (A) Retrospectively generated MRF T1ρ maps as compared to T1ρ maps from MAPSS at corresponding FSL values, as well as (B) a comparison of T1ρ and R1ρ dispersion curves. Units of T1ρ maps are ms.