2187
The influence of diffusion in fast multi-parametric relaxometry
Miha Fuderer1, Oscar van der Heide1, C.A.T. van den Berg1, and Alessandro Sbrizzi1
1Division Imaging and Oncology, University Medical Center Utrecht, Utrecht, Netherlands
1Division Imaging and Oncology, University Medical Center Utrecht, Utrecht, Netherlands
Synopsis
Keywords: MR Fingerprinting/Synthetic MR, Relaxometry
In MRF, it has been established – but often ignored – that the presence of diffusion causes bias in the estimated T2. We measure this effect in MR-STAT. Thereby we confirm the theoretical model that the bias is proportional to the square of T2. We also find that the bias level strongly depends on the RF sequence used. This opens the prospect of optimizing sequences on minimal diffusion-induced bias in T2.Introduction
In MR-Fingerprinting1 (MRF), it has been established that the presence of diffusion influences the estimated T2 value2,3, an effect that is mostly – but doubtfully – ignored. In MR-STAT4, we can expect similar effects. Unfortunately, the findings by Kobayashi2 are not immediately applicable to MR-STAT because of a substantial difference in TR; Freed3 is not directly applicable since it estimates the effect on the acquired signal. In this work, we estimate the diffusion-induced bias on the reconstructed T2 map. We show that the diffusion-induced T2 bias strongly depends on the applied RF flip angle sequence and therefore hypothesize that sequence design might mitigate this bias.Theory
In fast multi-parametric relaxometry (e.g. MRF or MR-STAT), in good approximation, the effect of diffusion is expected to depend on the net integral of the gradient between successive excitations. Quoting Freed3 eq.(14):$$$T_{\text{2eff}}^{-1}(p)\approx T_2^{-1}+\frac{p^2}{3T_D}$$$ (1)
where $$$T_{\text{2eff}}$$$ is the effective relaxation time, $$$p$$$ is the EPG mode5 and $$$T_D$$$ is a characteristic value given by $$$T_D\equiv(D\gamma^2 g^2 T_R^2)^{-1}$$$, with $$$D$$$ the diffusion constant (which we measured to be (2.1±0.2)µm2/ms for gel vials); for our purpose, $$$(gT_R)$$$ is interpreted as the net gradient area between two successive RF pulses. In default MR-STAT scans, $$$(gT_R)$$$ is on the order of $$$30\text{ms}\frac{\text{mT}}{\text{m}}$$$, so $$$T_D$$$ is on the order of 10s, i.e. much larger than $$$T_2$$$. This allows re-writing eq.(1) as $$$T_{\text{2eff}}(p)-T_2 \approx -\frac{p^2}{3T_D}T_2^2$$$. The left-hand side hereof could be seen as the bias to $$$T_2$$$, if $$$p$$$ were the only EPG state occupied during all of the measurement. Yet, in practice, non-balanced sequences continuously exhibit a varying mix of many EPG states. Without mathematical rigor, we model the total T2-bias of a sequence as $$$T_{\text{2eff}}-T_2 \approx -T_D^{-1}T_2^2 S$$$, with the “Sequence-dependent factor” $$$S=\sum{m(p)\frac{p^2}{3}}$$$ and $$$m(p)$$$ is the average occupancy of state $$$p$$$ during the sequence.
Re-expanding $$$T_D$$$, we model the bias as being proportional to $$$D\gamma^2 (gT_R)^2 T_2^2 S$$$, i.e., proportional to
- The diffusion coefficient
- The square of the spoiling gradient area
- $$$T_2^2$$$
- A sequence-dependent unitless factor
$$$S$$$.
Methods
For known values of $$$d$$$, $$$(gT_R)$$$ and $$$T_2$$$, we would like to establish the sequence-dependent bias factor $$$S$$$. Since it is difficult to reliably measure $$$(T_{\text{2eff}}-T_2)$$$, we define a pair of scans that differ only in spoiling gradient area. The reconstructed T2 maps are called $$$T_{\text{2,FS}}$$$ (Full Spoiling) and $$$T_{\text{2,HS}}$$$ (Half Spoiling) respectively. Consequently, we have $$$(gT_R)_{\text{HS}}^2 \approx \frac{1}{4} (gT_R)_{\text{FS}}^2$$$ and so we can model $$$T_{\text{2,HS}}-T_{\text{2,FS}}\approx D\gamma^2 \left({(gT_R)_{\text{FS}}^2-\frac{1}{4} (gT_R)_{\text{FS}}^2}\right)T_2^2 S$$$.By measuring $$$T_{\text{2,HS}}-T_{\text{2,FS}}$$$, we can calculate $$$S$$$ and we can estimate the bias $$$T_{\text{2eff}}-T_2$$$ as $$$-\frac{4}{3}(T_{\text{2,HS}}-T_{\text{2,FS}})$$$.
In our experiments, we made use of the Eurospin phantom6, which consists of 12 gel-vials with different relaxation properties. The base sequence consisted of a single-slice Cartesian pseudo-SSFP sequence on a 3T scanner (Philips Elition), with TR=10ms, TE=5ms, voxel size 1mm x 1mm, slice thickness of 5mm, with a FOV of 224mm, requiring 224 phase-encoding steps. The set of phase-encoding steps was repeated 6 times, allowing MR-STAT reconstruction of proton density, T1 and T2 maps. In total, 1344 readout-lines were acquired in 13.4 seconds.
For performance analysis, this base sequence was acquired 10 times (with 5s pause in-between), which led to 10 separate reconstructions; this enabled the calculation of the noise level at each pixel and it allowed to boost the precision of the outcome by $$$\sqrt{10}$$$.
To investigate the dependence of the diffusion-induced bias on the flip-angle train, the acquisitions were repeated for 6 different RF-pulse sequences. See figure 1A-F.
Results
As an example, figure 2 shows the reconstructed maps of RF sequence A for the two spoiling levels as well as their difference. Note the difference in T2. The difference in measured T1 values was not significant.Figure 3 shows, for the 6 different RF sequences, the difference between $$$T_{\text{2,FS}}$$$ and $$$T_{\text{2,HS}}$$$ against $$$T_{\text{2,HS}}^2$$$. For most sequences, a linear relationship between $$$\Delta T_2$$$ and $$$T_2^2$$$ is apparent, highlighting the quadratic dependence between $$$\Delta T_2$$$ and $$$T_2$$$ as predicted in the Theory. The slopes were measured to have values between -0.36s-1 and -0.053s-1; corresponding to values of $$$S$$$ of 3.5 and of 0.51. These values clearly depend on the sequence (see also figure 4). For e.g. sequence B (slope of -0.36s-1, $$$S=3.5$$$), for a T2-value of 200ms, the difference between the measured T2 values is about $$$(0.2\text{s})^2\cdot (-0.36\text{s}{-1})=14.4\text{ms}$$$; the estimate of the bias is $$$\frac{4}{3}$$$ times that value, i.e. close to 20ms.
Discussion
Diffusion causes bias in reconstructed T2. This bias can be substantial, up to 10% in our setup. Yet, in vivo, due to lower $$$D$$$ and T2, we may expect less than 5%. A very interesting finding is that this depends strongly on the sequence, e.g. the bias of RF sequence E is seven times lower than sequence B. Therefore, we hypothesize that sequences could be designed to mitigate that bias, by modelling the diffusion-sensitivity and optimizing thereupon.Conclusion
As previously shown for MRF, also in MR-STAT diffusion influences the estimated T2. The diffusion-induced mis-estimate increases with $$$T_2^2$$$ and strongly depends on the RF-sequence applied. This opens the prospect of designing a sequence to mitigate the diffusion-induced bias.Acknowledgements
This work has been financed by NWO grant number 17986References
- D. Ma, et al. Magnetic resonance fingerprinting. Nature, 2013;495187–495192.
- Y. Kobayashi, Y. Terada. Diffusion-weighting caused by spoiler gradients in the fast imaging with steady-state precession sequence may lead to inaccurate T2 measurements in MR fingerprinting. Magnetic Resonance in Medical Sciences, 18(1) pp. 96-104, 2019.
- D. Freed et al. Steady-state free precession experiments and exact treatment of diffusion in a uniform gradient. The Journal of Chemical Physics 2001(115), pp. 2057.
- A. Sbrizzi, et al, “Fast quantitative MRI as a nonlinear tomography problem”, Magnetic Resonance Imaging 46(2018): 56-63.
- Weigel M. Extended phase graphs: dephasing, RF pulses, and echoes-pure and simple. Journal of Magnetic Resonance Imaging. 2015;41(2):266-295.
- TO5, Eurospin II test system, Scotland
- X. Wang, D. Hernando, S.B. Reeder. Phase-based T2 mapping with gradient echo imaging. Magnetic resonance in medicine 84.2 (2020): 609-619.
- H. Liu, et al. Increasing the T2 sensitivity of MR-STAT sequences by small quadratic RF phase increments, Proc. Intl. Soc. Mag. Reson. Med. (2022), 0625
Figures
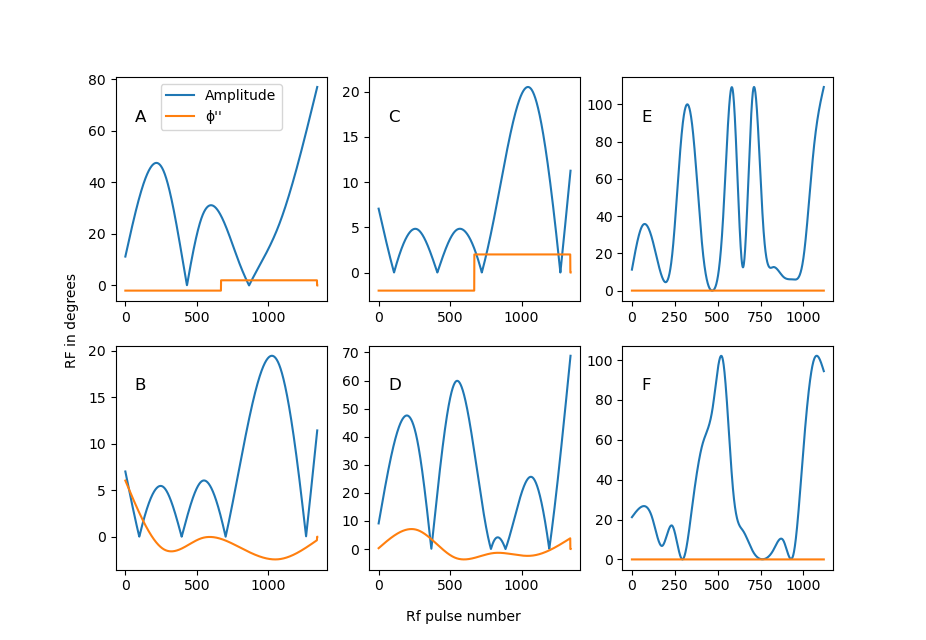
Fig.1:
Six different flip-angle sequences. In blue
is the amplitude (in degrees), the increment of the phase-increment from pulse
to pulse is shown in orange, also in degrees7,8. (The details of the
optimization process leading to these sequences is beyond the scope of this
abstract).
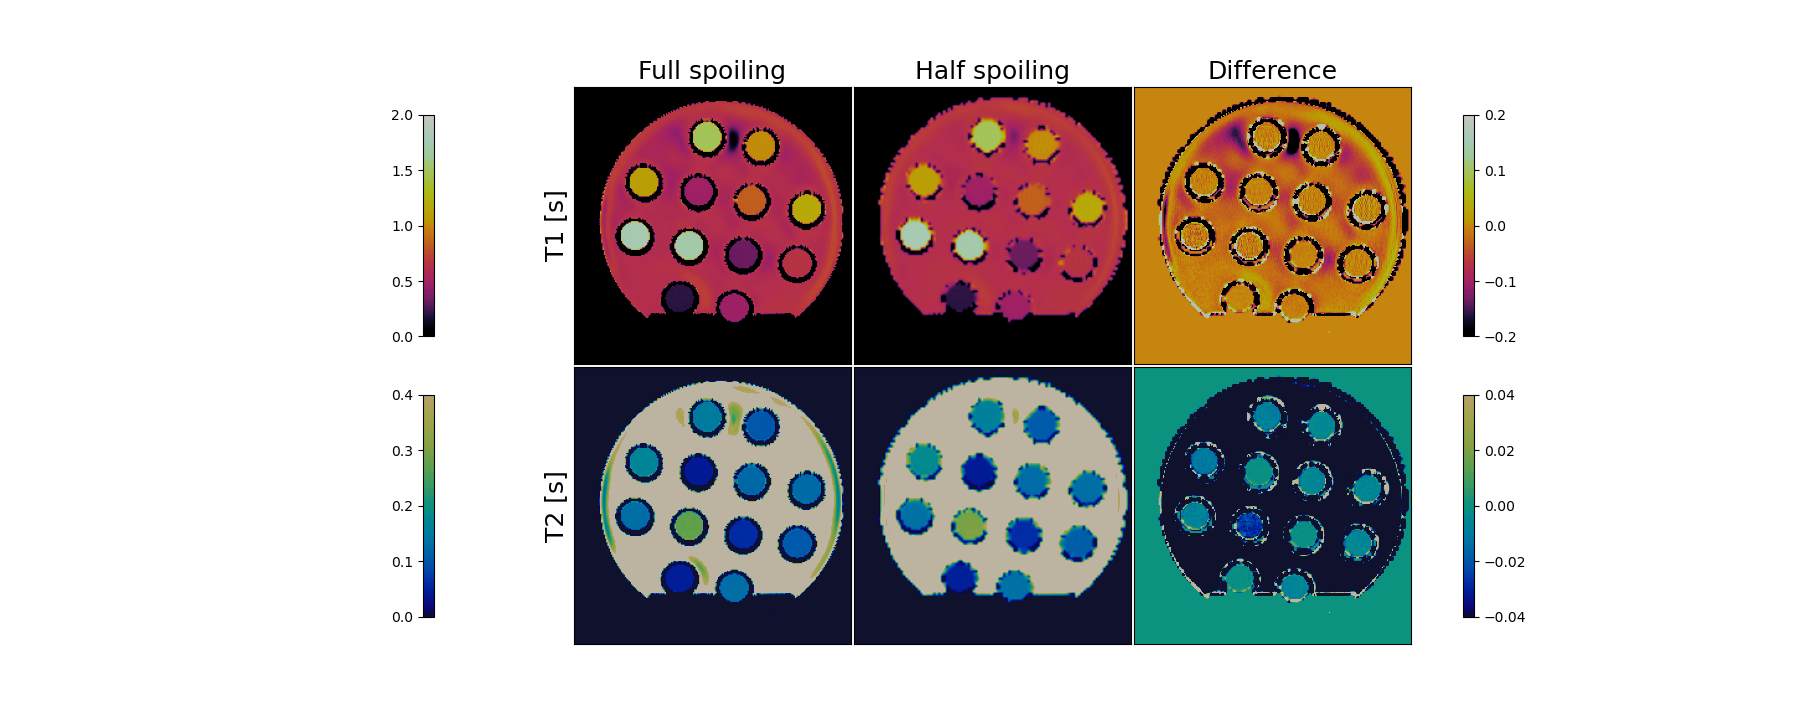
Fig. 2:
Example of reconstructed relaxation maps, (RF
sequence A), for the two different spoilings and the mutual difference. T1 maps
are in the top row, T2 maps in the bottom row.
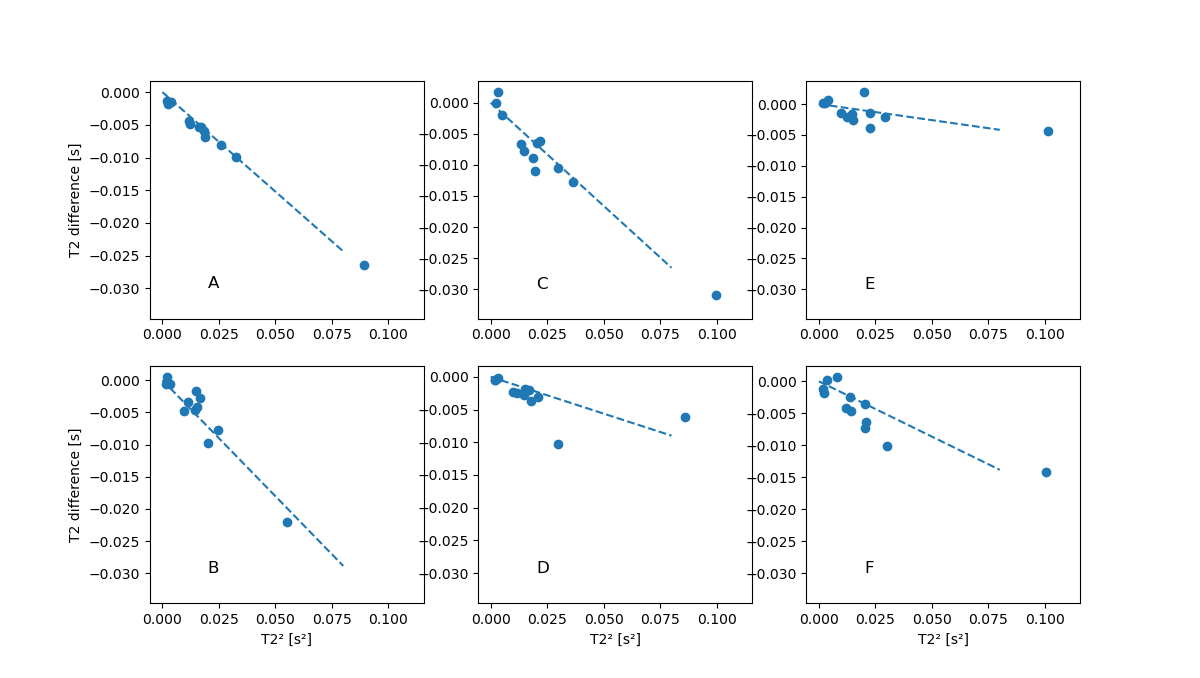
Fig. 3:
For the six different sequences, the
difference between $$$T_{\text{2,FS}}$$$ and $$$T_{\text{2,HS}}$$$, plotted
against $$$T_{\text{2,FS}}^2$$$, for the
12 vials. For each sequence, a linear relationship between $$$\Delta T_2$$$ and $$$T_2^2$$$ is expected ($$$\Delta T_2$$$ depends quadratically on $$$T_2$$$). The
dotted lines are the best fitting slopes, displayed at the same scale to
emphasize the difference between sequences.
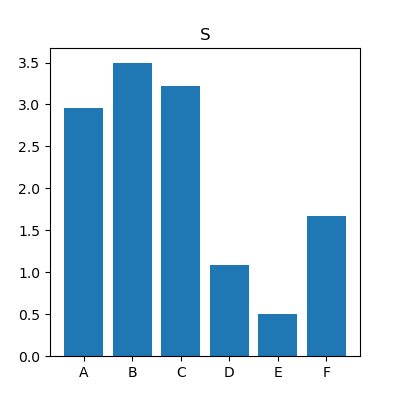
Fig. 4: For the six different RF sequences, the mean
value of the sequence-dependent bias factor $$$S$$$. For
sequence E, this factor is seven times lower than for B, which indicates that diffusion
will affect a T2-estimate seven times less in sequence E than in sequence B.
DOI: https://doi.org/10.58530/2023/2187