2185
Neural Network-Based Removal of Colored Noise in MR Fingerprinting1Philips Reseach, Hamburg, Germany, 2Department of Radiology, Cincinnati Children's Hospital Medical Center, Cincinnati, OH, United States
Synopsis
Keywords: MR Fingerprinting/Synthetic MR, MR Fingerprinting
A neural network for the estimation and removal of colored noise in non-Cartesian MRI is trained and subsequently applied for denoising coefficient images in MR Fingerprinting. It is shown that the neural network does not introduce bias in the quantitative parameter maps and improves their precision. Invivo T1- and T2-maps are demonstrated to be visually improved.Introduction
Deep-learning approaches have great potential in medical image denoising showing improvements over classical methods1,2. In supervised learning, models in the form of convolutional neural networks (CNNs) are trained to remove noise from input images by presenting the model with noisy images and their noise-free counterparts during the training phase. This process is straightforward in the case of Cartesian MRI where the noise manifests as independent complex Gaussian noise. In contrast, non-Cartesian MRI exhibits colored noise, necessitating a method to train neural networks to detect and remove random contributions from the corresponding non-trivial noise power spectrum (NPS). This work reports on the training and application of a neural network for estimating and subtracting the colored noise arising in non-Cartesian spiral MR Fingerprinting data.Methods
Noisy images were created injecting noise in the measurement process similar to Ref3. To ensure the network learns the characteristics of the noise instead of features deriving from the measurement model, target images were created in the same way but without adding noise. The denoising model was trained in residual learning mode, i.e. the network outputs an estimate of the noise in the input image. The denoising framework also comprised a frequency split, meaning that the CNN was trained to operate on the high-frequency part of the input images only, assuming that the high-frequency part is unaffected by image contrast and contains all the noise to be removed from the image. Based on these training data, a bias-free denoising CNN (BF-DnCNN)2 was trained on image patches using ADAM optimizer4 with mean-error (L1) loss.Phantom measurements (HPD System Phantom Model 130) were performed on a 3T scanner (Ingenia, Philips) with a 15-channel head-coil using a multi-slice gradient-spoiled MRF sequence with N=625 excitation pulses6 following an inversion pulse with following sequence parameters: FOV=224mm, TR=12ms, TE=3ms, voxel-size=1.0mm, slice-thickness=4mm, spiral acq-window=5.8ms, num spiral interleaves=36. Comparable brain images were acquired in pediatric patients at Cincinnati Children’s Hospital Medical Center (CCHMC) on a 1.5T scanner (Ingenia, Philips) with 15 channel headcoil as part of an ongoing IRB approved study. Multi-slice gradient-spoiled MRF with N=500 RF pulses5 following an inversion pulse was used with the following sequence parameters: FOV=224mm, TR=20ms, TE=3ms, voxel-size=1.0mm, slice-thickness=4mm, spiral acq-window=13.7ms, num spiral interleaves=18. Reconstruction was performed using non-iterative low-rank inversion to obtain coefficient images. Briefly, coefficient images $$$\hat{x}$$$ were computed using $$\hat{x}=E^H(SV)^{-1}wy,$$ where $$$y$$$ is the non-Cartesian undersampled k-space data, $$$w$$$ the density compensation weights, $$$E$$$ is the non-Cartesian measurement operator including coil-sensitivities and non-uniform FFT, $$$V$$$ is the temporal subspace basis and $$$S$$$ the selection operator, which determines for which timepoints along the MRF signal a given k-space location is measured. Finally, the denoising network was applied separately to the real and imaginary components of the coefficient images, and the resulting noise estimate partially (75%) subtracted. Dictionary matching was performed in the compressed domain to obtain T1- and T2-maps. For comparison, dictionary matching was also performed without denoising of the coefficient images. The effect of the denoising network on coefficient images and matched T1 and T2 maps was assessed quantitatively within the spherical probes of the T2 plane5 of the phantom.
Results
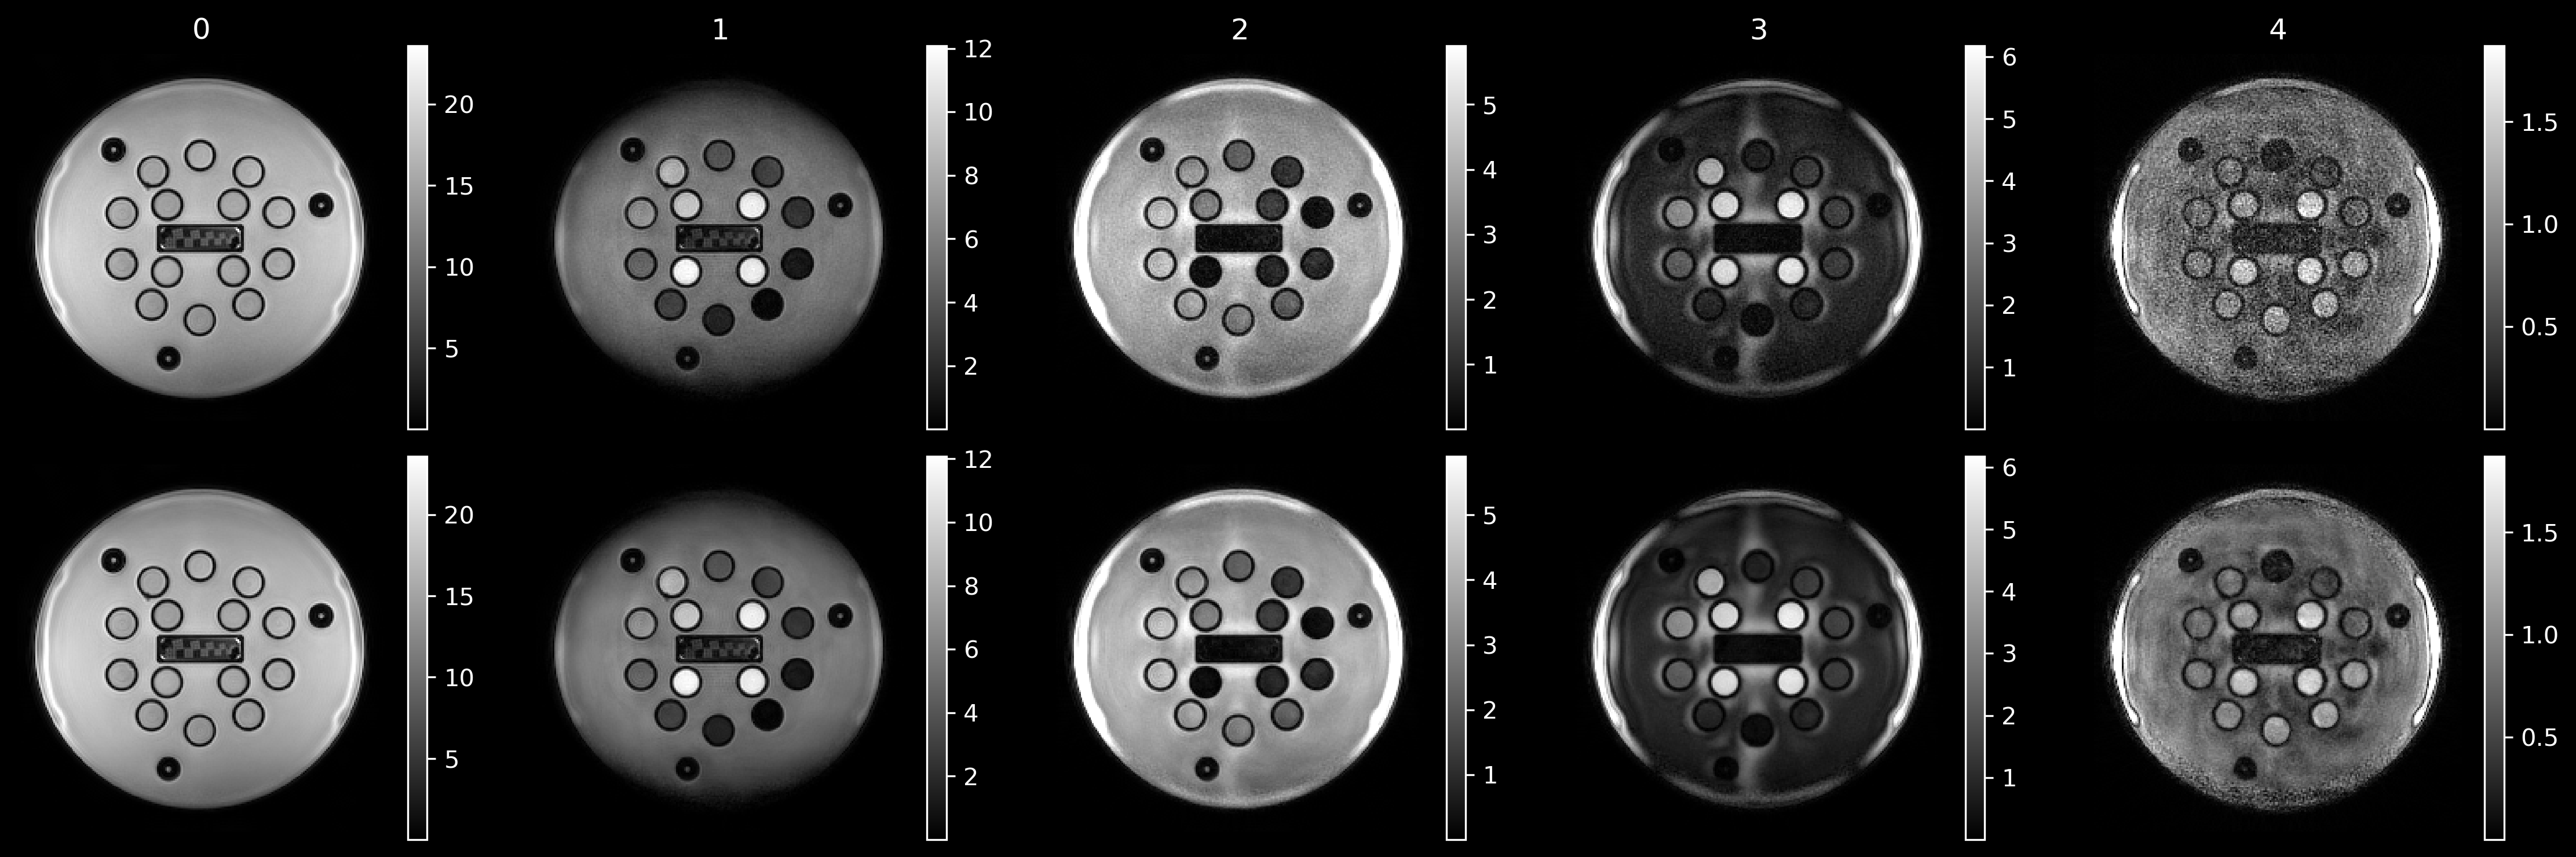
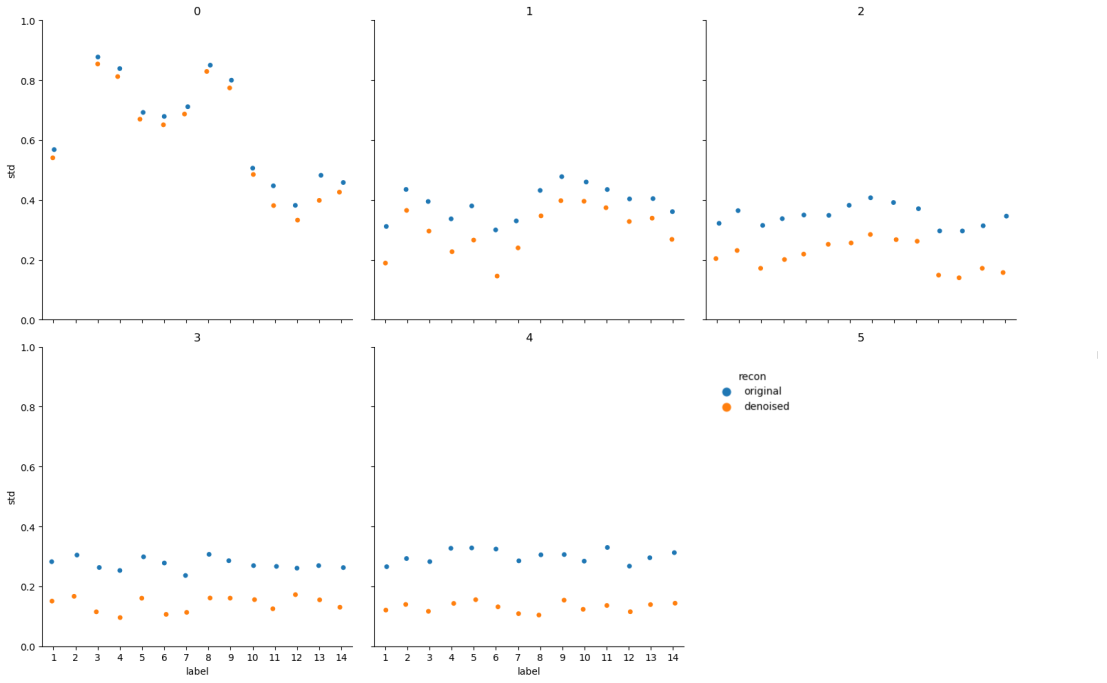
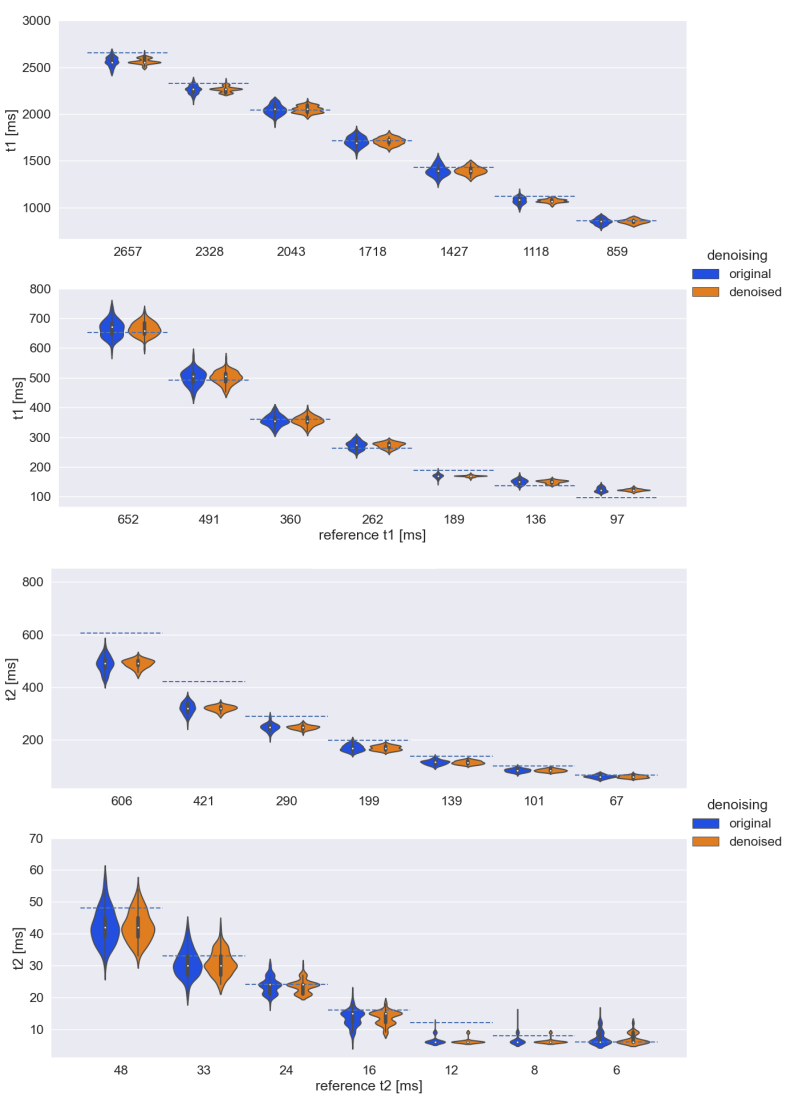
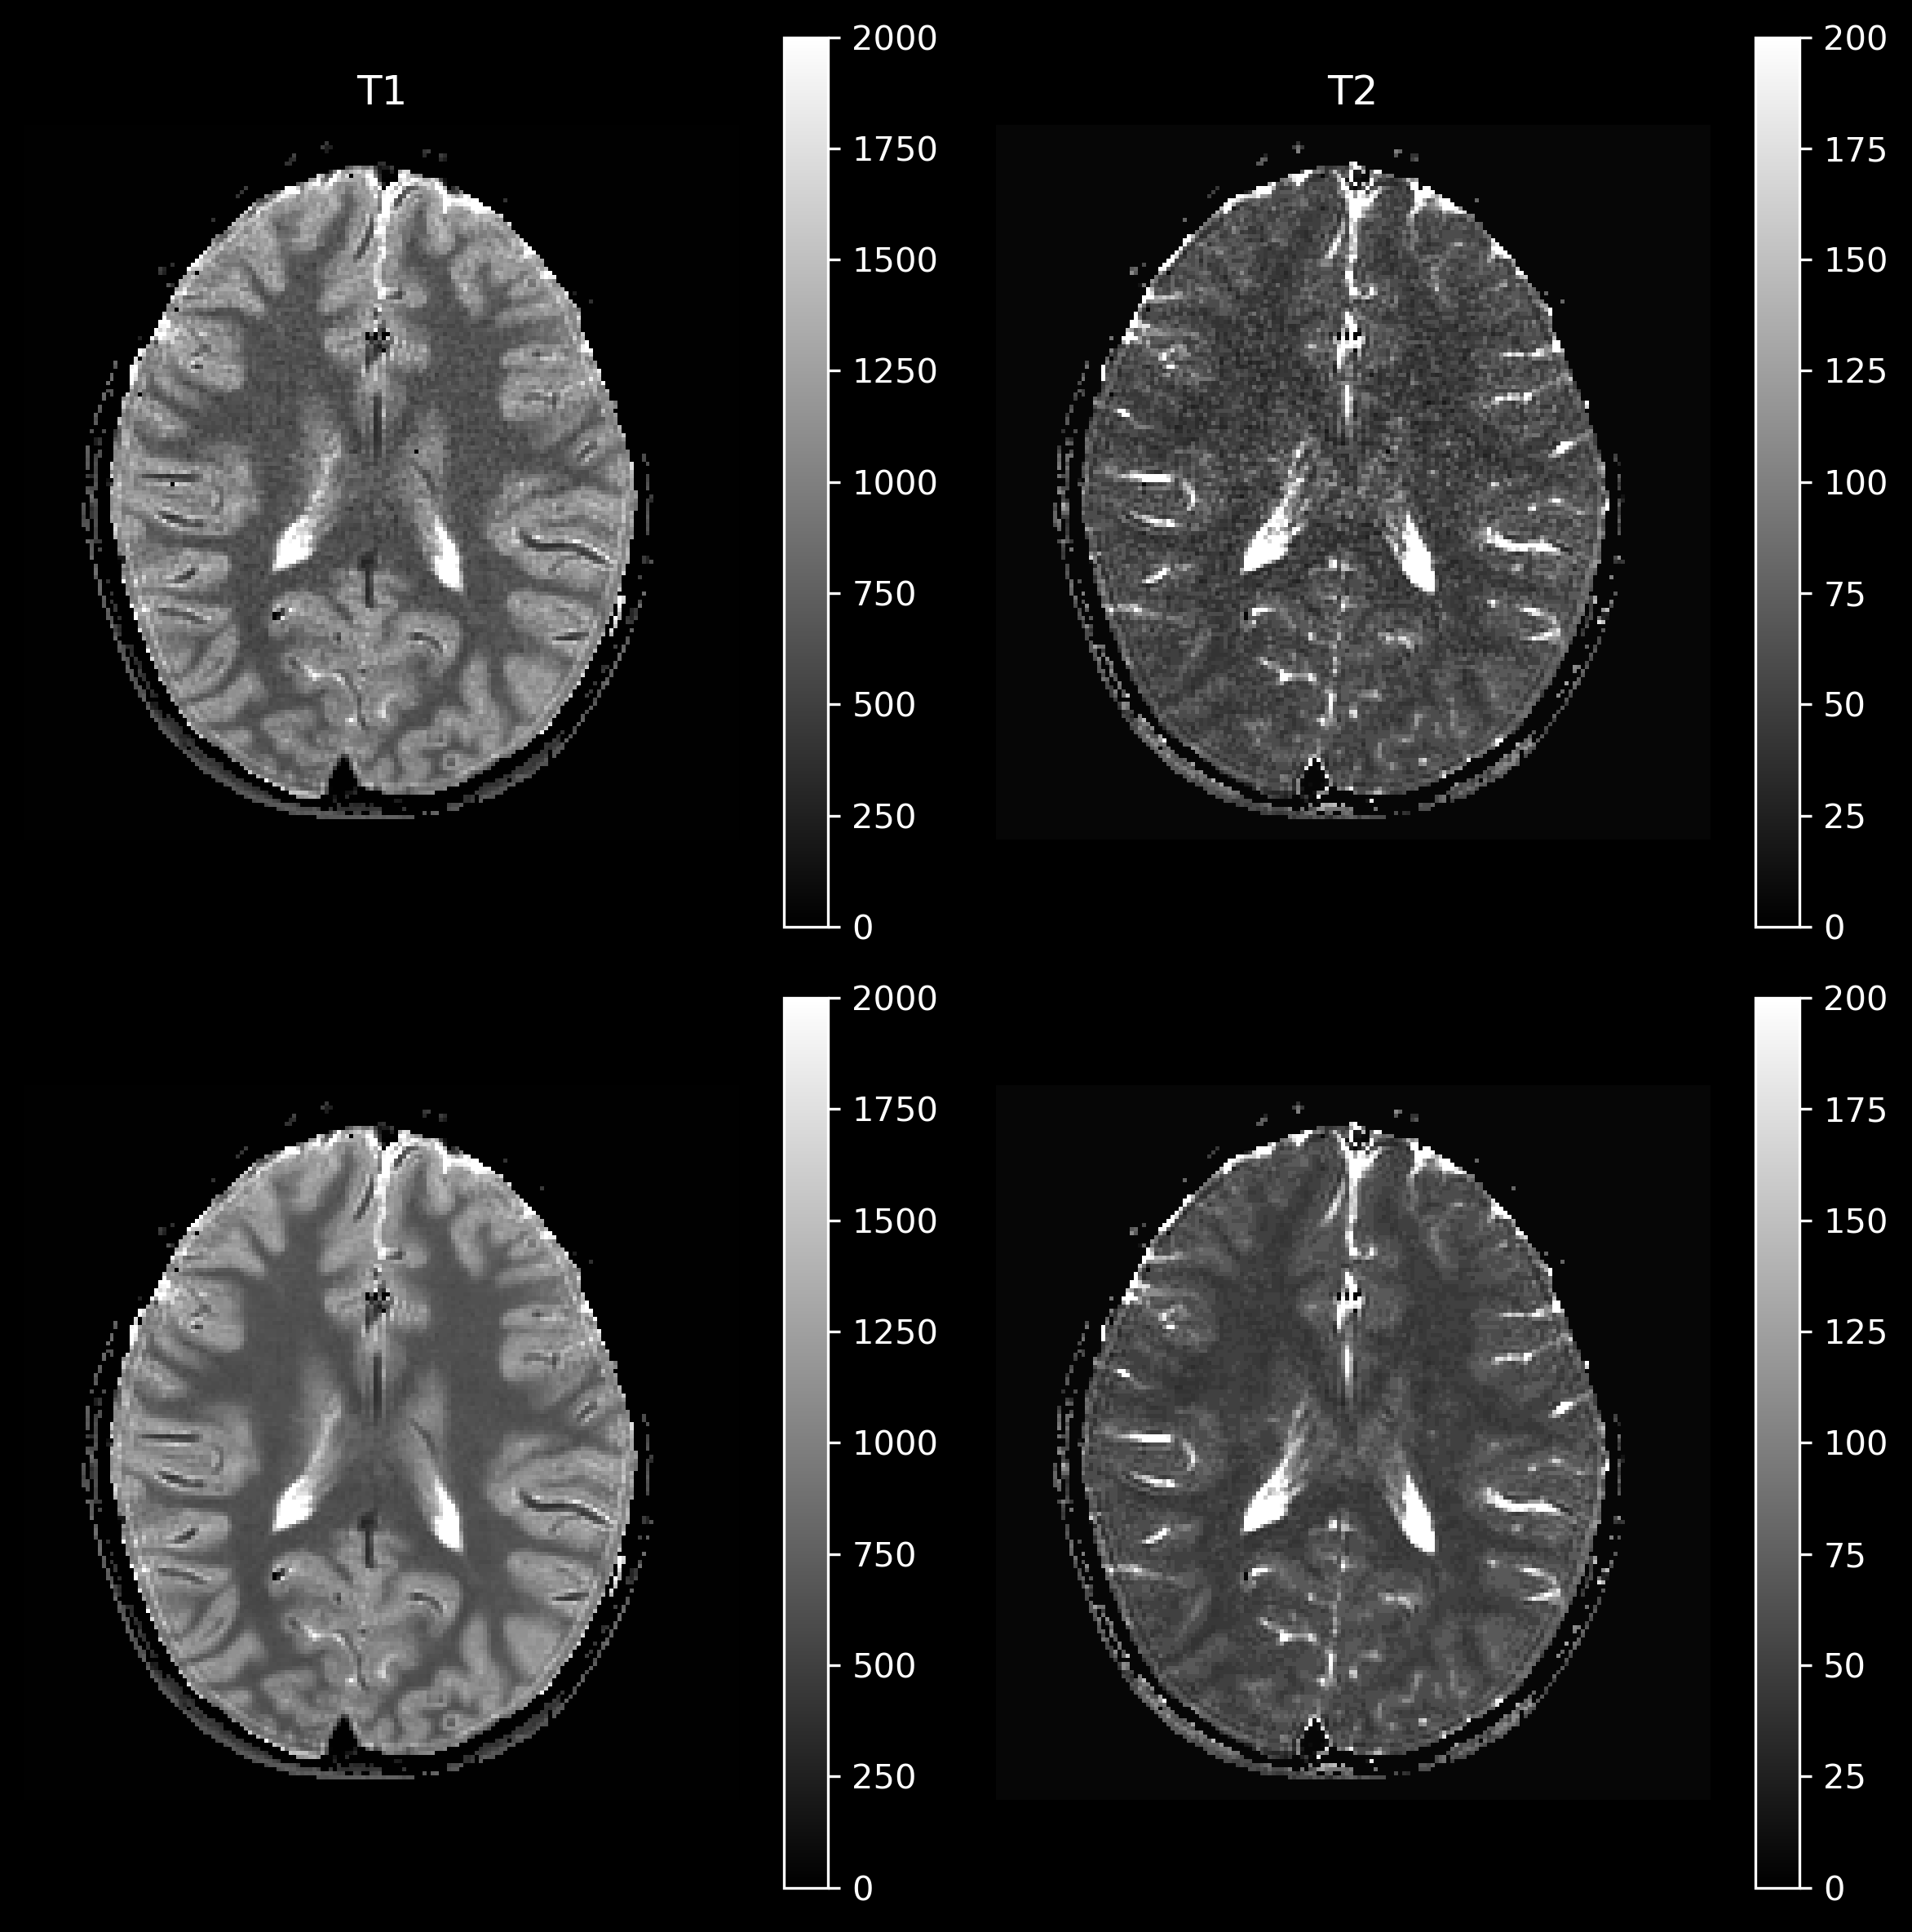
Figure 1 shows the coefficient images with and without denoising. A clear reduction of the noise can be observed for the images for coefficient numbers 2-4, which contain decreasingly less signal. This is also apparent in Figure 2, showing the standard-deviation of the complex signal within the 14 segmented probes for all coefficient images. Figure 3 shows the statistical distribution of matched T1 and T2 values for each segmented probe, demonstrating that the denoising network does not introduce a bias in the matched quantitative values. Furthermore, the distribution of matched quantitative values is narrower for all probes when using the denoising network, indicating an improved precision of the measurement. Finally, Figure 4 shows invivo T1 and T2 maps from a brain scan. Both quantitative maps show an improved visual appearance when using the denoising network, with a particularly strong effect in the T2 map.Discussion and Conclusion
The results presented here demonstrate that a denoising network tailored to remove the colored noise arising in non-Cartesian spiral MRI can be used to significantly reduce the noise contribution in MRF coefficients maps. The amount of denoising can be chosen flexibly and adapted to the situtation. The application of the used denoising network does not introduce any bias in the estimates of quantitative relaxation parameters in phantom experiments. Furthermore, denoising leads to a marked increase in the SNR of parameter estimation as seen in the reduced width of the distribution of matched values within the spherical probes of the phantom. Quantitative relaxation maps in patients have been shown to be visually improved.Acknowledgements
No acknowledgement found.References
1. Zhang, K., Zuo, W., Chen, Y., Meng, D., and Zhang, L. (2017). Beyond a Gaussian denoiser: Residual learning of deep CNN for image denoising. IEEE Trans. Image Process 26(7):3142-3155.
2. Mohan, S., Kadkhodaie, Z., Simoncelli, E. P., and Fernandez-Granda, C. (2020) Robust and interpretable blind image denoising via bias-free convolutional neural networks. https://arxiv.org/abs/1906.05478
3. Robson, P et al, Comprehensive quantification of signal-to-noise ratio and g-factor for image-based and k-space-based parallel imaging reconstructions, MRM 60, 895 (2008), doi:10.1002/mrm.21728
4. Kingma, D. K., and Ba, J. (2017) Adam: A Method for Stochastic Optimization. https://arxiv.org/abs/1412.6980
5. Sommer, K et al, Magn Reson Imaging 41, 7 (2017), doi:10.1016/j.mri.2017.06.015
6. Stupic et al, MRM 86, 1194 (2021), doi:10.1002/mrm.28779
Figures