2180
Magnetisation Transfer effects on T1 and T2 values in MR Fingerprinting1Imperial College London, London, United Kingdom, 2Institute of Cancer Research, London, United Kingdom, 3Siemens Healthcare Ltd, Frimley, United Kingdom, 4London Institute of Medical Sciences, Medical Research Council, London, United Kingdom, 5Independent Researcher, Norwich, United Kingdom, 6UK Dementia Research Institute Centre for Care Research and Technology, London, United Kingdom, 7Imperial College Healthcare NHS Trust, London, United Kingdom, 8University College London, London, United Kingdom
Synopsis
Keywords: MR Fingerprinting/Synthetic MR, Magnetization transfer
A fingerprinting sequence was developed with and without off resonance pulses before every TR to investigate MT effects on T1 and T2 values. Off-resonance pulses suppress MT effects by saturating signal from free protons that exchange with bound protons. Observed T2 values increased with off resonance pulses as expected. Observed T1 values decreased, this was an opposite effect to what was observed previously with a different pulse sequence.Introduction
Quantitative MRI shows great promise in more sensitively and objectively assessing neurological disease and its progression. Magnetic Resonance Fingerprinting (MRF) enables rapid quantitative relaxometry in a clinically applicable timeframe. However, a prototype MRF sequence has been shown to underestimate T1 and T2 when compared with Variable Flip Angle (T1) mapping and Multi-Echo Spin-Echo (T2) mapping in brains of healthy volunteers1 and brain tumour patients2, especially in white matter regions, where MT effects occur. This bias was not observed in NIST phantom studies3. It is crucial to understand factors other than T1 and T2 that influence a fingerprint signal evolution if maps are to be interpreted quantitatively.In previous work, we demonstrated T1 values increased in white matter regions by 70% when 180° pulses at a frequency offset of 2000 Hz were applied throughout an MRF acquisition with 409 images4. Due to a poor encoding of T2 in the dictionary, T2 effects could not be evaluated. Here, we have improved encoding of T1 and T2 encoding by including an adiabatic inversion at the beginning of the sequence, and using more flip angles and repetition times, updating the MRF acquisition to 828 images. Dictionary fitting has also been improved by adding B1 and slice-profile correction.
Methods
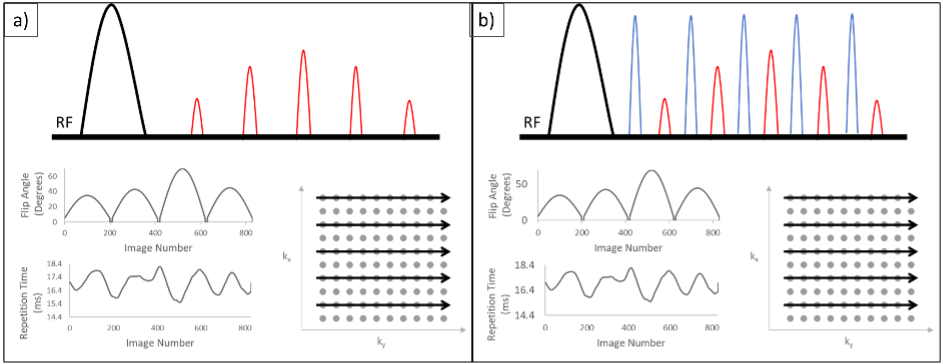
A FISP 2D cartesian MRF sequence with and without off resonance pulses before every readout was developed in house with varying flip angles and repetition times based on schedules reported by Jiang et al5. After an adiabatic inversion pulse, a series of FISP acquisitions were acquired with a sinusoidal variation of flip angles (FA) and repetition times (TR) in a Perlin noise pattern. The FOV was 300 and the acquisition matrix was 128 x 128. 64 lines of k space per image were acquired with GRAPPA-2 acceleration. A schematic of the pulse sequence is included in Figure 1.A total of 828 contrasts with a slice thickness of 5mm were acquired to reconstruct a timeseries of complex images. The off-resonance pulse was 180° with a frequency offset of 2000Hz. Data acquisition with and without the off-resonance pulses was performed on a Siemens MAGNETOM Prisma 3 Tesla system (Siemens Healthineers, Erlangen Germany). Initial investigations were performed on the NIST phantom, a crosslinked bovine-serum albumin (BSA) MT phantom, and in a single healthy volunteer as part of an ethically approved study after obtaining informed consent. A dictionary was generated using a single-pool extended phase graph (EPG) model developed by Malik et al6 for T1 values 10-4500ms, T2 values 2-3000ms and B1+ values 0.8 to 1.2. To incorporate slice profile effects7-9 the effective imaging flip angle was simulated for each prescribed sinc RF pulse and slice selection gradient profile to generate fingerprints at 11 discrete points across the 5mm imaging slice, which were then summed and normalised for matching. The B1 was preselected via comparison to a Siemens turbo-flash map. Fingerprints for every voxel were extracted and matched to the closest dictionary entry using a maximum dot product search, and corresponding T1 and T2 maps were reconstructed.
Results and Discussion
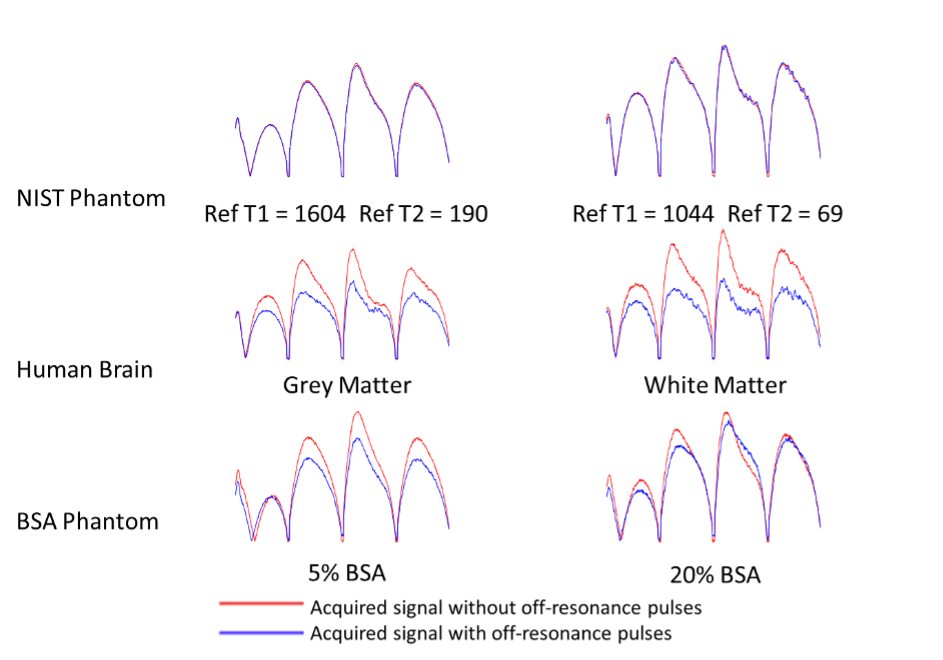
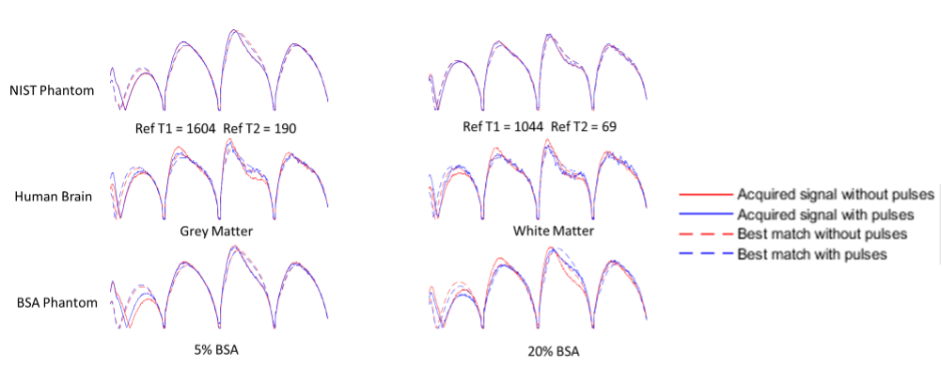
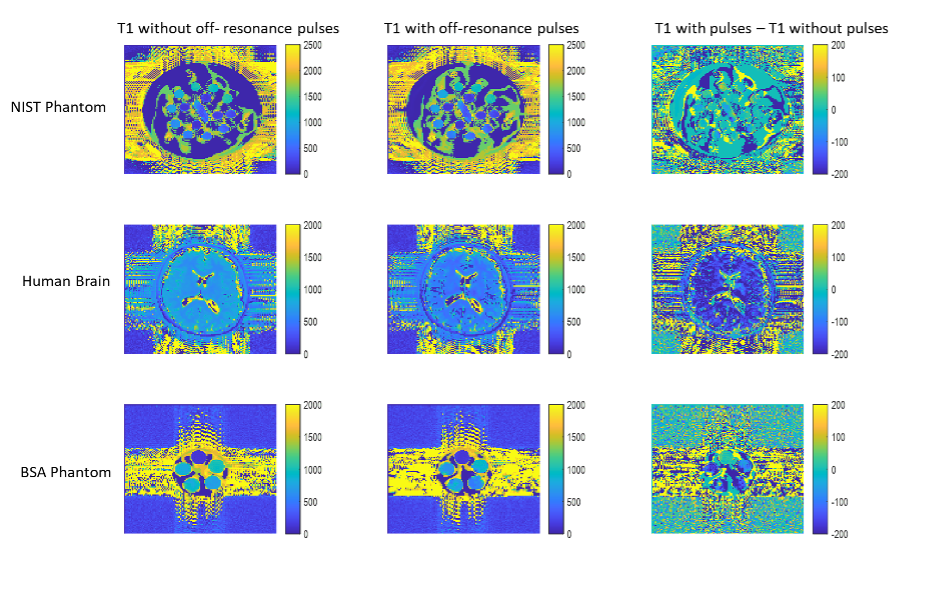
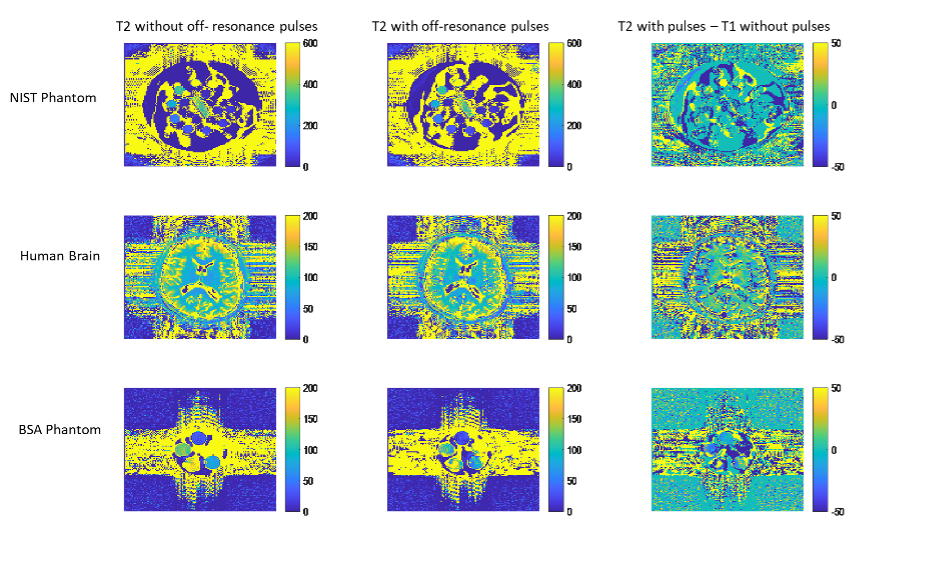
In Figure 2, signal evolutions for single voxels acquired with and without off resonance in all three scanning subjects are shown. No magnetisation transfer takes place in the liquid NIST phantom because only free protons are present. In all other voxels, off-resonance pulses saturate bound protons and areas with significant bound and free proton interactions, reducing the signal magnitude as only free protons are measured. This also changes the shape of the signal evolution, and leads to different matches for normalised fingerprints, as shown in Figure 3.The resulting T1 and T2 maps are shown in Figures 4 and 5 respectively. In this experiment, applying off resonance pulses throughout the acquisition caused the observed T1 to decrease. This behaviour was unexpected and opposite to what was observed in our previous experiment4. It is also in the opposite direction to changes in T1 observed when MT effects on a fingerprinting acquisition were simulated explicitly by Hilbert et al10.
T2 values increased when off-resonance pulses were applied. this is similar to what was observed when MT effects were simulated explicitly10.
Conclusion
For both T1 and T2, the difference caused by off-resonance pulses was correlated with MT. The difference caused by the off-resonance pulses (Figure 5) was greatest in white matter and in regions of the MT phantom with high concentrations of BSA. This was as expected as white matter with high axonal count11 is where the most MT occurs in the brain, and increasing BSA concentration in the MT phantom also causes an increase in MT10 No differences were observed for T1 and T2 in the liquid NIST phantom, where no MT effect occurs. We can conclude changes caused by the off-resonance pulses are driven by MT as off-resonance pulses saturate signal from free protons exchange with bound protons.We previously observed MRF underestimates T1 and T2 when compared with other methods, and hypothesised this was due to MT, and could be mitigated by off resonance pulses. The T1 decreasing when off-resonance pulses are included in the acquisition ndicates off-resonance pulses in an MRF acquisition will not always affect T1 and T2 in the same direction.
Acknowledgements
The authors would like to thank: the volunteers who participated in the study, Shaihan Malik for assistance with the EPG formalism and Martijn Cloos for providing a protocol to make a crosslinked Bovine Serum Albumin (BSA) phantom.References
1.Smith, J. et al. Validity and reproducibility of Magnetic Resonance Fingerprinting in the healthy human brain at 3T. in Proceedings of the 28th Annual Meeting of the International Society of Magnetic Resonance in Medicine (2020).
2.Kukran, S. et al. Validity and repeatability of MRF in glioma and normal appearing contralateral brain tissue at 3T. in Proceedings of the 29th Annual Meeting of the International Society of Magnetic Resonance in Medicine (2021).
3. Statton, B.K. et al. (2021) Temperature dependence, accuracy, and repeatability of T 1 and T 2 Relaxation Times for the ISMRM/NIST System Phantom measured using MR Fingerprinting,” Magnetic Resonance in Medicine, 87(3), pp. 1446–1460.
4. Kukran, S. et al. Mitigation of Magnetisation Transfer Effects using Off-Resonance Pulses in MR Fingerprinting. in Proceedings of the 30th Annual Meeting of the International Society of Magnetic Resonance in Medicine (2022).
5. Jiang, Y., Ma, D., Seiberlich, N., Gulani, V. & Griswold, M. A. MR fingerprinting using fast imaging with steady state precession (FISP) with spiral readout. Magn. Reson. Med. 74, 1621–1631 (2015).
6. Malik, S. J., Teixeira, R. P. A. G. & Hajnal, J. V. Extended phase graph formalism for systems with magnetization transfer and exchange. Magn. Reson. Med. 80, 767–779 (2018).
7. Ma, D. et al. (2017) “Slice profile and B1 corrections in 2D magnetic resonance fingerprinting,” Magnetic Resonance in Medicine, 78(5), pp. 1781–1789.
8. Hong, T. et al. (2017) “RF slice profile effects in magnetic resonance fingerprinting,” Magnetic Resonance Imaging, 41, pp. 73–79.
9. Chiu, S.-C. et al. (2017) “Effects of RF pulse profile and intra-voxel phase dispersion on MR fingerprinting with balanced SSFP readout,” Magnetic Resonance Imaging, 41, pp. 80–86.
10.Hilbert, T. et al. Magnetization transfer in magnetic resonance fingerprinting. Magn. Reson. Med. 84, 128–141 (2020).
11. Schmierer, K., Scaravilli, F., Altmann, D. R., Barker, G. J. & Miller, D. H. (2004) Magnetization transfer ratio and myelin in postmortem multiple sclerosis brain. Ann. Neurol. 56, 407–415.
Figures