2179
Incorporating fat and spatial saturation in MR Fingerprinting1Department of Circulation and Medical Imaging, Norwegian University of Science and Technology (NTNU), Trondheim, Norway, 2Department of Radiology and Nuclear Medicine, St Olavs Hospital, Trondheim, Norway, 3Centre for Advanced Imaging, University of Queensland, Brisbane, Australia
Synopsis
Keywords: MR Fingerprinting/Synthetic MR, Prostate
Magnetic Resonance Fingerprinting (MRF) enables fast quantitative MR imaging, and represents an opportunity to improve upon the current standard of multi-parametric MRI (mp-MRI). In this work we demonstrate how the MRF pulse sequence can be adapted to include different saturation techniques, whilst retaining accurate T1 and T2 quantification. Extended Phase Graphs (EPGs) of the sequence illustrate the effective spoiling of chemical elements, such as fat, and spatial saturation. Phantom imaging shows that T1 quantification is not significantly affected and T2 quantification remains accurate up to 100ms. As an example, the framework is tested in-vivo in the context of prostate imaging.Introduction
The use of MRI to measure T1 and T2 in vivo has been well studied as a method for discriminating healthy and cancerous tissue1. However, classical quantitative MRI methods are too time-consuming for routine clinical use. MRF has been introduced to enable fast quantitative parameter mapping2. Numerous works have investigated its potential to bring fast, reliable cancer detection to the clinic3,4,5. To this endeavour, we aim to equip MRF with spatial and chemical saturation abilities, tools routinely used to improve the image quality in conventional clinical imaging.Theory
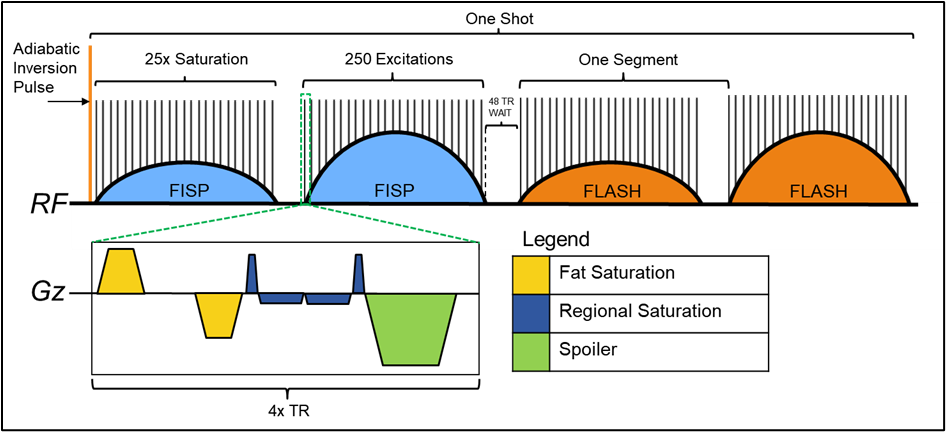
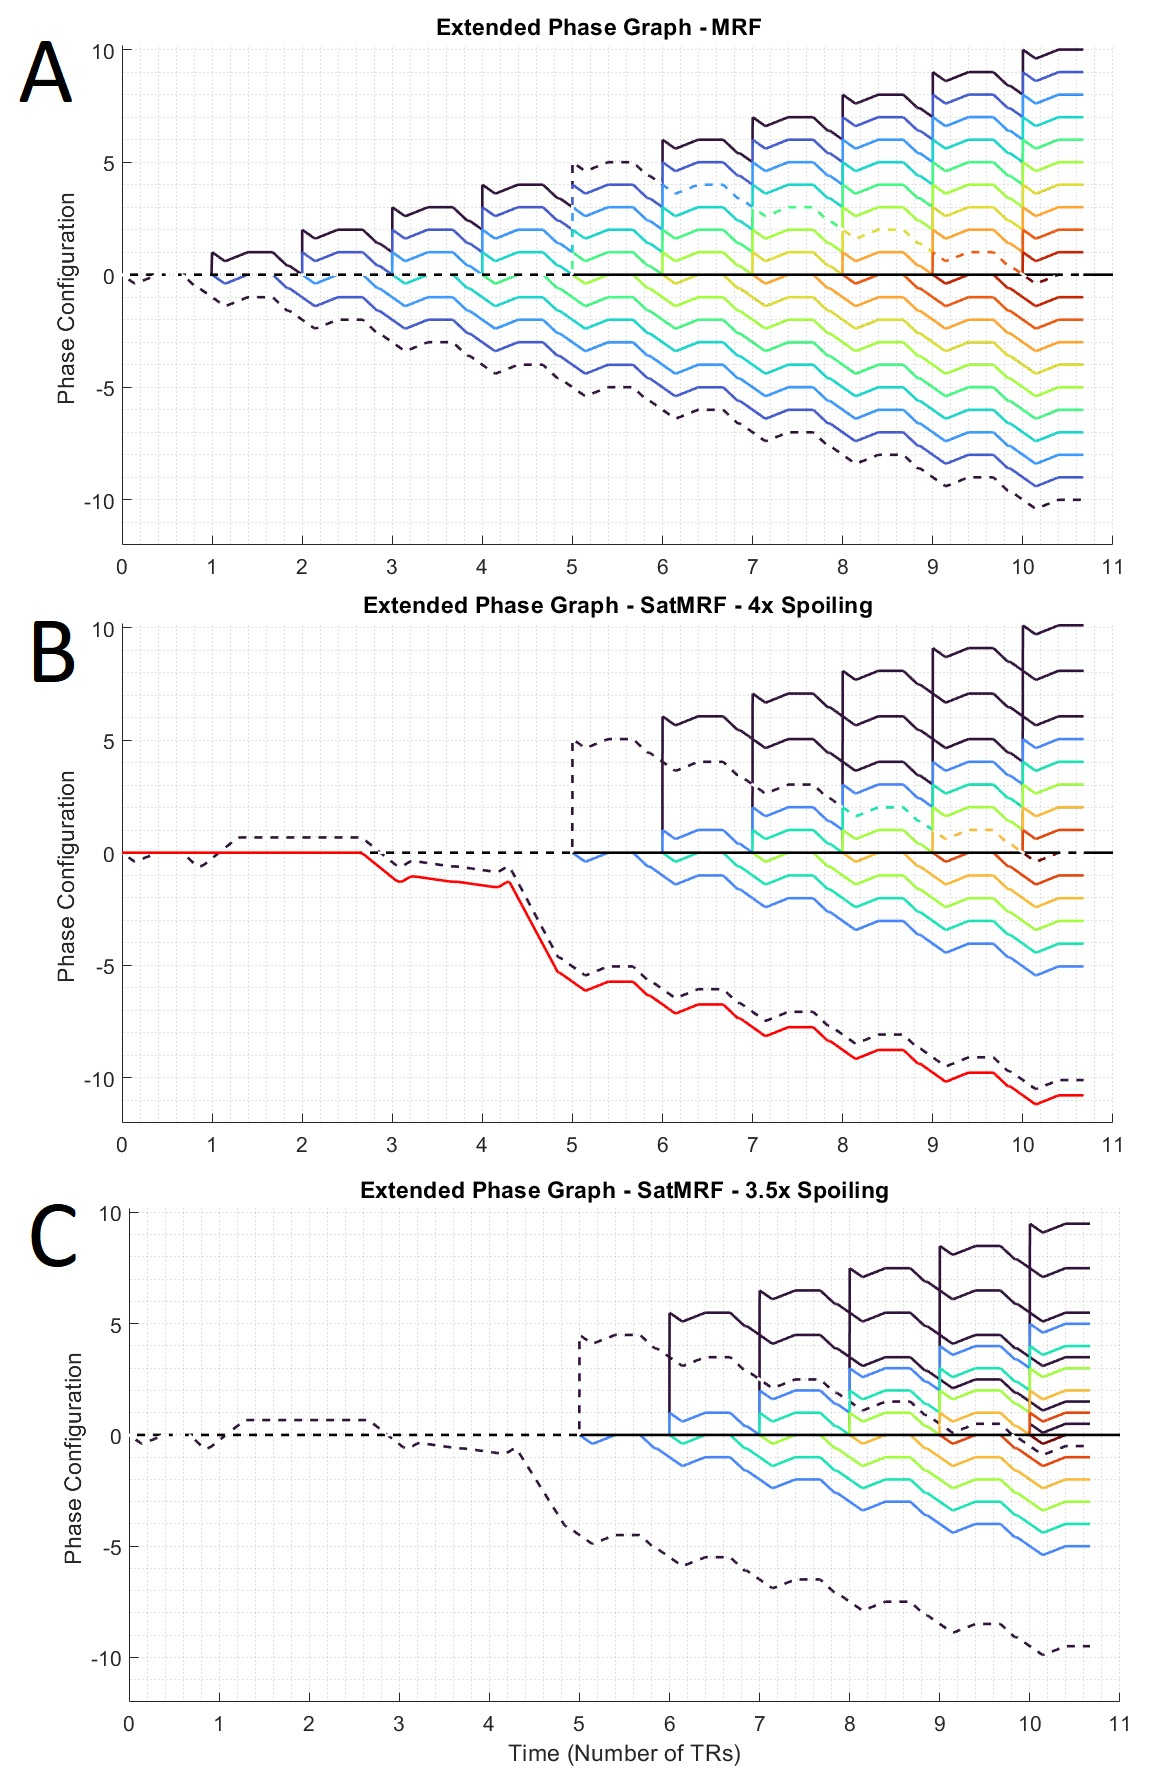
MR Fingerprinting sequences vary in their design, but generally have a very short TR and small flip angles with accompanying slice section gradients. An example of a MRF sequence is described in figure 1. Addition of saturation to this sequence necessarily interrupts the FISP/FLASH train. Such disruptions delay and derail coherence pathways which must be corrected for with an additional spoiler moment.We can better understand the effects of such pulse sequence modifications with the use of Extended Phase Graphs (EPG)6. When a gradient is applied to a distribution of magnetisations, it can be thought of as adding some amount of phase variation. Generally, the gradient moments are designed to create in voxel phase distributions with integer multiples of 2π, such that transverse magnetisation is fully spoiled at each configuration. Conversely, magnetisation with zero phase accumulation has no transverse spoiling and provides signal. Hence, charting the effect of RF pulses and gradients on magnetisation over time, one can calculate the phase configuration of the signal evolutions and hence echo intensity during acquisition.For example, an EPG is drawn for a given MRF sequence (Fig. 2). The dotted lines represent a single coherence pathway generated at the first RF excitation. In figure 2B a saturation module of duration 4xTR is inserted after the first excitation. During this time however, spins accumulate phase due to local variations in the B0 field. To account for this, an additional spoiling gradient is required with a magnitude proportional to the duration of the pause: 4xTR. Moreover, if the duration is not an integer of the TR, these B0 field variations will cause a partially shift the coherence pathways and some signal is lost, as demonstrated in figure 2C.
Methods
Pulse sequence modification
The original MRF (hereafter referred to as “MRF”) sequence as described in Cloos et al.7 was modified using the Siemens (Erlangen, Germany) Idea.net environment. The modified, saturation equipped MRF sequence (SatMRF) works by interleaving saturation modules within the excitation/acquisition segments of MRF. Here, we implemented both regional and fat saturation. A frequent saturation module was chosen (every 10th TR) in order to overcome the short T1 of fat. The fat saturation was included a sequence building block (SBB) while regional saturation was formulated a series of individual pulses and gradients, calculated such that the spin momenta would be balanced across the duration. Finally, a spoiler gradient was added with a momentum proportional to the duration of the saturation module.Phantom
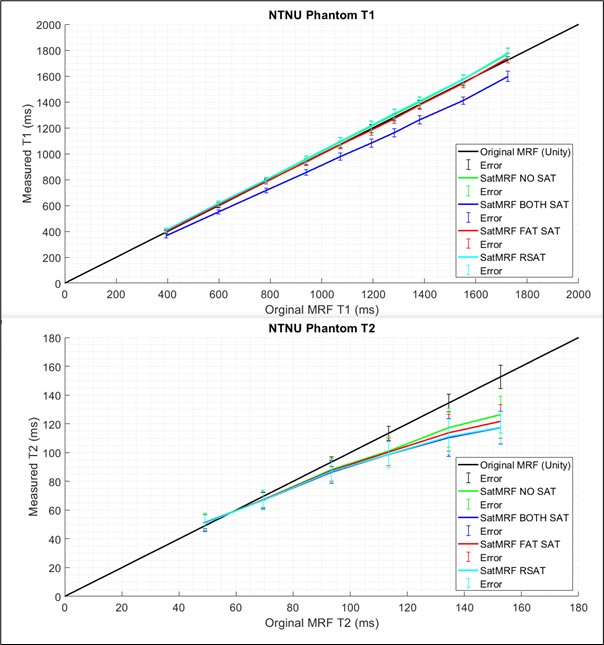
Our in-house phantom contains 10 cylinders of Manganese Chloride solution at varying concentration and two smaller cylinders containing peanut oil. Placing the phantom in a 32-channel head coil and using the SatMRF sequence we scanned two 1x1x5mm slices coronal with 800% slice gap, resolution 240x240, TR 7.5ms, TE 3.5ms and 4 shots. Acquisition time was approximately 1:36 per scan. The scan was repeated for every permutation of saturation available; no saturation, fat saturation only, regional saturation only, and both fat and regional saturation.Volunteer
We also tested the SatMRF sequence on an asymptomatic volunteer using the same protocol as above except with a flexible body coil. Regional saturation slabs were arranged parallel to the imaging slab.Results and Discussion
The EPG shows how to optimally re-focus magnetisation when introducing a pause to the MRF excitation and acquisition train for the purposes of saturation. Figure 2B illustrates how fat signal is well spoiled and is not refocused into subsequent acquisition moments. Optimal refocusing requires a spoiling moment proportional to the duration of the interruption to the sequence due to phase accumulation from B0. Figure 2C shows how imperfect spoiling results in incomplete signal recombination and acquisition.Phantom quantification results (Fig. 3) show that T1 is not significantly affected by frequent saturation modules in the sequence. Long T2 (Over 100ms) measurement is affected but T2 in the range of typical prostate tissue and cancer values remains accurate.
The duration of the sequence increases from MRF to SatMRF by 32%. This is due to the high frequency required for fat saturation. A sequence with regional saturation only is just 6% longer that MRF8. Nevertheless, we posit that SatMRF holds clinical appeal with an 8 slice image acquisition time of 6:22.
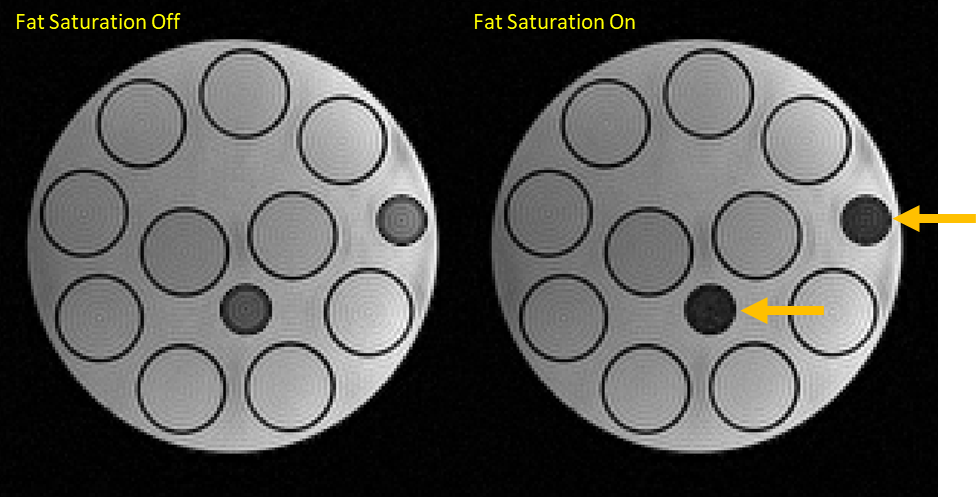
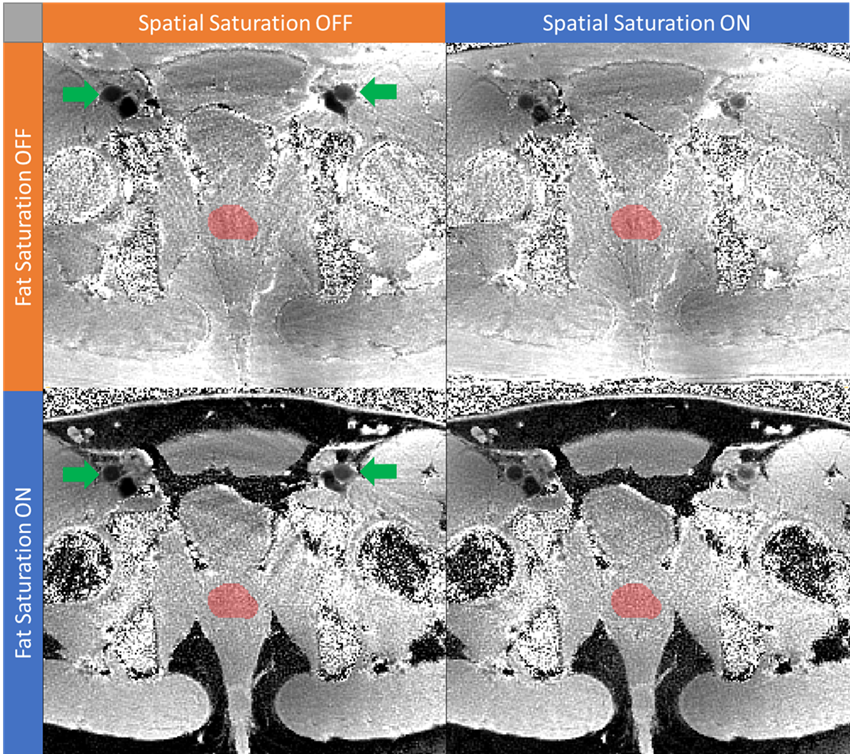
Visual assessment of phantom (Fig.4) and volunteer (Fig. 5) maps from SatMRF show that fat saturation is successfully implemented. When spatial and fat saturation is applied, volunteer B1 maps show a significant reduction of streaking artefacts generated from blood flow and from fat.
Conclusion
This abstract demonstrates with the aid of the EPG how to effectively implement saturation into the MR Fingerprinting sequence.Acknowledgements
No acknowledgement found.References
1. Damadian R. Tumor detection by nuclear magnetic resonance. Science. 1971 Mar 19;171(3976):1151–3.
2. Ma D, Gulani V, Seiberlich N, Liu K, Sunshine JL, Duerk JL, et al. Magnetic resonance fingerprinting. Nature. 2013 Mar 1;495(7440):187–92.
3. Ding H, Velasco C, Ye H, Lindner T, Grech-Sollars M, O’Callaghan J, et al. Current Applications and Future Development of Magnetic Resonance Fingerprinting in Diagnosis, Characterization, and Response Monitoring in Cancer. Cancers [Internet]. 2021;13(19).
4. Panda A, Obmann VC, Lo WC, Margevicius S, Jiang Y, Schluchter M, et al. MR Fingerprinting and ADC Mapping for Characterization of Lesions in the Transition Zone of the Prostate Gland. Radiology. 2019;292(3):685–94.
5. Yu AC, Badve C, Ponsky LE, Pahwa S, Dastmalchian S, Rogers M, et al. Development of a Combined MR Fingerprinting and Diffusion Examination for Prostate Cancer. Radiology. 2017;283(3):729–38.
6. Weigel M. Extended phase graphs: dephasing, RF pulses, and echoes - pure and simple. J Magn Reson Imaging. 2015 Feb;41(2):266–95.
7. Cloos MA, Assländer J, Abbas B, Fishbaugh J, Babb JS, Gerig G, et al. Rapid Radial T1 and T2 Mapping of the Hip Articular Cartilage With Magnetic Resonance Fingerprinting. Journal of Magnetic Resonance Imaging. 2019;50(3):810–5.
8. Trimble, C. G. et al. Incorporating saturation bands into MR Fingerprinting reduces streaking artefacts in ISMRM Annual Meeting Proceedings (2022).
Figures