2171
Soma and neurite density imaging in multiple sclerosis reveals cortical cell body signal fraction loss associated with thalamic atrophy1Department of Neurology, Massachusetts General Hospital, Harvard Medical School, Boston, MA, United States, 2MS Center Amsterdam, Anatomy and Neurosciences, Amsterdam Neuroscience, Amsterdam UMC location VUmc, Amsterdam, Netherlands, 3Athinoula A. Martinos Center for Biomedical Imaging, Department of Radiology, Massachusetts General Hospital, Harvard Medical School, Charlestown, MA, United States
Synopsis
Keywords: Multiple Sclerosis, Gray Matter, Diffusion/Other Diffusion Imaging Techniques
Multiple sclerosis (MS) features complex microstructural changes in gray matter (GM) ranging from demyelinating lesions to neuronal loss. We hypothesize that GM microstructural metrics obtained from diffusion MRI can predict cortical and deep GM atrophy in MS. In this cross-sectional study of 41 people with MS, the soma and neurite density imaging (SANDI) compartment-based model was fitted to high-gradient diffusion MRI data acquired on the Connectome scanner. SANDI metrics were used to characterize MS-related microstructural pathology in cortical and deep GM. Cortical fsoma decreased with declining thalamic volume, suggesting a microstructural correlate of thalamic atrophy in MS.Introduction
Multiple sclerosis (MS), an inflammatory demyelinating and neurodegenerative disease of the central nervous system, features complex pathological changes in gray matter (GM) that eventually lead to cortical atrophy. Cortical atrophy and GM pathology impact clinical functioning and are more pronounced in progressive MS1,2. In vivo imaging markers of GM microstructural alterations prior to frank cortical volume loss would enable more sensitive monitoring of disease activity and progression prior to onset of disability. A novel compartment-based model for apparent cell body, i.e., soma, and neurite density imaging (SANDI) using high gradient diffusion MRI has been shown to define new contrasts reflecting complementary information on brain cyto- and myelo-architecture3. The goal of this study was to explore the sensitivity of SANDI toward microstructural tissue alterations in cortical and deep GM in people with MS (pwMS) and healthy controls (HC) and to evaluate these changes relative to GM atrophy and MS phenotype.Methods
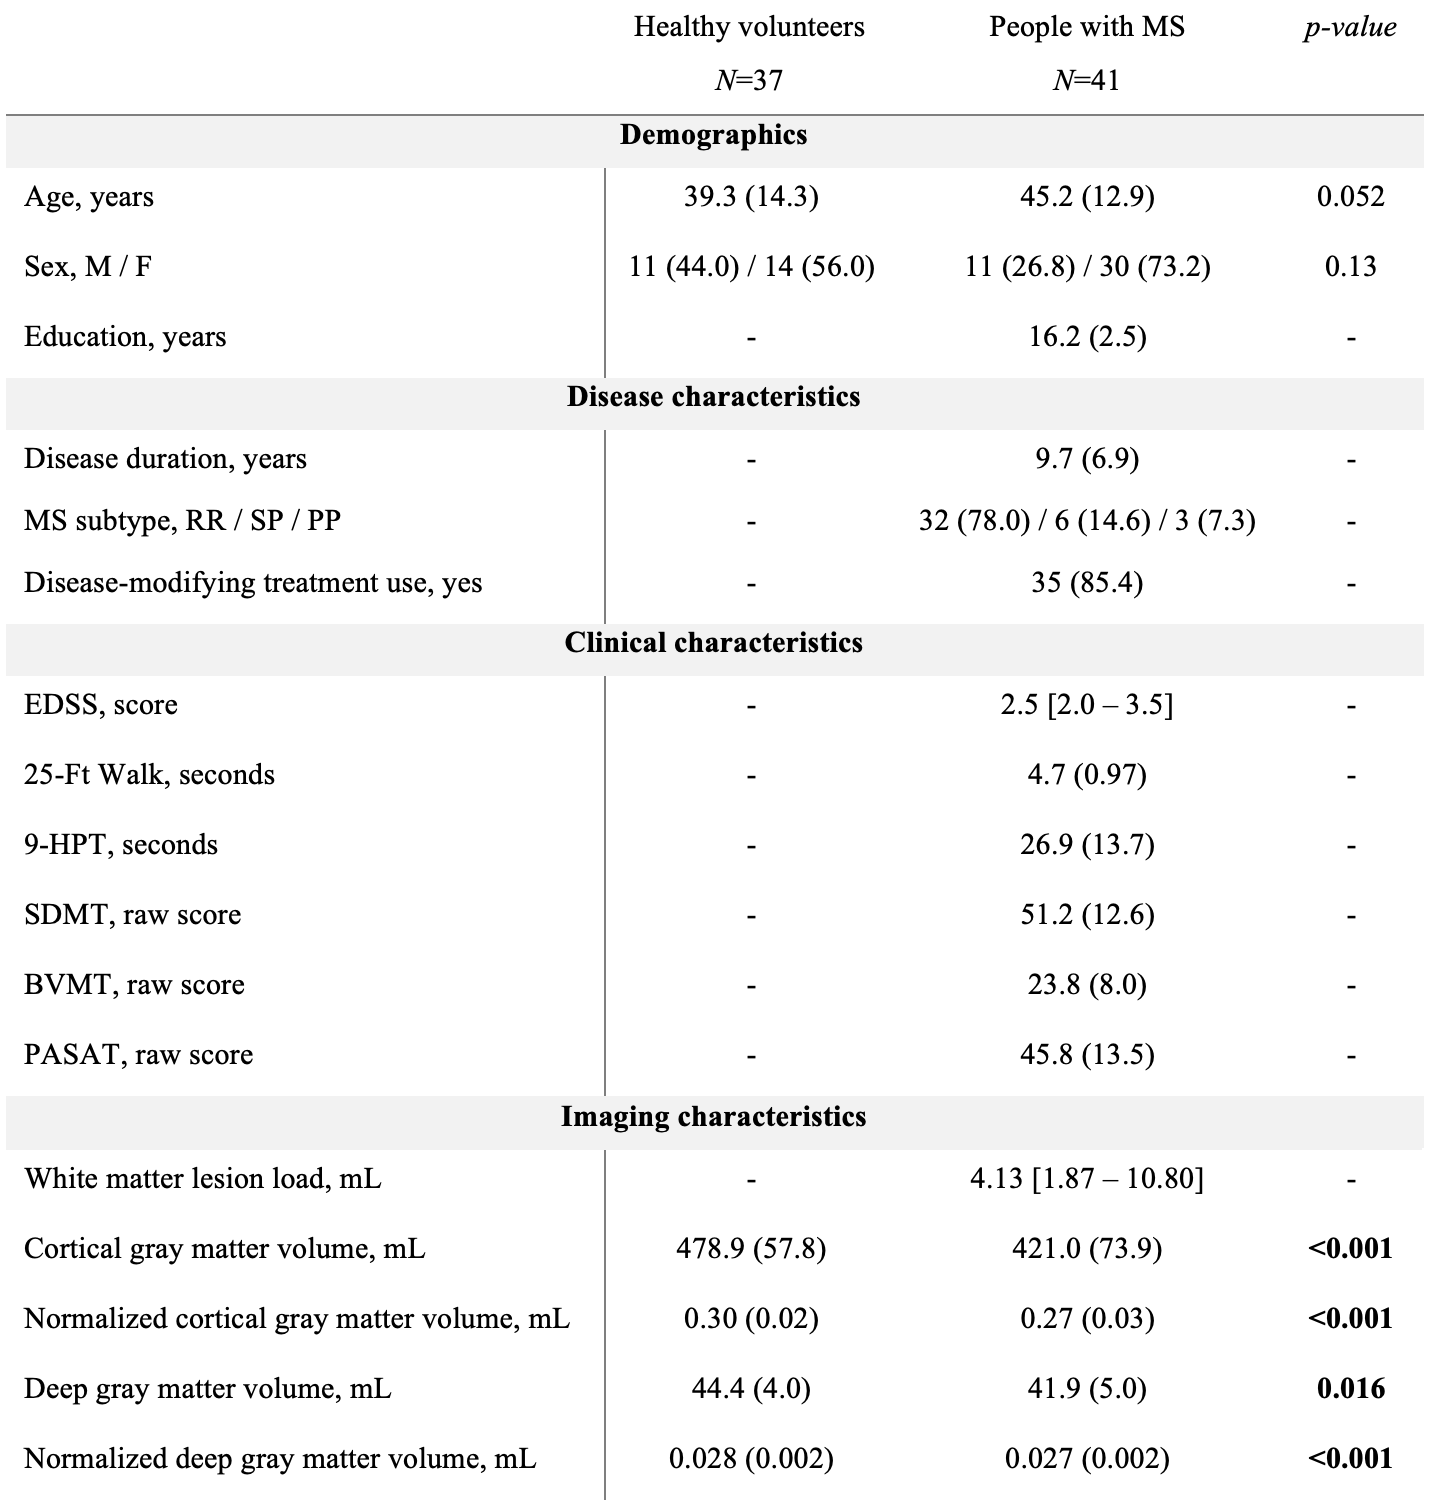
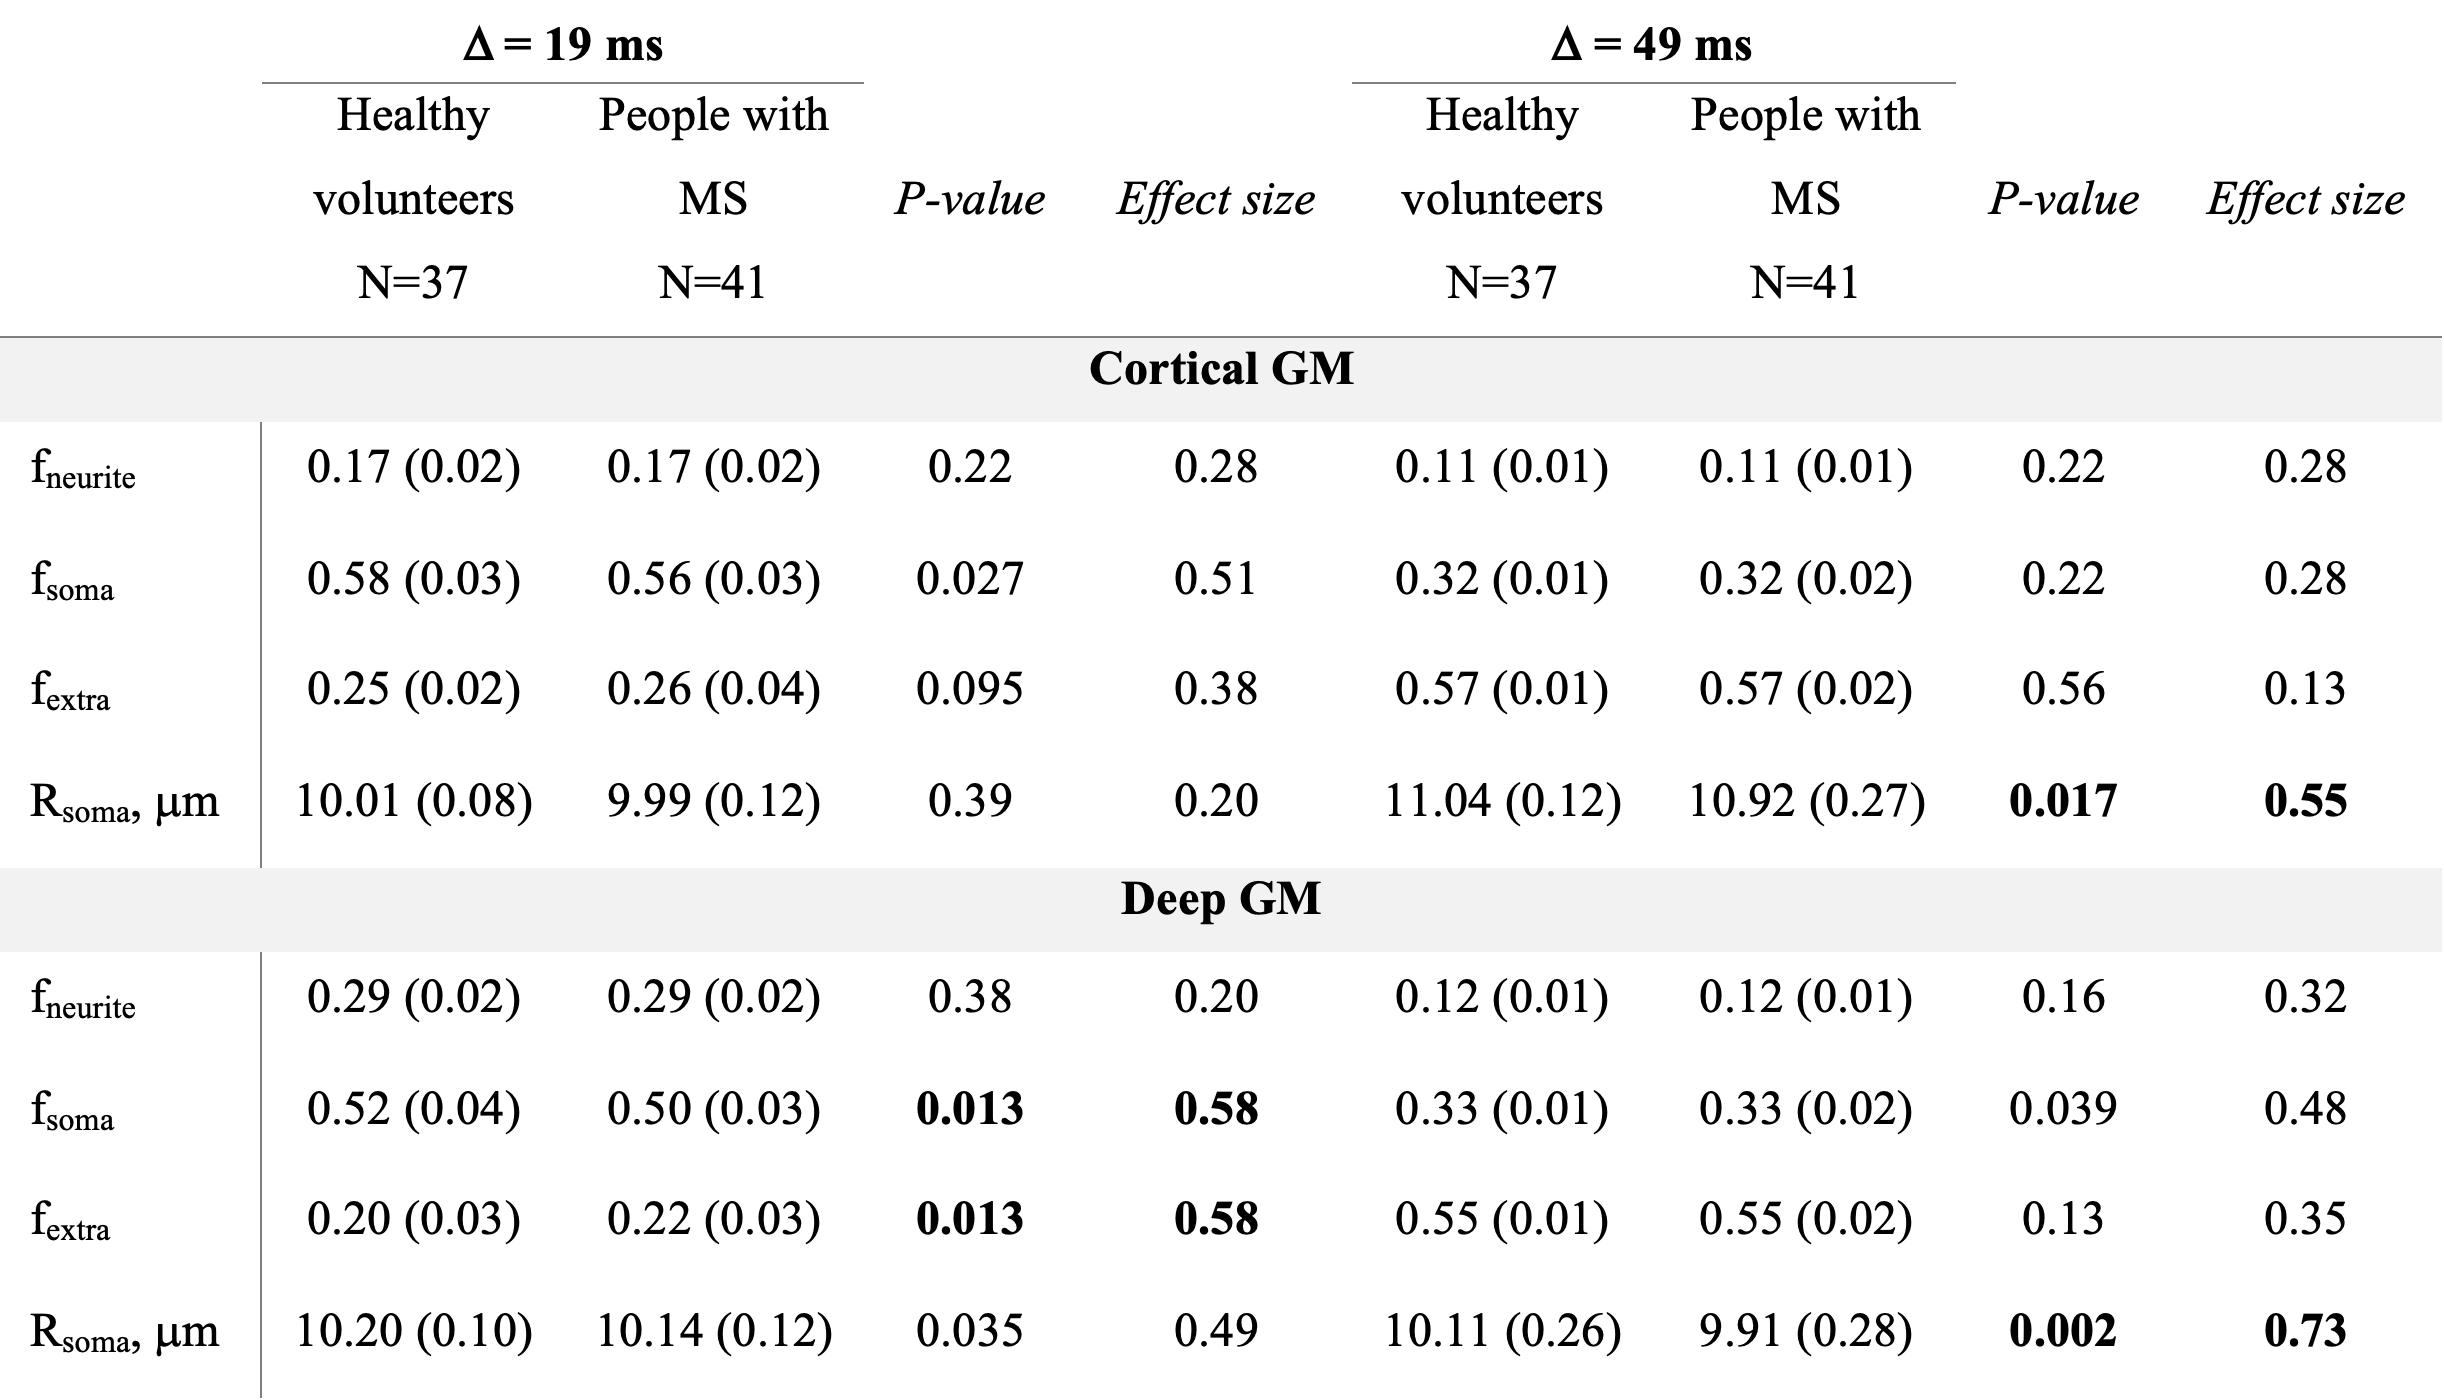
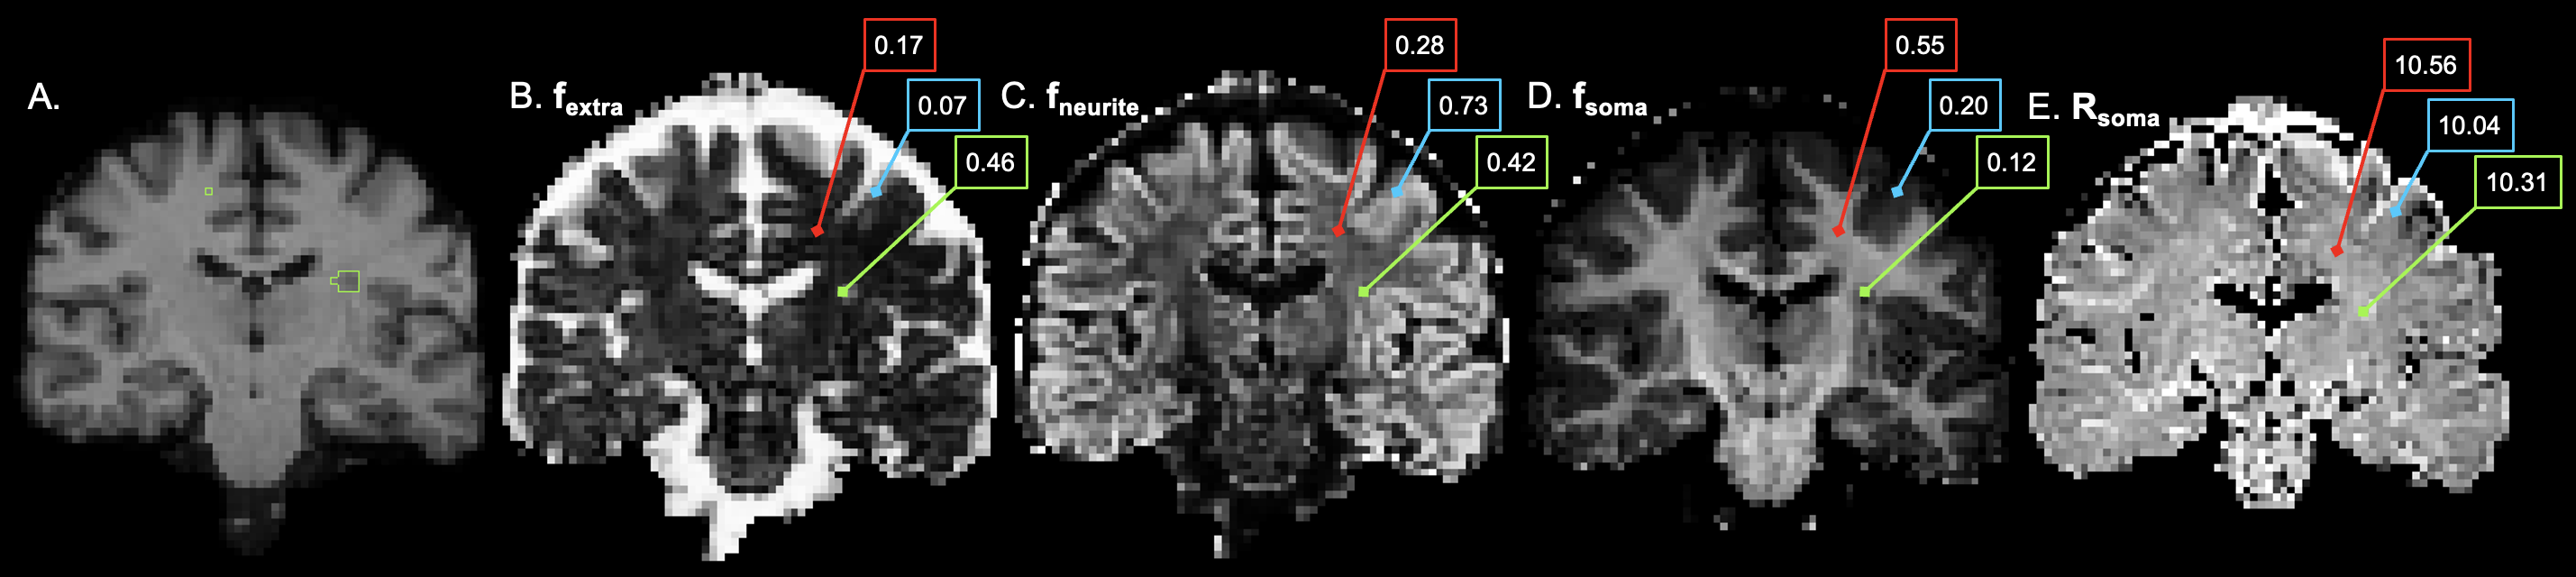
41 pwMS and 37 age- and sex-matched HC were scanned on a 3T Connectom MRI scanner equipped with 300 mT/m gradients (Table 1). A multi-shell diffusion MRI protocol4,5 was acquired consisting of eight b-values (b=50, 350, 800, and 1500 s/mm2, 32 directions; b=2400, 3450, 4750, and 6000 s/mm2, 64 directions) and diffusion time Δ=19 ms. Data acquired at diffusion time Δ=49 ms using b-values between 200 and 17,800 s/mm2 were used for comparison. Other imaging parameters were as follows: repetition time=3800 ms, echo time=77 ms, field of view=216×216 mm, matrix size=108×108, slice thickness=2 mm, diffusion-encoding gradient duration δ=8 ms. SANDI maps of intra-neurite, extra-cellular, and intra-cellular signal fractions (fneurite, fextra and fsoma) and apparent soma radius (Rsoma) were fitted using the SANDI-AMICO toolbox (Figure 1). SANDI metrics were compared between pwMS and HC and subsequently between people with relapsing-remitting (RR; N=32) and progressive (P; N=9) MS. SANDI metrics showing significant differences between pwMS and HC were correlated with cortical and thalamic volumes normalized to total intracranial volume, correcting for multiple comparisons using the false discovery rate (FDR).Results
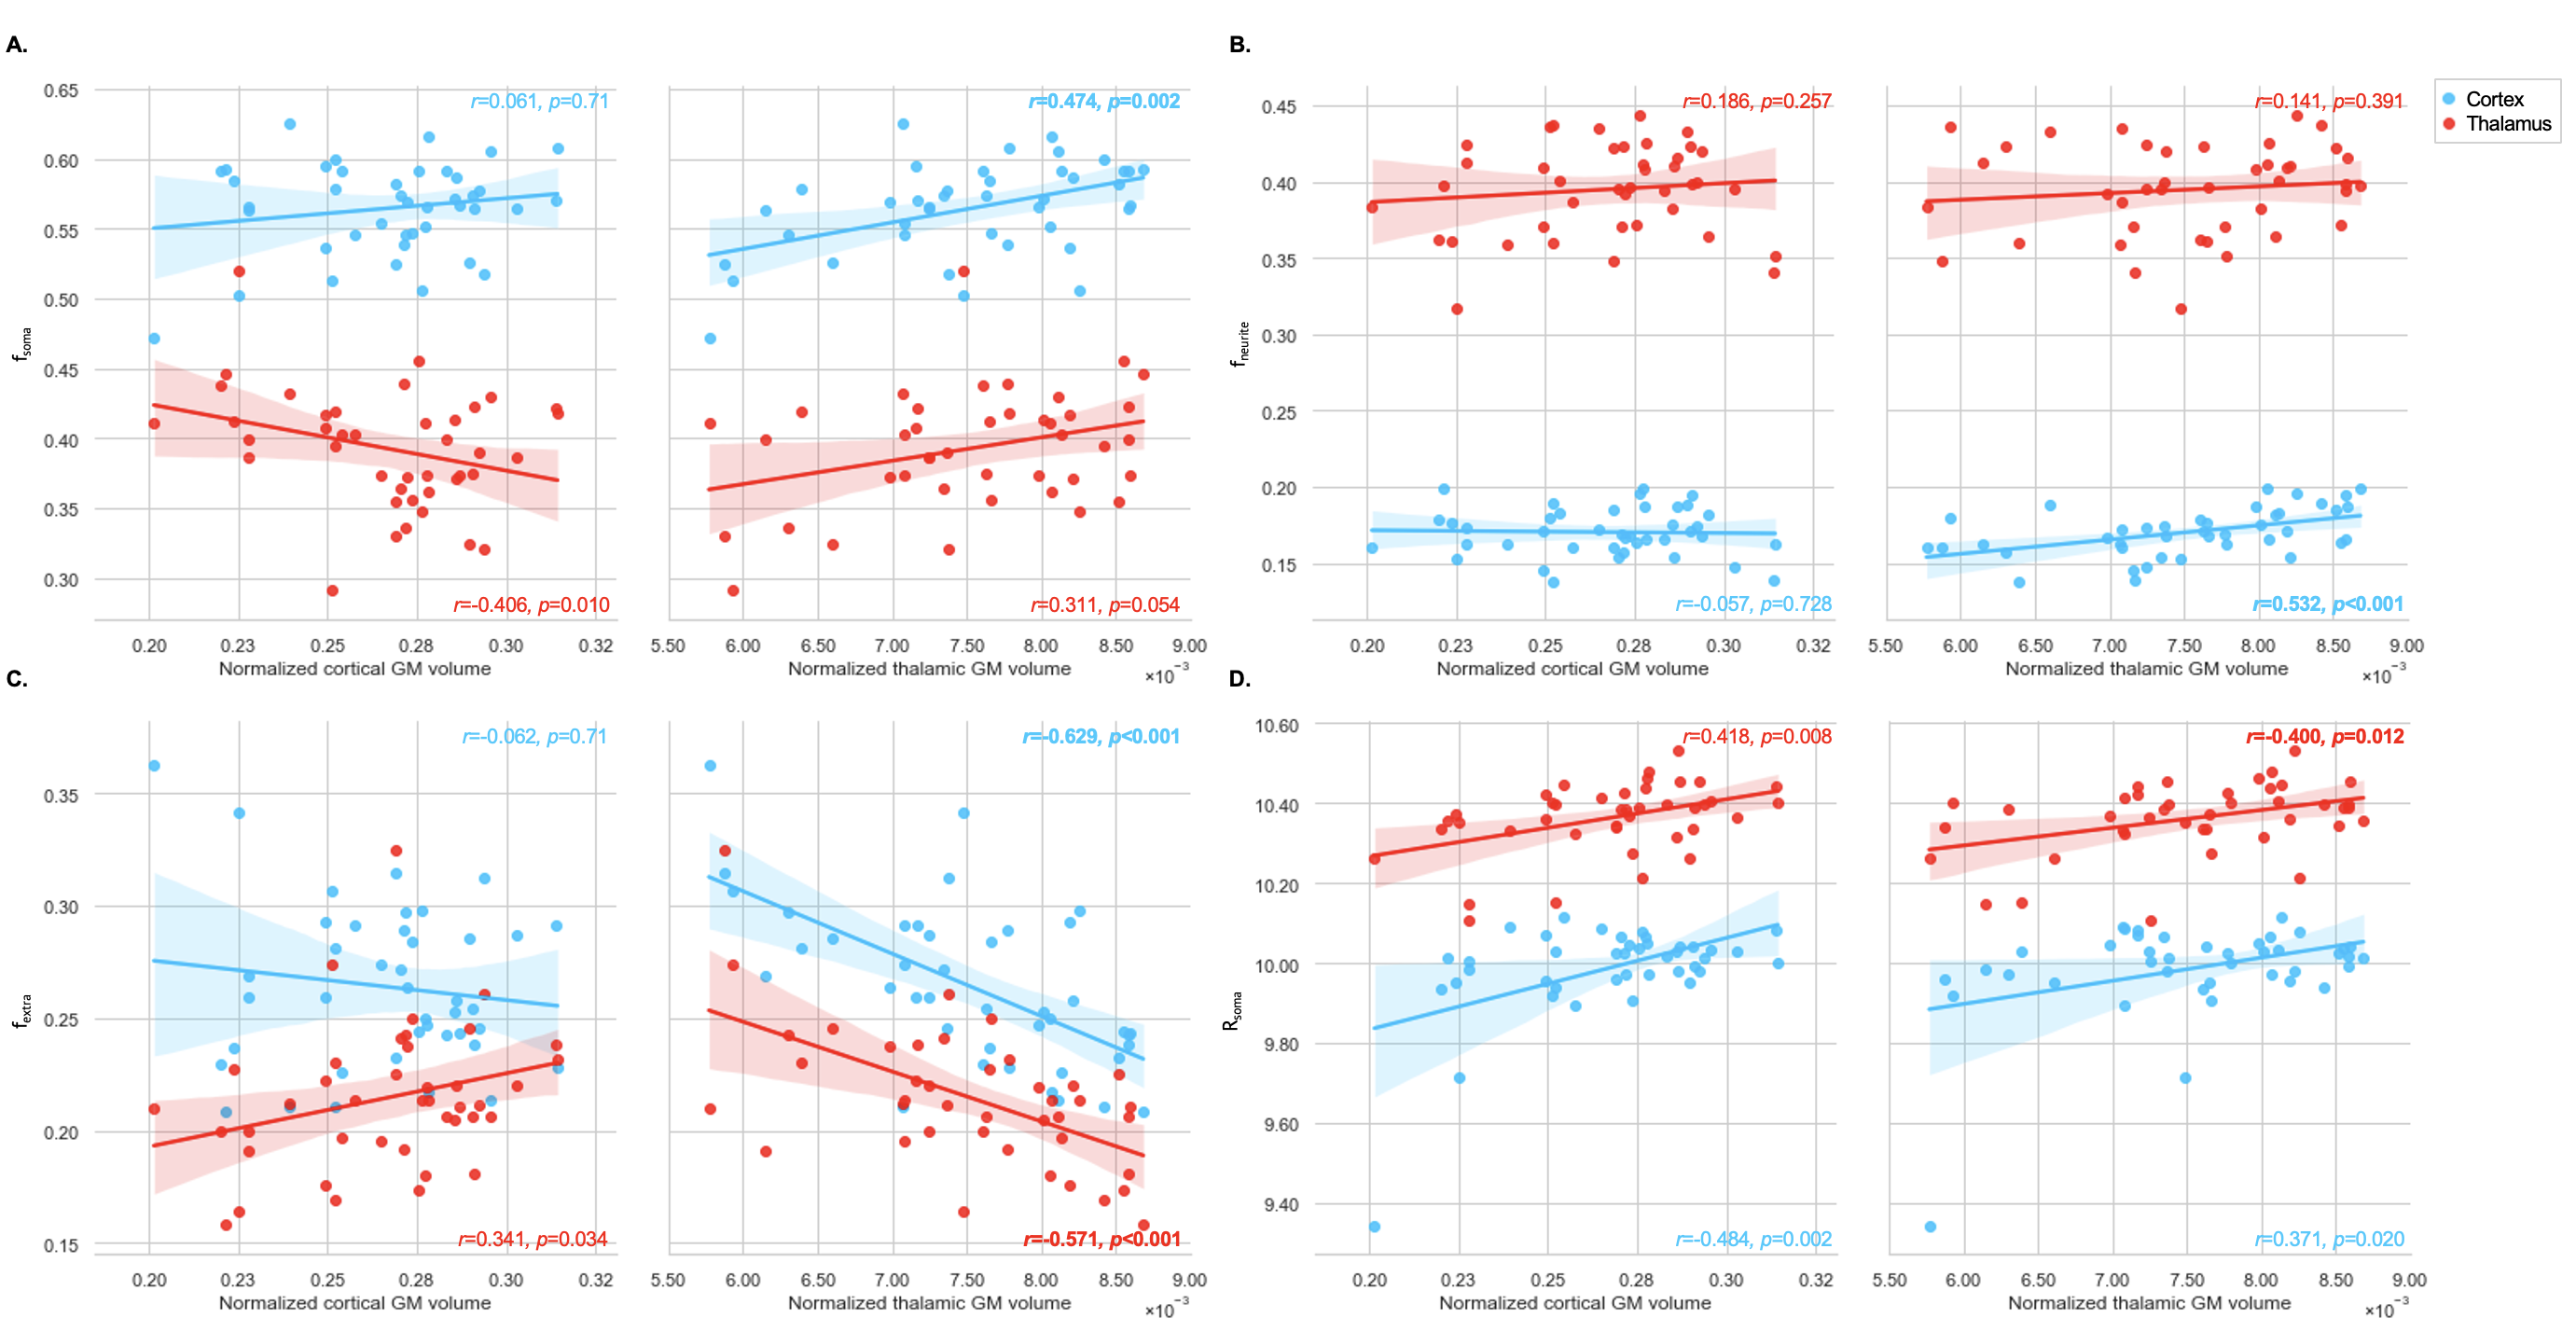
PwMS showed lower cortical fsoma compared to HC (p=0.027, not surviving FDR-correction). In deep GM, fsoma was significantly lower in pwMS compared to HC (FDR-p=0.045) (Table 2). These findings were most pronounced in PMS. At Δ=49 ms, results were less apparent with lower effect sizes (Table 2). Region-specific analysis showed reduced fsoma in the thalamus and caudate nucleus in pwMS (FDR-p=0.027 and FDR-p=0.003, respectively). Normalized thalamic volume was associated with decreased thalamic Rsoma (r=0.400, FDR-p=0.045) and increased thalamic fextra (r=-0.571, FDR-p=0.004) (Figure 2). Decreased thalamic fsoma tended to be associated with thalamic atrophy (r=0.311, p=0.054). Increased thalamic fextra and decreased Rsoma were associated with thalamic atrophy in RRMS (r=-0.526, FDR-p=0.015, and r=0.535, FDR-p=0.015, respectively), but not in PMS. Cortical fsoma and fextra were not significantly associated with cortical volume in pwMS, whereas decreased cortical fsoma and fneurite were significantly associated with thalamic atrophy (r=0.474, FDR-p=0.008, and r=0.532, FDR-p=0.003, respectively) (Figure 2).Discussion
SANDI has been proposed as a promising biophysical model that captures microstructural features in GM3,6,7, discriminating not only axonal and dendritic processes as captured by other diffusion models but also cell bodies3. In this work, we fitted multi-shell diffusion MRI data at relatively short diffusion time, as advised in the original implementation of SANDI3. The cortex and deep GM in pwMS were characterized by decreased fsoma compared to HC. At Δ=49 ms, SANDI results were less biologically plausible (e.g., fsoma~30%), potentially due to inter-compartmental water exchange resulting in shifting of signal fractions between compartments. In our cohort of predominantly RRMS, alterations in thalamic and cortical tissue microstructure, specifically lower cortical fsoma, were significantly associated with thalamic atrophy. Cortical atrophy accompanying neuronal and axonal degeneration and demyelination represents one of the most reliable predictors of clinical disability progression in MS8-10. Capturing changes in GM composition at the mesoscopic scale could offer a novel predictive biomarker of disability progression beyond what is currently reflected in cerebral volume loss, which is a relatively late marker. The association between cortical microstructure and thalamic atrophy suggests that SANDI metrics may elucidate the substrate of GM volume loss. As thalamic volume loss has been shown to be a hallmark of neurodegeneration even in early stages of MS10, our results suggest that a reduction in cortical fsoma associated with declining thalamic volume reflects neurodegeneration in pwMS. In this cohort, cortical fsoma was not significantly associated with cortical volumes, possibly pointing to the contribution of other cortical pathology associated with heterogeneous cell populations, e.g., within cortical lesions, thereby confounding the expected correlation between fsoma and cortical atrophy. The increasing availability of high-performance gradients on clinical 3T MRI scanners underscores the importance of applying advanced diffusion MRI models like SANDI to MS and other disease entities. This paves the way toward future adoption of diffusion microstructural metrics as more sensitive measures of neuroprotection in clinical trials.Conclusion
SANDI metrics, in particular fsoma, provide detailed GM characterization beyond cortical and thalamic volumes and are able to distinguish between healthy and MS-related microstructural pathology. Cortical cell density estimates obtained from high-gradient diffusion MRI decrease with declining thalamic volume and are sensitive to the microstructural substrate of neurodegeneration in pwMS.Acknowledgements
No acknowledgement found.References
1. Rahmanzadeh R, Lu PJ, Barakovic M, et al. Myelin and axon pathology in multiple sclerosis assessed by myelin water and multi-shell diffusion imaging. Brain. 07 28 2021;144(6):1684-1696. doi:10.1093/brain/awab088
2. Solana E, Martinez-Heras E, Montal V, et al. Regional grey matter microstructural changes and volume loss according to disease duration in multiple sclerosis patients. Sci Rep. 08 19 2021;11(1):16805. doi:10.1038/s41598-021-96132-x
3. Palombo M, Ianus A, Guerreri M, et al. SANDI: A compartment-based model for non-invasive apparent soma and neurite imaging by diffusion MRI. Neuroimage. 07 15 2020;215:116835. doi:10.1016/j.neuroimage.2020.116835
4. Huang SY, Tian Q, Fan Q, et al. High-gradient diffusion MRI reveals distinct estimates of axon diameter index within different white matter tracts in the in vivo human brain. Brain Struct Funct. May 2020;225(4):1277-1291. doi:10.1007/s00429-019-01961-2
5. Tian Q, Fan Q, Witzel T, et al. Comprehensive diffusion MRI dataset for in vivo human brain microstructure mapping using 300 mT/m gradients. Sci Data. 01 18 2022;9(1):7. doi:10.1038/s41597-021-01092-6
6. Ianus A, Alexander DC, Zhang H, Palombo M. Mapping complex cell morphology in the grey matter with double diffusion encoding MR: A simulation study. Neuroimage. 11 01 2021;241:118424. doi:10.1016/j.neuroimage.2021.118424
7. Margoni M, Pagani E, Preziosa P, et al. In vivo quantification of brain soma and neurite density abnormalities in multiple sclerosis. J Neurol. Sep 24 2022;doi:10.1007/s00415-022-11386-3
8. Popescu V, Klaver R, Voorn P, et al. What drives MRI-measured cortical atrophy in multiple sclerosis? Mult Scler. Sep 2015;21(10):1280-90. doi:10.1177/1352458514562440
9. Eijlers AJC, van Geest Q, Dekker I, et al. Predicting cognitive decline in multiple sclerosis: a 5-year follow-up study. Brain. 09 01 2018;141(9):2605-2618. doi:10.1093/brain/awy202
10. Eshaghi A, Marinescu RV, Young AL, et al. Progression of regional grey matter atrophy in multiple sclerosis. Brain. 06 01 2018;141(6):1665-1677. doi:10.1093/brain/awy088
Figures