2168
Physics-guided self-supervised learning for retrospective T1 and T2 mapping from conventional weighted brain MRI
Shihan Qiu1,2, Anthony G. Christodoulou1,2, Pascal Sati1,3, Yibin Xie1, and Debiao Li1,2
1Biomedical Imaging Research Institute, Cedars-Sinai Medical Center, Los Angeles, CA, United States, 2Department of Bioengineering, UCLA, Los Angeles, CA, United States, 3Department of Neurology, Cedars-Sinai Medical Center, Los Angeles, CA, United States
1Biomedical Imaging Research Institute, Cedars-Sinai Medical Center, Los Angeles, CA, United States, 2Department of Bioengineering, UCLA, Los Angeles, CA, United States, 3Department of Neurology, Cedars-Sinai Medical Center, Los Angeles, CA, United States
Synopsis
Keywords: Quantitative Imaging, Relaxometry
Quantitative MRI directly measures tissue physical parameters, but has limited clinical adoption due to additional scan time and specialized sequence requirements. Supervised deep learning methods were developed to estimate relaxation maps from conventional weighted images. However, paired weighted images and quantitative maps required for training are hard to obtain. In this work, a physics-guided self-supervised learning approach was developed to estimate T1 and T2 maps from conventional weighted images. Using the Bloch equations to decode the estimated maps back to weighted images and enforcing similarity in the image space, the approach realized label-free training and provided maps comparable to references.Introduction
Quantitative MRI provides direct measurements of tissue physical parameters, and enables direct interpretation and comparisons of results across subjects, sites, and times. Currently, quantitative MRI techniques require specialized sequences and prolong acquisition time, which limit their clinical availability and applications. To facilitate the clinical application of quantitative MRI, deep learning (DL) approaches have been developed to estimate relaxation parameter maps from conventional weighted MRI commonly used in clinical protocols from our group and others.1-4 However, these supervised-learning-based methods require paired weighted images and quantitative maps for training, which are not commonly available in practice. In this study, we propose a physics-guided self-supervised learning scheme to perform deep-learning-based estimation of T1 and T2 maps from conventional weighted images. By using Bloch equations to convert the estimated maps back to weighted images and enforcing similarity in the weighted image space, this approach does not need quantitative maps as training labels.Methods
Physics-guided self-supervised learningBloch-equation-based MR physics models were incorporated to perform self-supervised learning.5-7 As shown in Figure 1, multi-contrast conventional weighted images were fed into a 2D convolutional neural network, which had a three-channel output corresponding to T1, T2, and M0 maps, respectively. The network outputs were then passed to MR physics models to regenerate the weighted contrasts. A self-supervised loss was calculated between the synthesized weighted images and the input weighted images. Additional constraints were added to the network outputs to stabilize the training and avoid unrealistic solutions, including a total variation loss on M0 map, a loss constraining M0 to have a mean value of 1, and losses for constraining T1 and T2 values in the CSF region. The final loss function is
$$L_{\text {total}}=L_{\text {self-sup}}(\hat{\boldsymbol{\imath}}, \boldsymbol{i})+L_c\left(T1,T2, M_0\right)$$ $$L_{\text {self-sup}}(\hat{\boldsymbol{\imath}}, \boldsymbol{i})=L_2\left(\frac{\hat{\boldsymbol{\imath}}}{\hat{\boldsymbol{\mu}}} \boldsymbol{\mu}, \boldsymbol{\boldsymbol{i}}\right)$$ $$L_c\left(T1,T2,M_0\right)=\lambda_1 TV\left(M_0\right)+\lambda_2 L_1\left(\operatorname{mean}\left(M_0\right), 1\right)+\lambda_3 L_2\left(T1_{CSF},ref_1\right)+\lambda_4 L_2\left(T2_{CSF}, ref_2\right)$$ where $$$\boldsymbol{i}$$$ is the input weighted image, $$$\hat{\boldsymbol{\imath}}$$$ is the synthesized weighted image. $$$\boldsymbol{\mu}$$$ and $$$\hat{\boldsymbol{\mu}}$$$ are their mean value within brain parenchyma respectively. $$$ref_1$$$ and $$$ref_2$$$ are values for constraining CSF T1 and T2, which were empirically determined to be 1800 ms and 1000 ms, respectively.
A U-Net-based architecture described previously1 was used as the neural network. Three conventional contrasts, including T1 MPRAGE, T1 GRE, and T2 TSE, were used as the input images.
Data acquisition and preprocessing
Four healthy volunteers received brain MRI scans on a 3T Siemens Biograph mMR scanner. T1 MPRAGE, T1 GRE, and T2 TSE images were acquired. An MR Multitasking (MT) sequence8 was used to obtain T1 and T2 maps as reference maps. All images and maps were registered to T1 MPRAGE using ANTsPy9. Skull stripping was performed with BET10. FAST11 was applied on T1 MPRAGE to obtain segmentation masks of GM, WM, and CSF. N4 bias correction12 was employed on all weighted images. For each input contrast, subject-wise normalization was performed using mean value within the whole brain parenchyma.
Training and evaluation
Label-free training was performed on three subjects (298 slices). Then the trained model was applied to all four subjects (400 slices) for evaluation. The DL-derived T1/T2 maps were compared with the reference maps. Mean absolute error (MAE) and mean percentage error (MPE) were calculated on brain parenchyma, excluding the CSF region, since T1/T2 of CSF is of less interest. PSNR and SSIM were calculated on the whole image. For each slice, mean T1/T2 values of gray matter and white matter were calculated using the eroded segmentation masks.
Results
As shown in Figure 2, the self-supervised learning method generated maps with a similar appearance to the reference maps. Table 1 shows the quantitative metrics. PSNR >25dB and SSIM >0.94 were achieved. MPE for T1 and T2 in brain parenchyma were 8.53%±1.57% and 11.04%±2.33%, respectively. The mean errors of T1/T2 measurements on GM and WM were within 10% (Table 2). The Bland-Altman analyses showed that the limits of agreement were within ±11% for T1 and within ±14% for T2 after taking the mean differences into account (Figure 3). A slight underestimation of T1 on GM and T2 on WM was observed. In all the analyses, similar performances were achieved in the training cases and the test-only subject.Discussion
The proposed label-free learning method generated T1 and T2 maps comparable to the references, which showed the feasibility of retrospective estimation of T1/T2 from conventional brain MRI. Currently, constraints on T1/T2 of CSF were used, and the reference values were determined empirically. Generalizability of these constraints will be tested in future work. Apparent noise observed on the DL maps may have originated from the noisy input images. The Multitasking reference maps had a blurry appearance due to aggressive acceleration. T1/T2 values from Multitasking mapping are also known to differ from conventional mapping results,8 which may have contributed to the observed differences in the comparisons. The proposed method will be compared with conventional mapping results and evaluated with more data in the future.Conclusion
A physics-guided self-supervised learning method was proposed to retrospectively estimate T1 and T2 maps from three conventional weighted images without needing label maps. The preliminary results showed the feasibility of deriving quantitative maps without the expense of extra scans. Further validation in larger datasets and assessment of reliability of the approach are warranted.Acknowledgements
No acknowledgement found.References
1. Qiu S, Chen Y, Ma S, et al. Multiparametric mapping in the brain from conventional contrast-weighted images using deep learning. Magn Reson Med. 2021;87(1):488-95. https://doi.org/10.1002/mrm.28962.2. Wu Y, Ma YJ, Du J, et al. Deciphering tissue relaxation parameters from a single MR image using deep learning. In Medical Imaging 2020: Computer-Aided Diagnosis. Proceedings of SPIE, Houston, TX, 2020. p. 113140Q. https://doi.org/10.1117/12.2546025.
3. Wu Y, Ma Y, Kee Y, et al. Quantitative Parametric Mapping of Tissues Properties from Standard Magnetic Resonance Imaging Enabled by Deep Learning. arXiv preprint arXiv:2108.04912. 2021 Aug 10.
4. Qiu S, Christodoulou AG, Xie Y, et al. Hybrid supervised and self-supervised deep learning for quantitative mapping from weighted images using low-resolution labels. In Proc ISMRM, 2022. pp. 2609.
5. Liu F, Kijowski R, El Fakhri G, et al. Magnetic resonance parameter mapping using model‐guided self‐supervised deep learning. Magn Reson Med. 2021;85(6):3211-26.
6. Huang C, Qian Y, Hou J, et al. Breathing Freely: Self-supervised Liver T1rho Mapping from A Single T1rho-weighted Image. In Proc Medical Imaging with Deep Learning, 2022.
7. Varadarajan D, Bouman KL, van der Kouwe A, et al. Unsupervised learning of MRI tissue properties using MRI physics models. arXiv preprint arXiv:2107.02704. 2021 Jul.
8. Ma S, Wang N, Fan Z, et al. Three-dimensional whole-brain simultaneous T1, T2, and T1ρ quantification using MR multitasking: method and initial clinical experience in tissue characterization of multiple sclerosis. Magn Reson Med. 2021;85(4):1938-1952.
9. Avants BB, Tustison N, Song G. Advanced normalization tools (ANTS). Insight j. 2009;2(365):1-35.
10. Smith SM. Fast robust automated brain extraction. Hum Brain Mapp. 2002;17(3):143-155.
11. Zhang YY, Brady M, Smith S. Segmentation of brain MR images through a hidden Markov random field model and the expectation-maximization algorithm. IEEE Trans Med Imaging. 2001;20(1):45-57.
12. Tustison NJ, Avants BB, Cook PA, et al. N4ITK: improved N3 bias correction. IEEE Trans Med Imaging. 2010;29(6):1310-20.
Figures
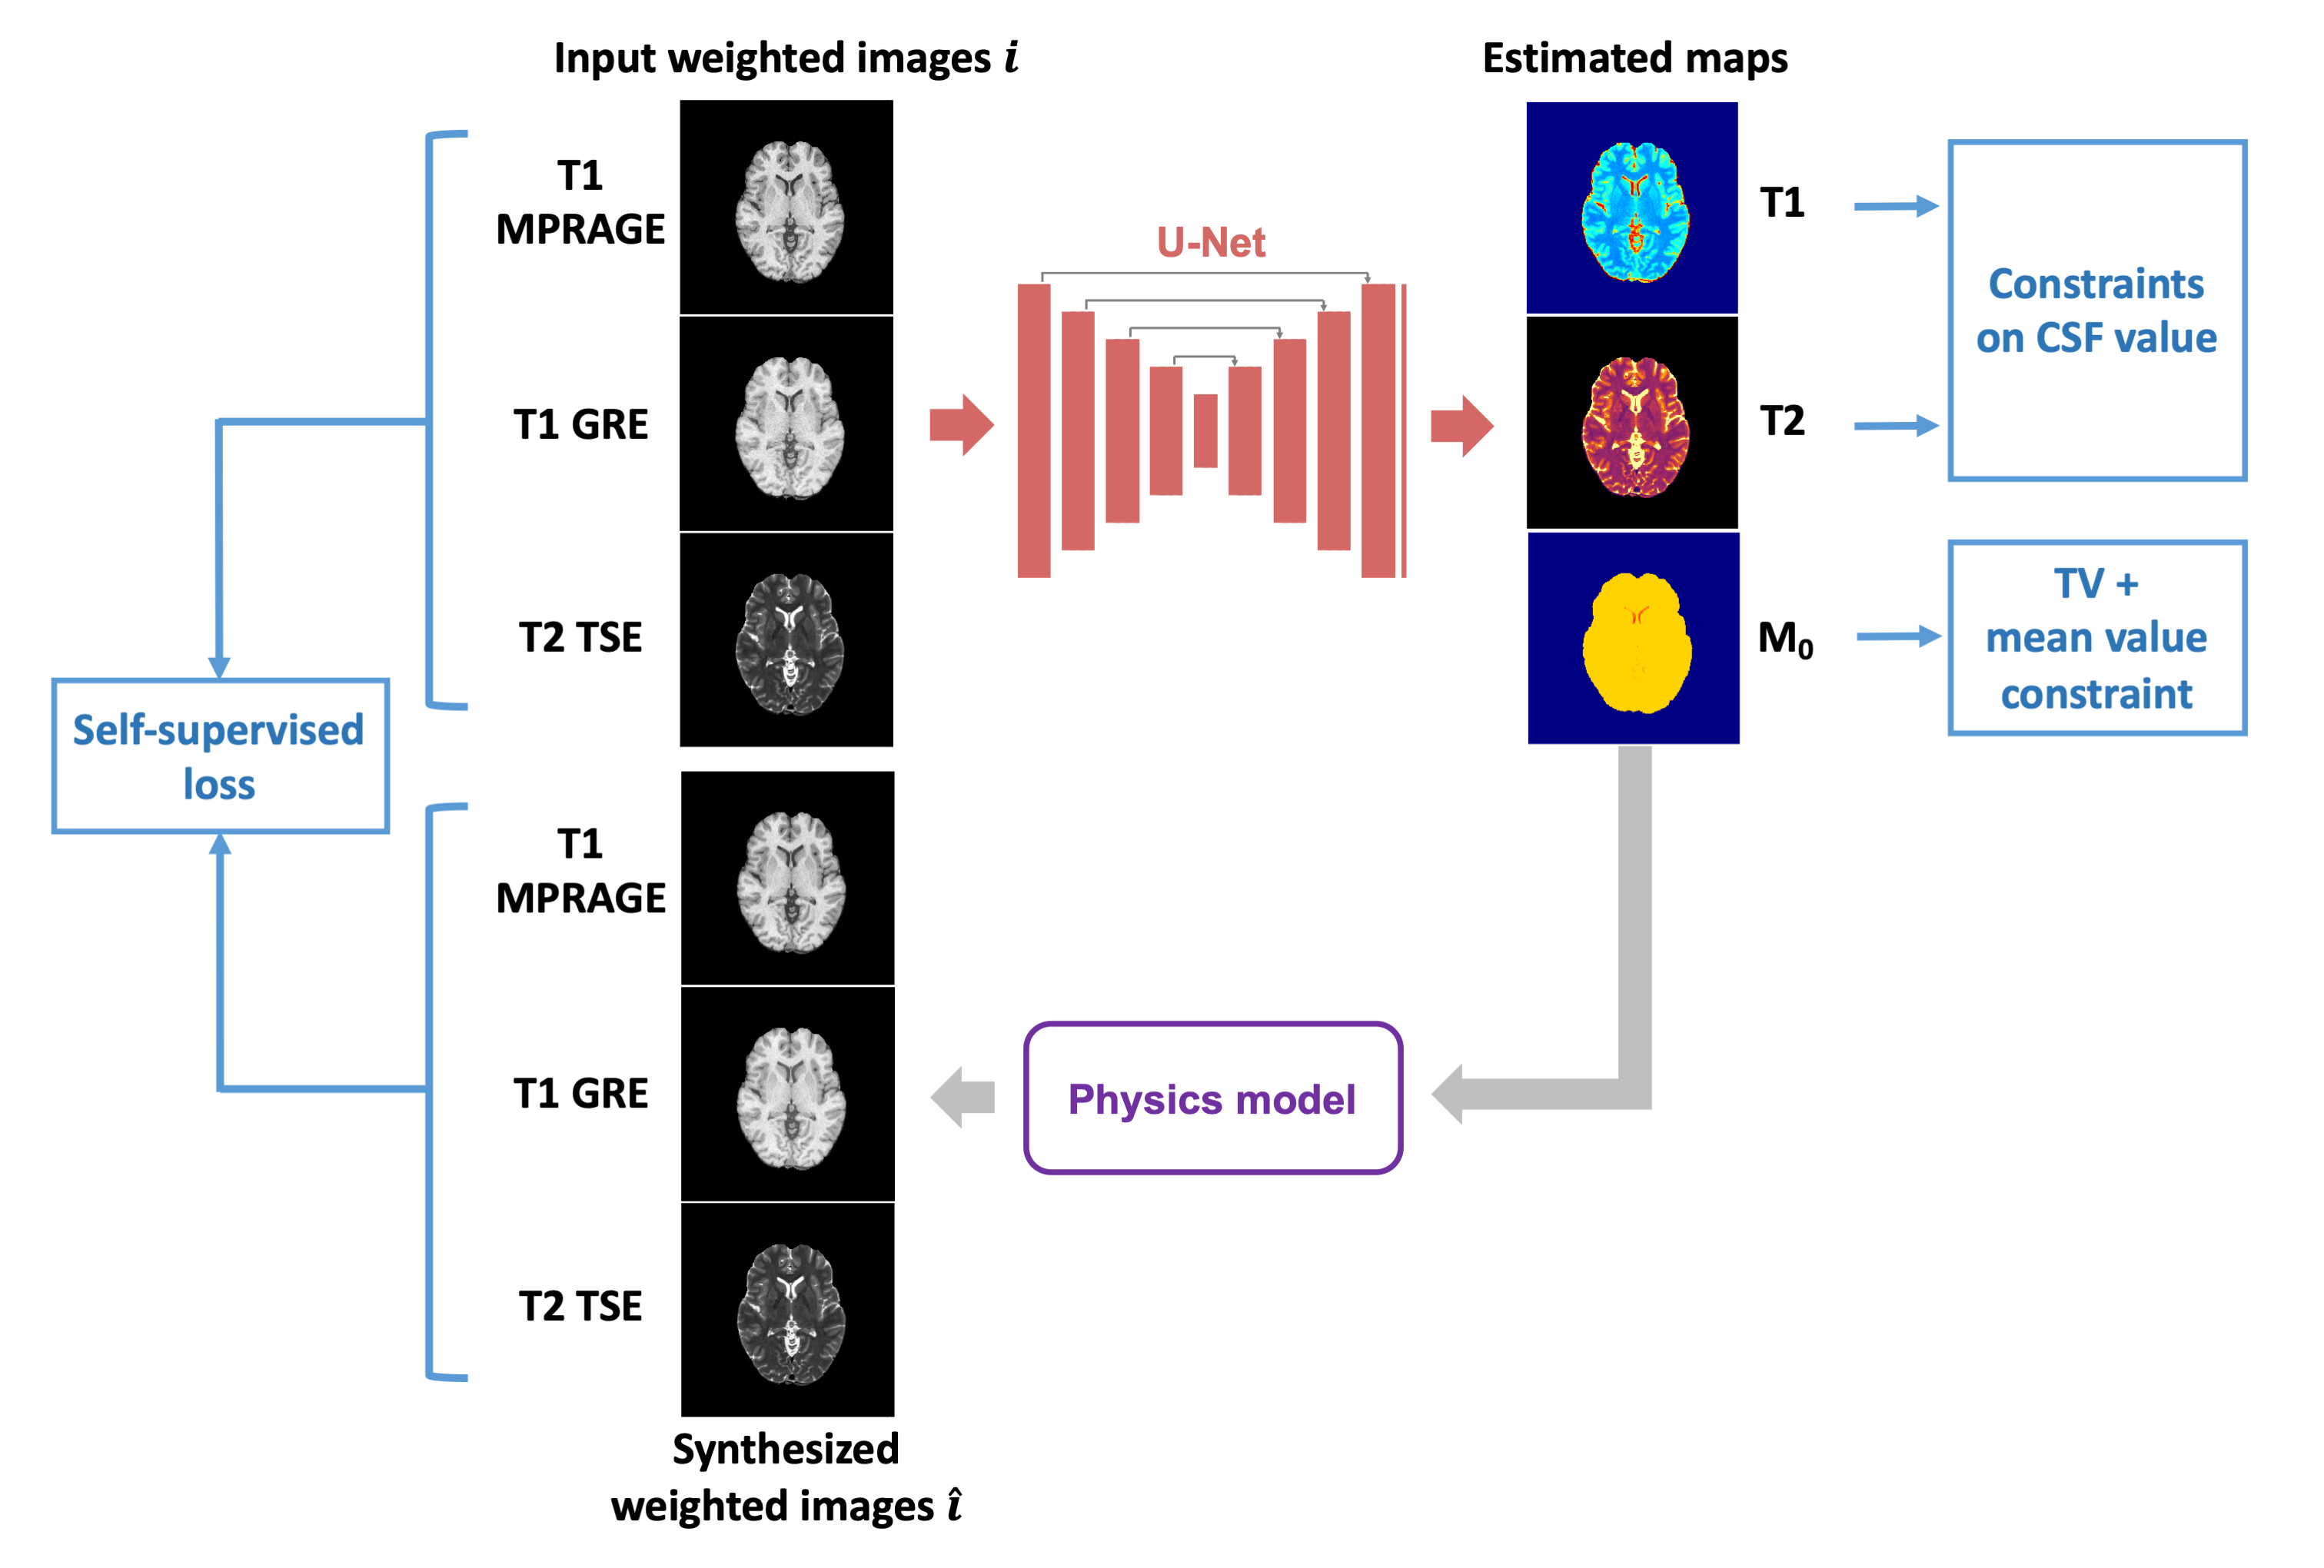
Figure 1. Overview of the proposed approach. Bloch-based signal equations were used to convert the estimated maps back to weighted images. By enforcing similarity between the input weighted images and the synthesized images, the approach realized label-free training. The U-Net-based network architecture is described in a previous work1.
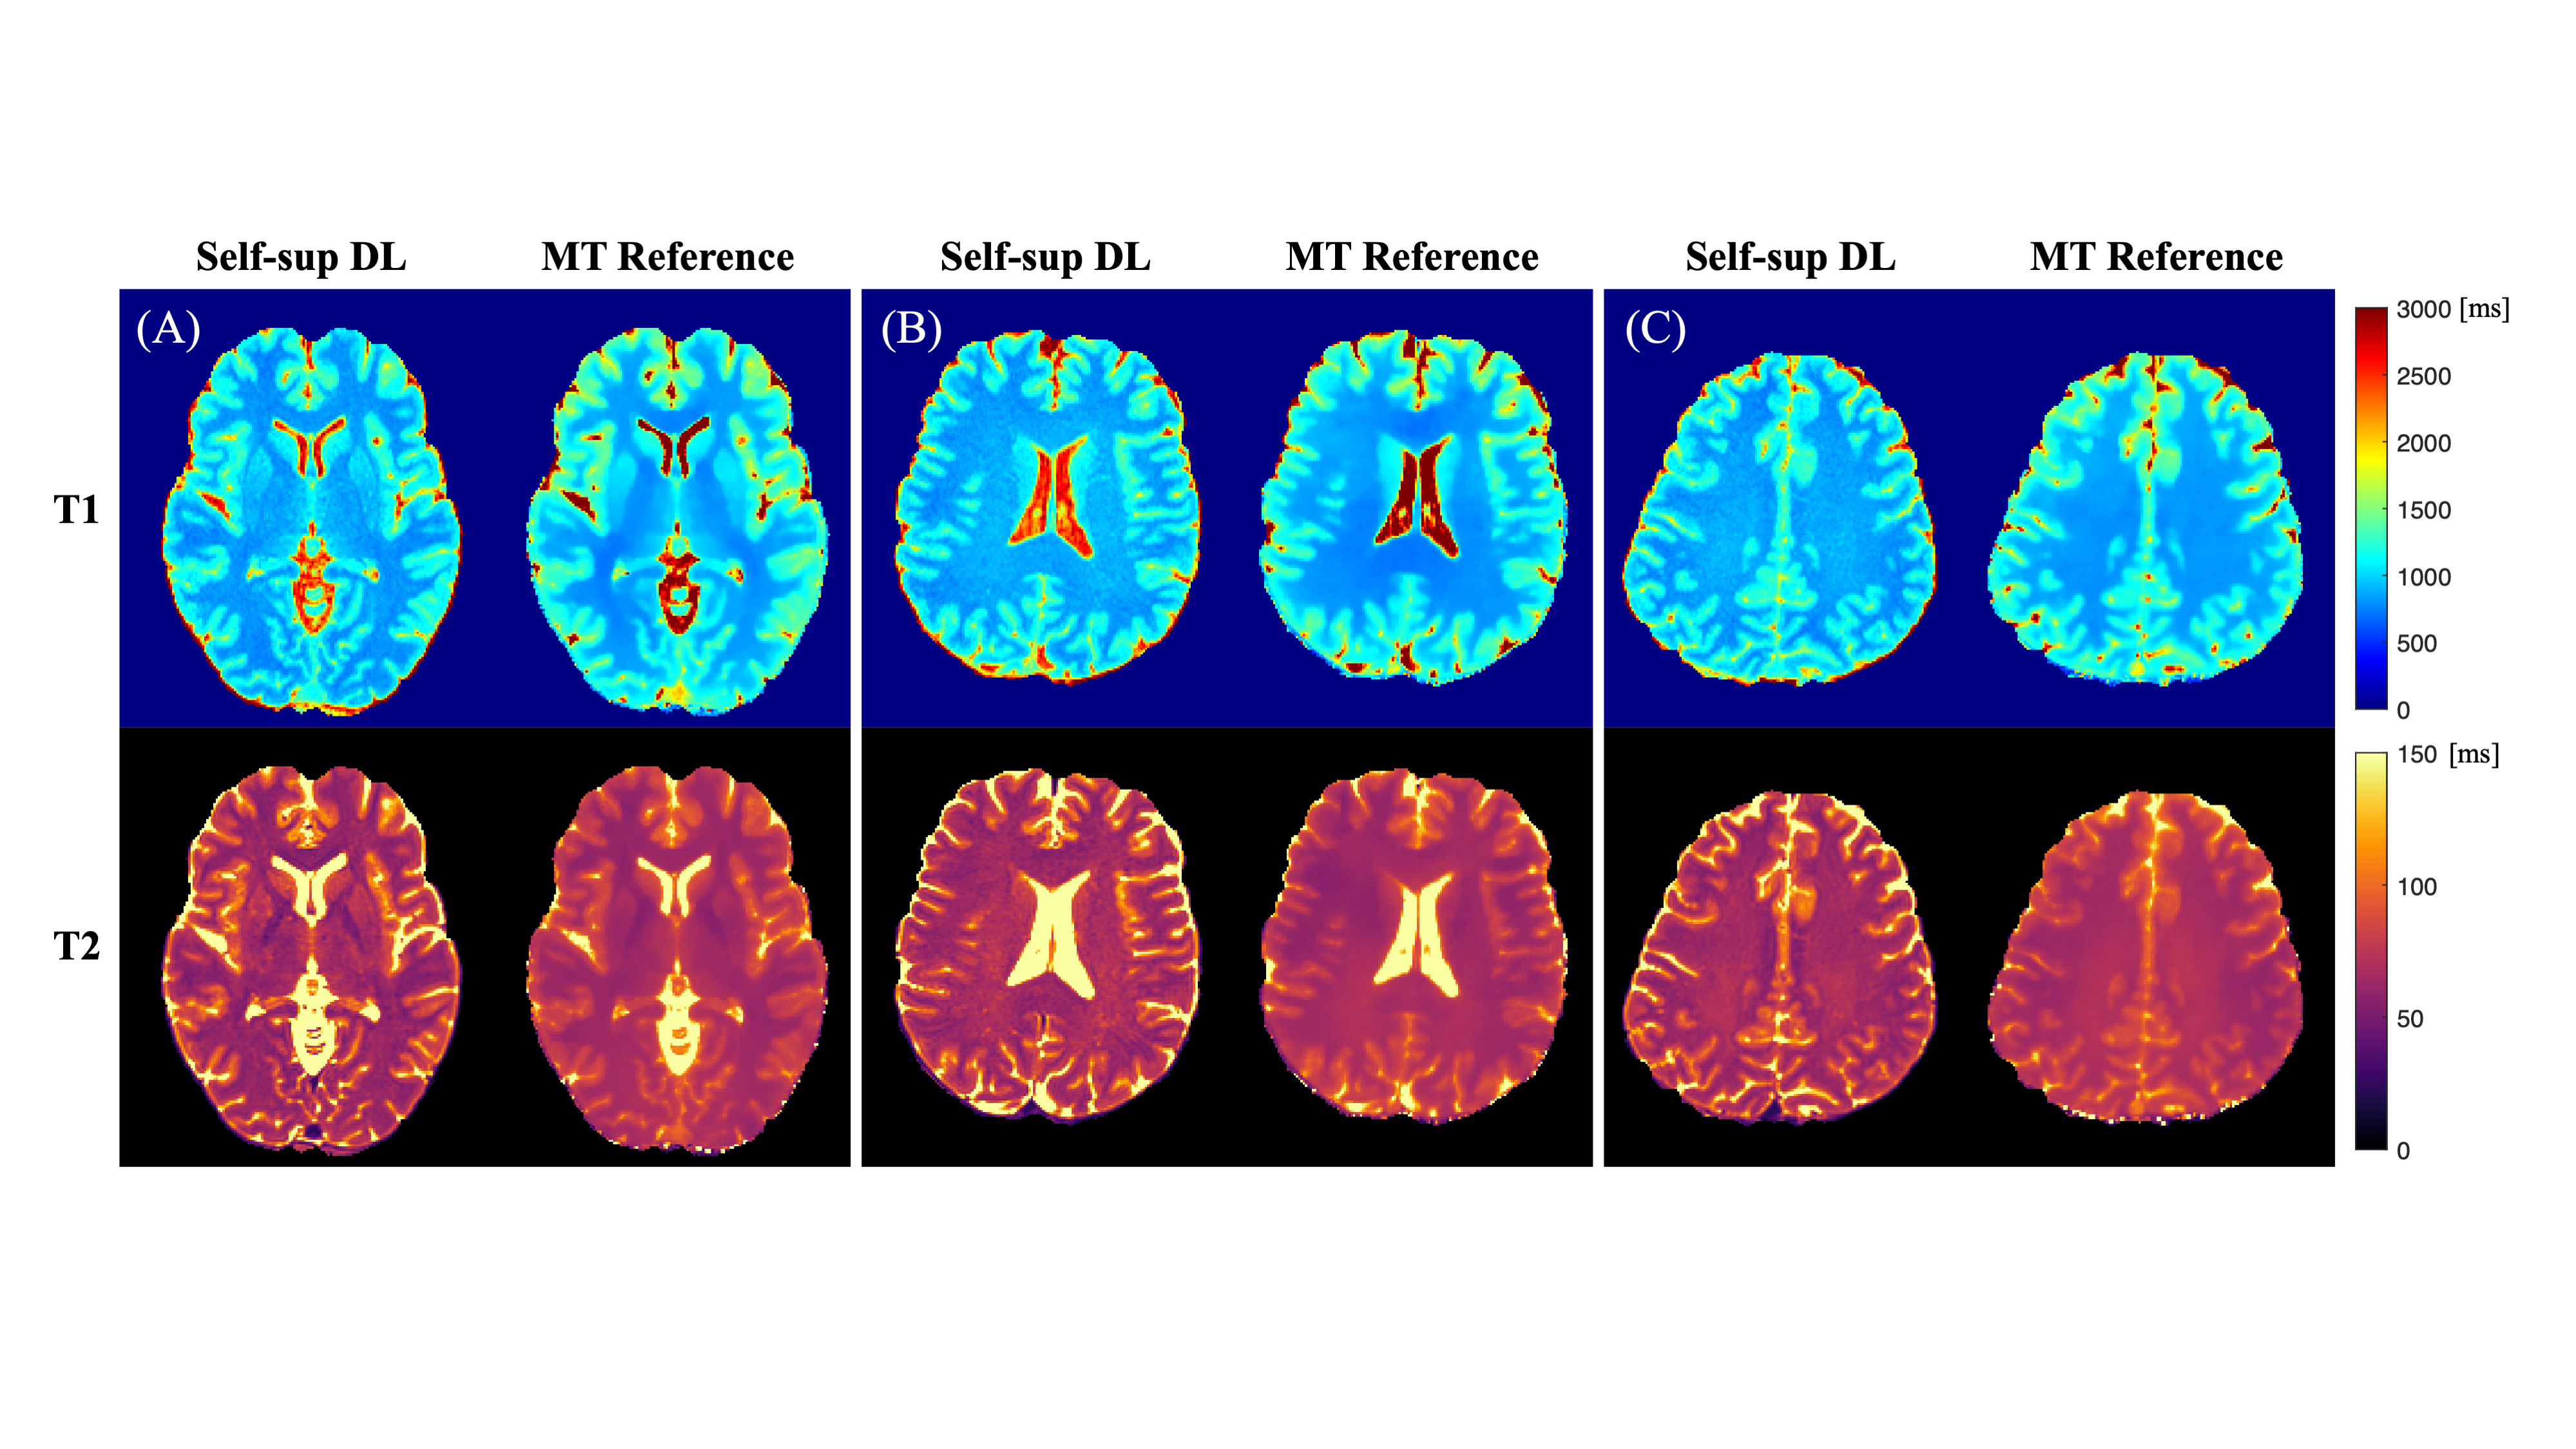
Figure 2. Example slices of T1, T2 maps generated from the proposed method and the reference. Slices from three different subjects are shown, among which (A) is from the subject not included in the training process. The proposed self-supervised learning method provided maps with a comparable appearance to the reference.
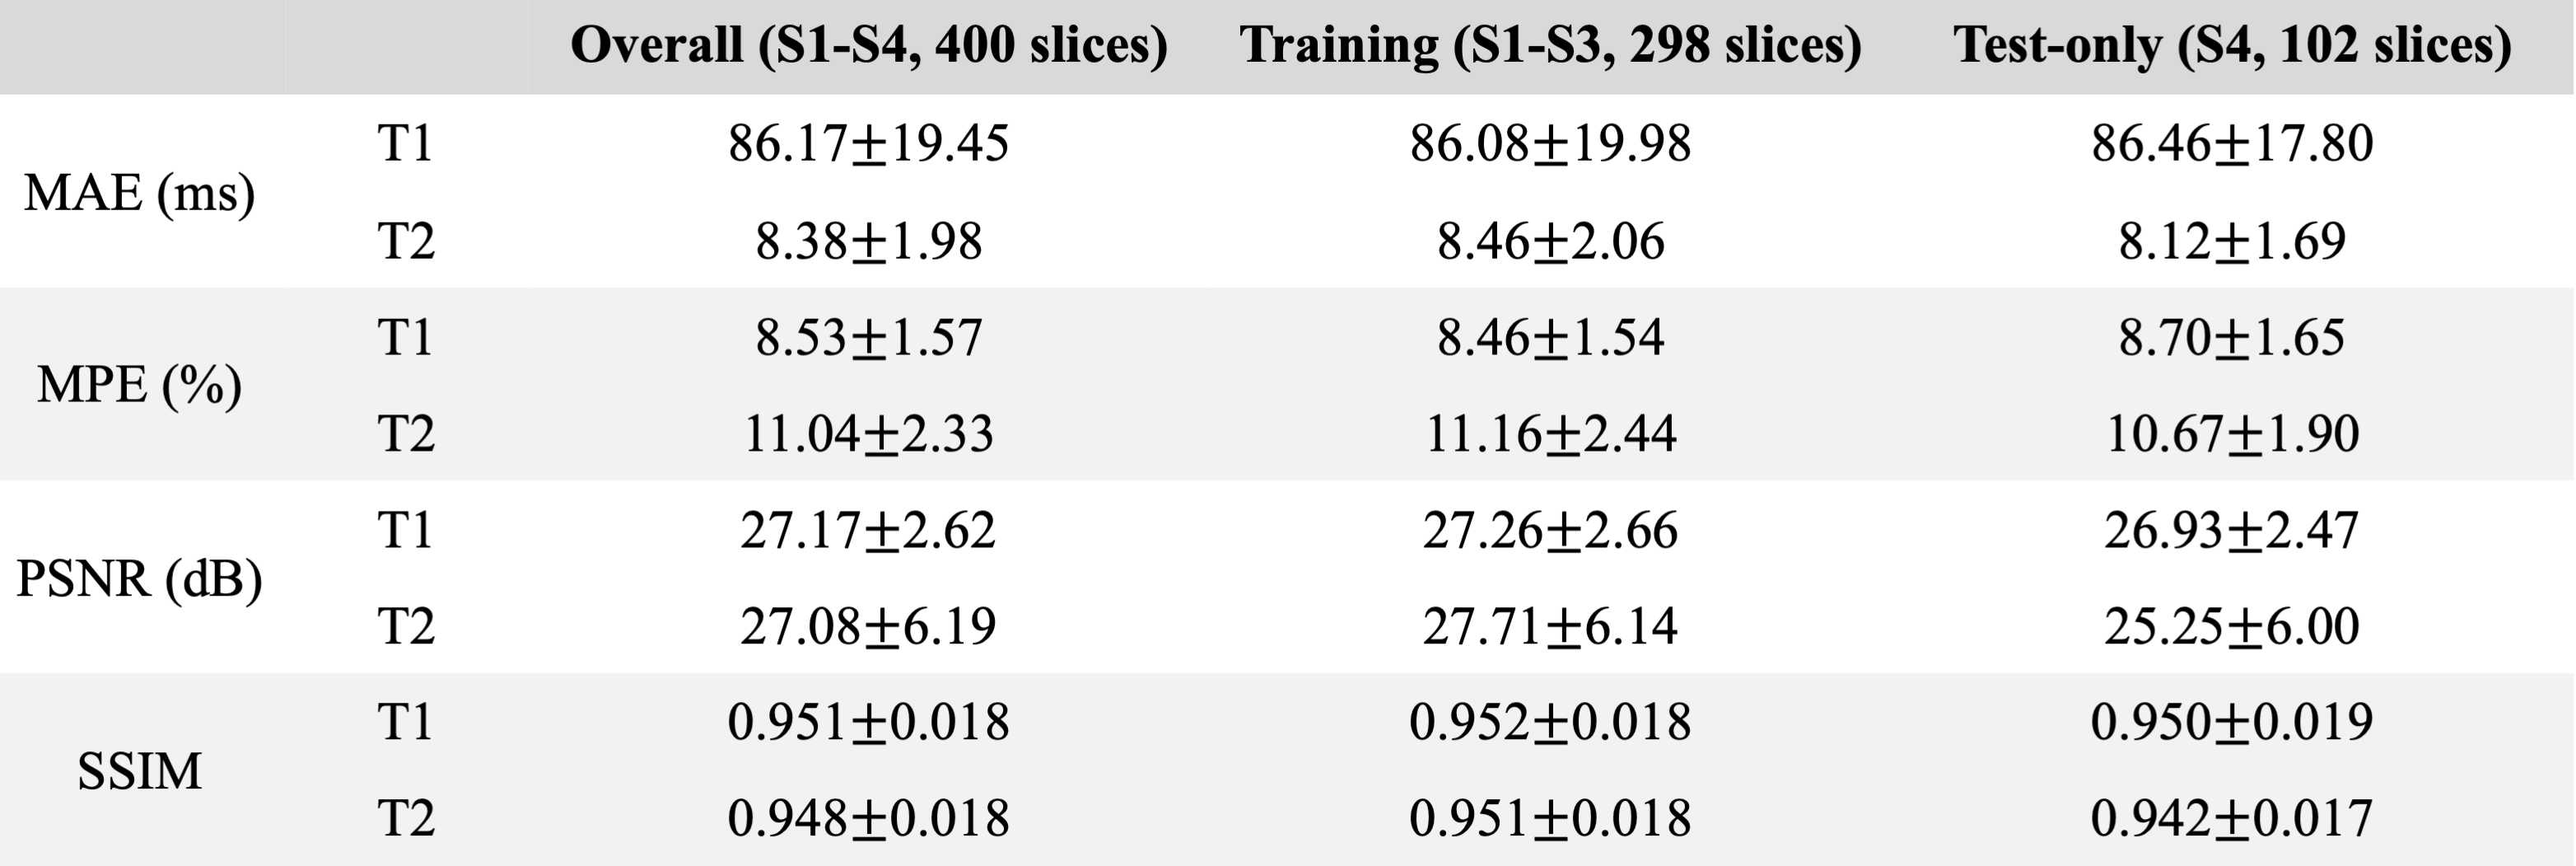
Table 1. A summary of quantitative metrics. MAE and MPE were calculated on brain parenchyma, excluding CSF region, since T1/T2 of CSF is of less interest. PSNR, SSIM were calculated on the whole image. Similar performance was achieved in the training cases and the test-only cases. MAE: mean absolute error, MPE: mean percentage error, PSNR: peak signal-to-noise ratio, SSIM: structural similarity index.
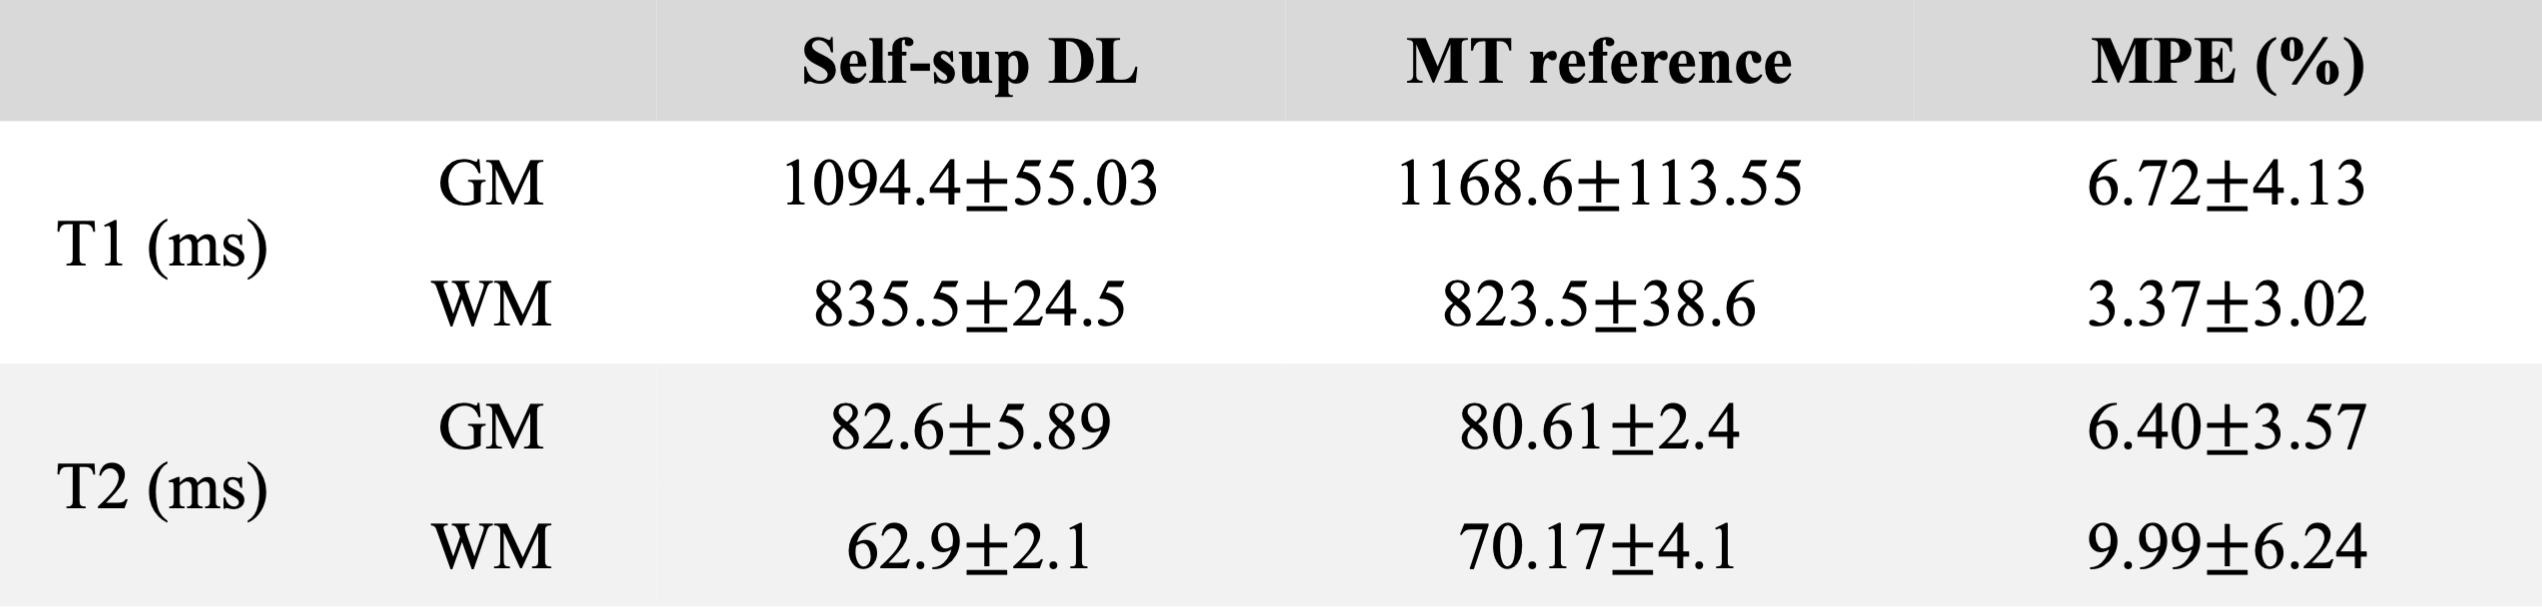
Table 2. T1 and T2 measurements of gray matter and white matter from the proposed method and the MR Multitasking references.
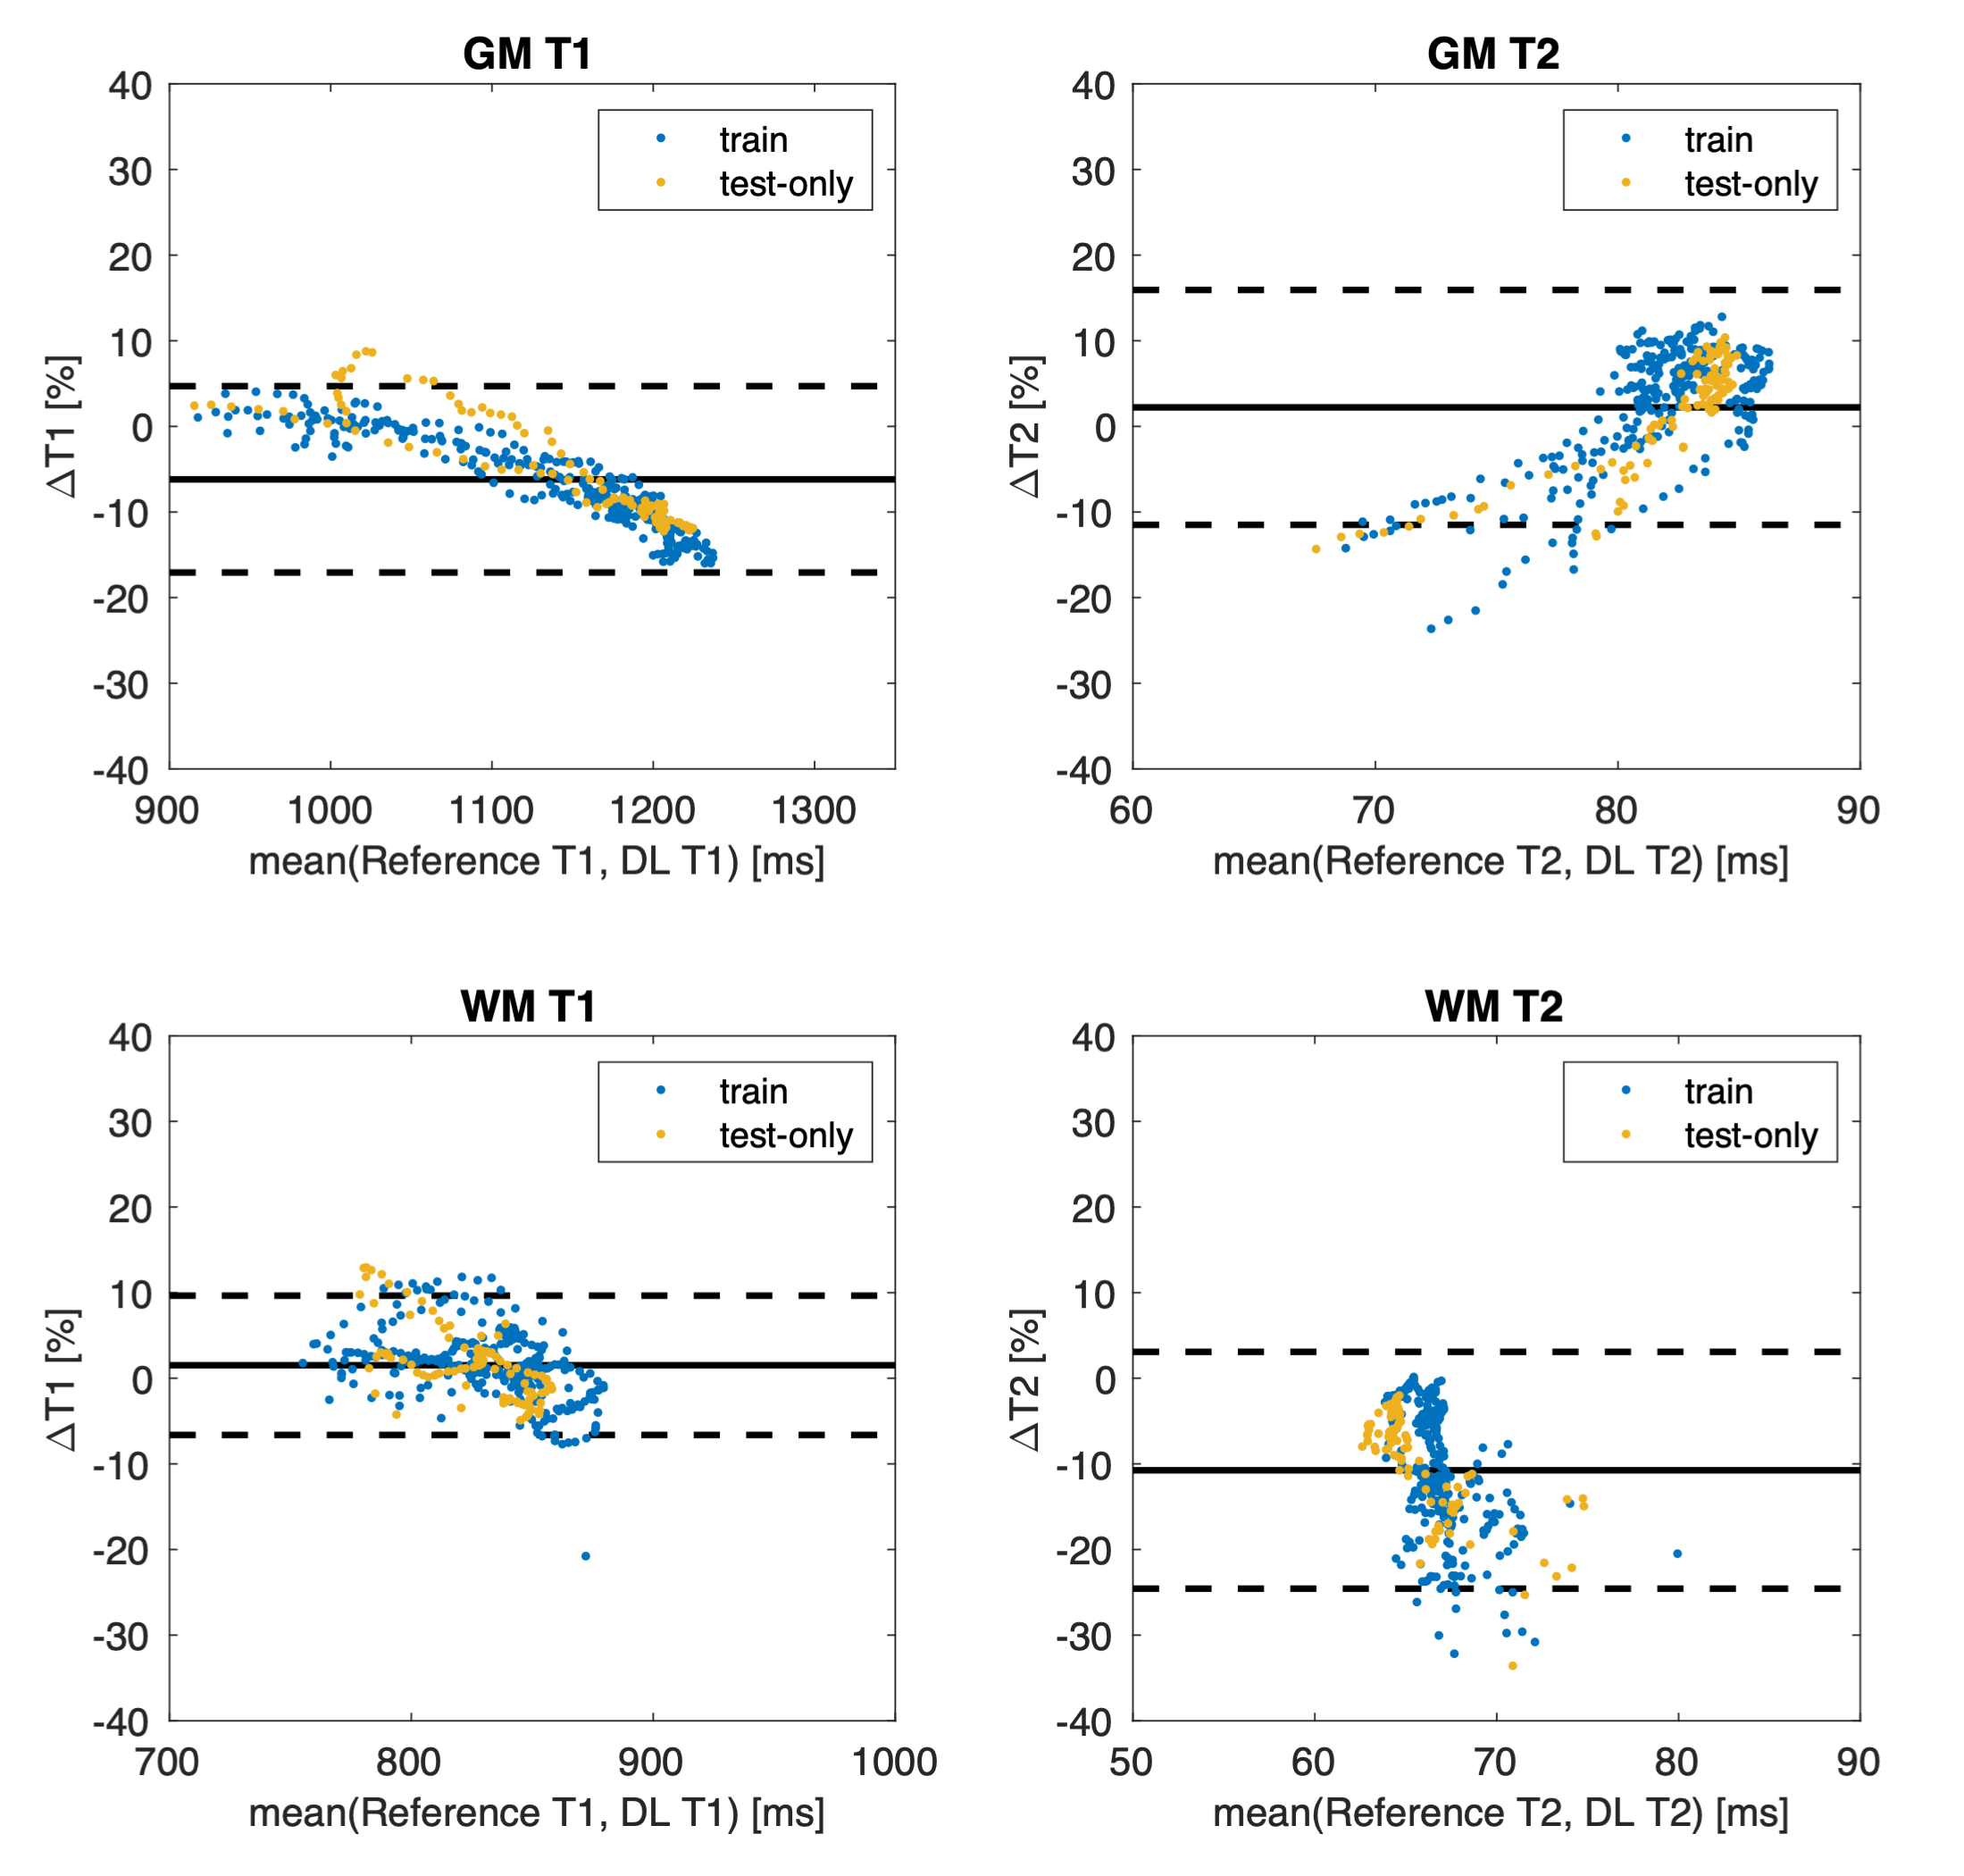
Figure 3. Bland-Altman plots for T1/T2 measurements on gray matter and white matter. Each dot represents measurements from a single slice. The results from the three training subjects and the one test-only subject are shown in different colors.
DOI: https://doi.org/10.58530/2023/2168