2165
Mapping of relative temperature changes through quadrupolar transverse H217O relaxivity in phantom and validated in rat at 7T and 16T UHF
Hannes M. Wiesner1, Tao Wang1, Xin Li1, Wei Zhu1, Kelsey Haney1, Xiao-Hong Zhu1, and Wei Chen1
1CMRR, Department of Radiology, University of Minnesota, Minneapolis, MN, United States
1CMRR, Department of Radiology, University of Minnesota, Minneapolis, MN, United States
Synopsis
Keywords: Quantitative Imaging, Thermometry
In this study we evaluate the application of linewidth thermometry using the transverse relaxation of natural abundance 17O on leading human and preclinical high-field MRI platforms. It could be beneficial as a simple and fast alternative approach compared to the phase method to assess temperature. We validated it in post-mortem rodents after preparations on phantoms. Furthermore, due to the lower operating frequency some high-field challenges could be ameliorated with the right choice of volume to signal acquisition ratio.
Introduction
The 17O MRSI/MRI at UHF is promising for direct measurement of oxygen metabolism and perfusion in both animal and human brains using non-radioactive tracer, although it is challenging to achieve high resolution due to short field-independent quadrupolar relaxation times and low SNR.1,2 In connection with the low 17O gyromagnetic ratio, the thermal tumbling of H217O resonance makes its linewidth/T2* dependent on the local chemical environment (such as temperature), more so than macro field inhomogeneities. This motivates this exploration of a robust yet simple method using the relaxation of H217O resonance to measure of relative temperature changes in phantoms and tissues as an alternative imaging tool to other existing approaches.3Methods
Phantom validation on a human 7T scannerPhantom measurements were performed at 7T on a human clinical system (Terra, Siemens, Erlangen, Germany) from 2L 50mM NaCl solution with natural abundance H 2 17 O glass sphere with a dual tuned 1 H/ 17 O quadrature coil (loop diameter 15cm). CSIs with FSW technique were acquired at TR=70ms, 45° flip angle, 20cm 3 FOV, of 19x19x15 matrix size, spectral bandwidth of 30 kHz/1024pts, 4 averages in a total acquisition time of 4min per 3D CSI volume. The phantom was immersed in a warm water bath(+42°C), as measured with a thermocouple sensor. The temperature was then measured at further timepoints between the acquisitions at 39°C(t=15min) 33.5°C (t=86min) and 31.9°C (t=113min) and between points interpolated for the actual times of the measurements by a mono-exponential function (40-exp -0.0018 ).
Acquisitions on a preclinical 16.4T system
Acquisitions were performed using FID and CSI at 16.4T scanner (Paravision, Bruker MRI Neo, Ettlingen, Germany) from a 77mM NaPiO4 cylindric water phantom of natural abundance H217O. RF signal detected with a custom-built 1 cm diameter dual-turn, double tuned 1H/17O surface coil. FIDs were acquired with a TR=70ms, 256 BW 4kHz/512 points, after FA45 degree excitation by a 0.1ms hard pulse. 256 averages were accumulated within a single set in 17s with a series of 100 repetitions were measured in 29 minutes each. Several of measurement series were used to observe changes in equilibration to room temperature (e.g. 39-27°C). The temperature inside the cylindric phantom was measured by a shielded thermocouple sensor on the opposite of the surface coil.
In-vivo and post-mortem rodent validation
A male Sprague-Dawley rat (233g) was anesthetized with Isoflurane and artificially ventilated maintained at 38°C by a water bath and then euthanized by KCl injection. Procedures were in accordance with the protocol approved by UMN IACUC. A temperature probe was inserted into the right ear canal to approximate brain temperature. Several CSI acquisitions of 5-6min each volume were performed on the rat head while the body cooled down over the course of approx. 120min and the brain temperature was read at regular intervals until 26.3°Cbetween weighted CSI volumes (TR=21ms, TE 1ms, RF 0.2ms/FA 20°/9W, FOV 25x25x25mm3/Matrix 8x8x8, BW 30kHz/512 points in 17.4ms spectral duration, nt=256 averages within a total time of 5min 53s).
Results
Figure 1 illustrates the 7T phantom results showing representative CSI of H217O spectra, resonance linewidth maps measured at 38°C and 32°C, and their ratio map. The results indicate a high sensitivity of the linewidth to the sample temperature changes. Preclinically acquired FIDs from a phantom at 16.4T were phase corrected manually and the linewidths determined at various timepoints and plotted against temperature over 30-minute duration (Figure 2). Global linewidths overall ranged from 45.4 Hz at 39.3°C up to 91.2 Hz at 8°C. The rat brain CSI linewidths were in the range of 120-200 Hz depending on location and temperature and they were fitted to the linear function between linewidth and temperature changes to plot slopes in two representative voxels (Figure 3), indicating a slow slope in the central brain area as compared to the peripheral areas corresponding to faster cooling.Discussion and Conclusions
The sensitivity to measure FHWM linewidth and/or indirectly by fitting the slope of T2* 2 needs a moderate sampling rate. Expectedly the comparison between different field strengths confirmed very similar linewidth, despite small but significant differences in the phantom shape, solvents, and acquisition RF coil/sampling schemes.4 This temperature mapping method should be beneficial to application in brain imaging since the temperature in the brain is extremely narrowly auto-regulated both from a temperature standpoint, but also from several other physiological parameters (pH and oxygenation being the most important ones), resulting significant spatial temperature variation, especially in the brain diseases such as stroke and tumor. The application of 17O temperature mapping could provide an alternative situation, where susceptibility issues hinder the standard phase-measurement approach and enable the investigation of highly temperature dependent pathophysiological changes in the brain. Finally, the imaging sensitivity could be improved by many times if one apply an infusion of high 17O-enriched H217O which is safe.Acknowledgements
NIH grants: R01 MH111413, R01 NS118330, R01 CA240953, U01 EB026978, S10OD028712 and P41 EB015894.References
- Zhu et. al.: 17O relaxation time and NMR sensitivity of cerebral water and their field dependence, Magn Res Med, 45(4), 543-549, (2001),
- Wiesner et. al.: 17O relaxation times in the rat brain at 16.4 tesla, Magn Res Med, 75(5), 1886-1893, (2016),
- Boulant et. al.: FID navigator-based MR thermometry method to monitor small temperature changes in the brain of ventilated animals, NMR in Bio Med (2014),
- Zhu & Chen: In Vivo 17O Measurements of Water Rotational Correlation Time and Hydrodynamic Radius in Rat Brain, Proc. of the ISMRM 2012 #1821.
Figures
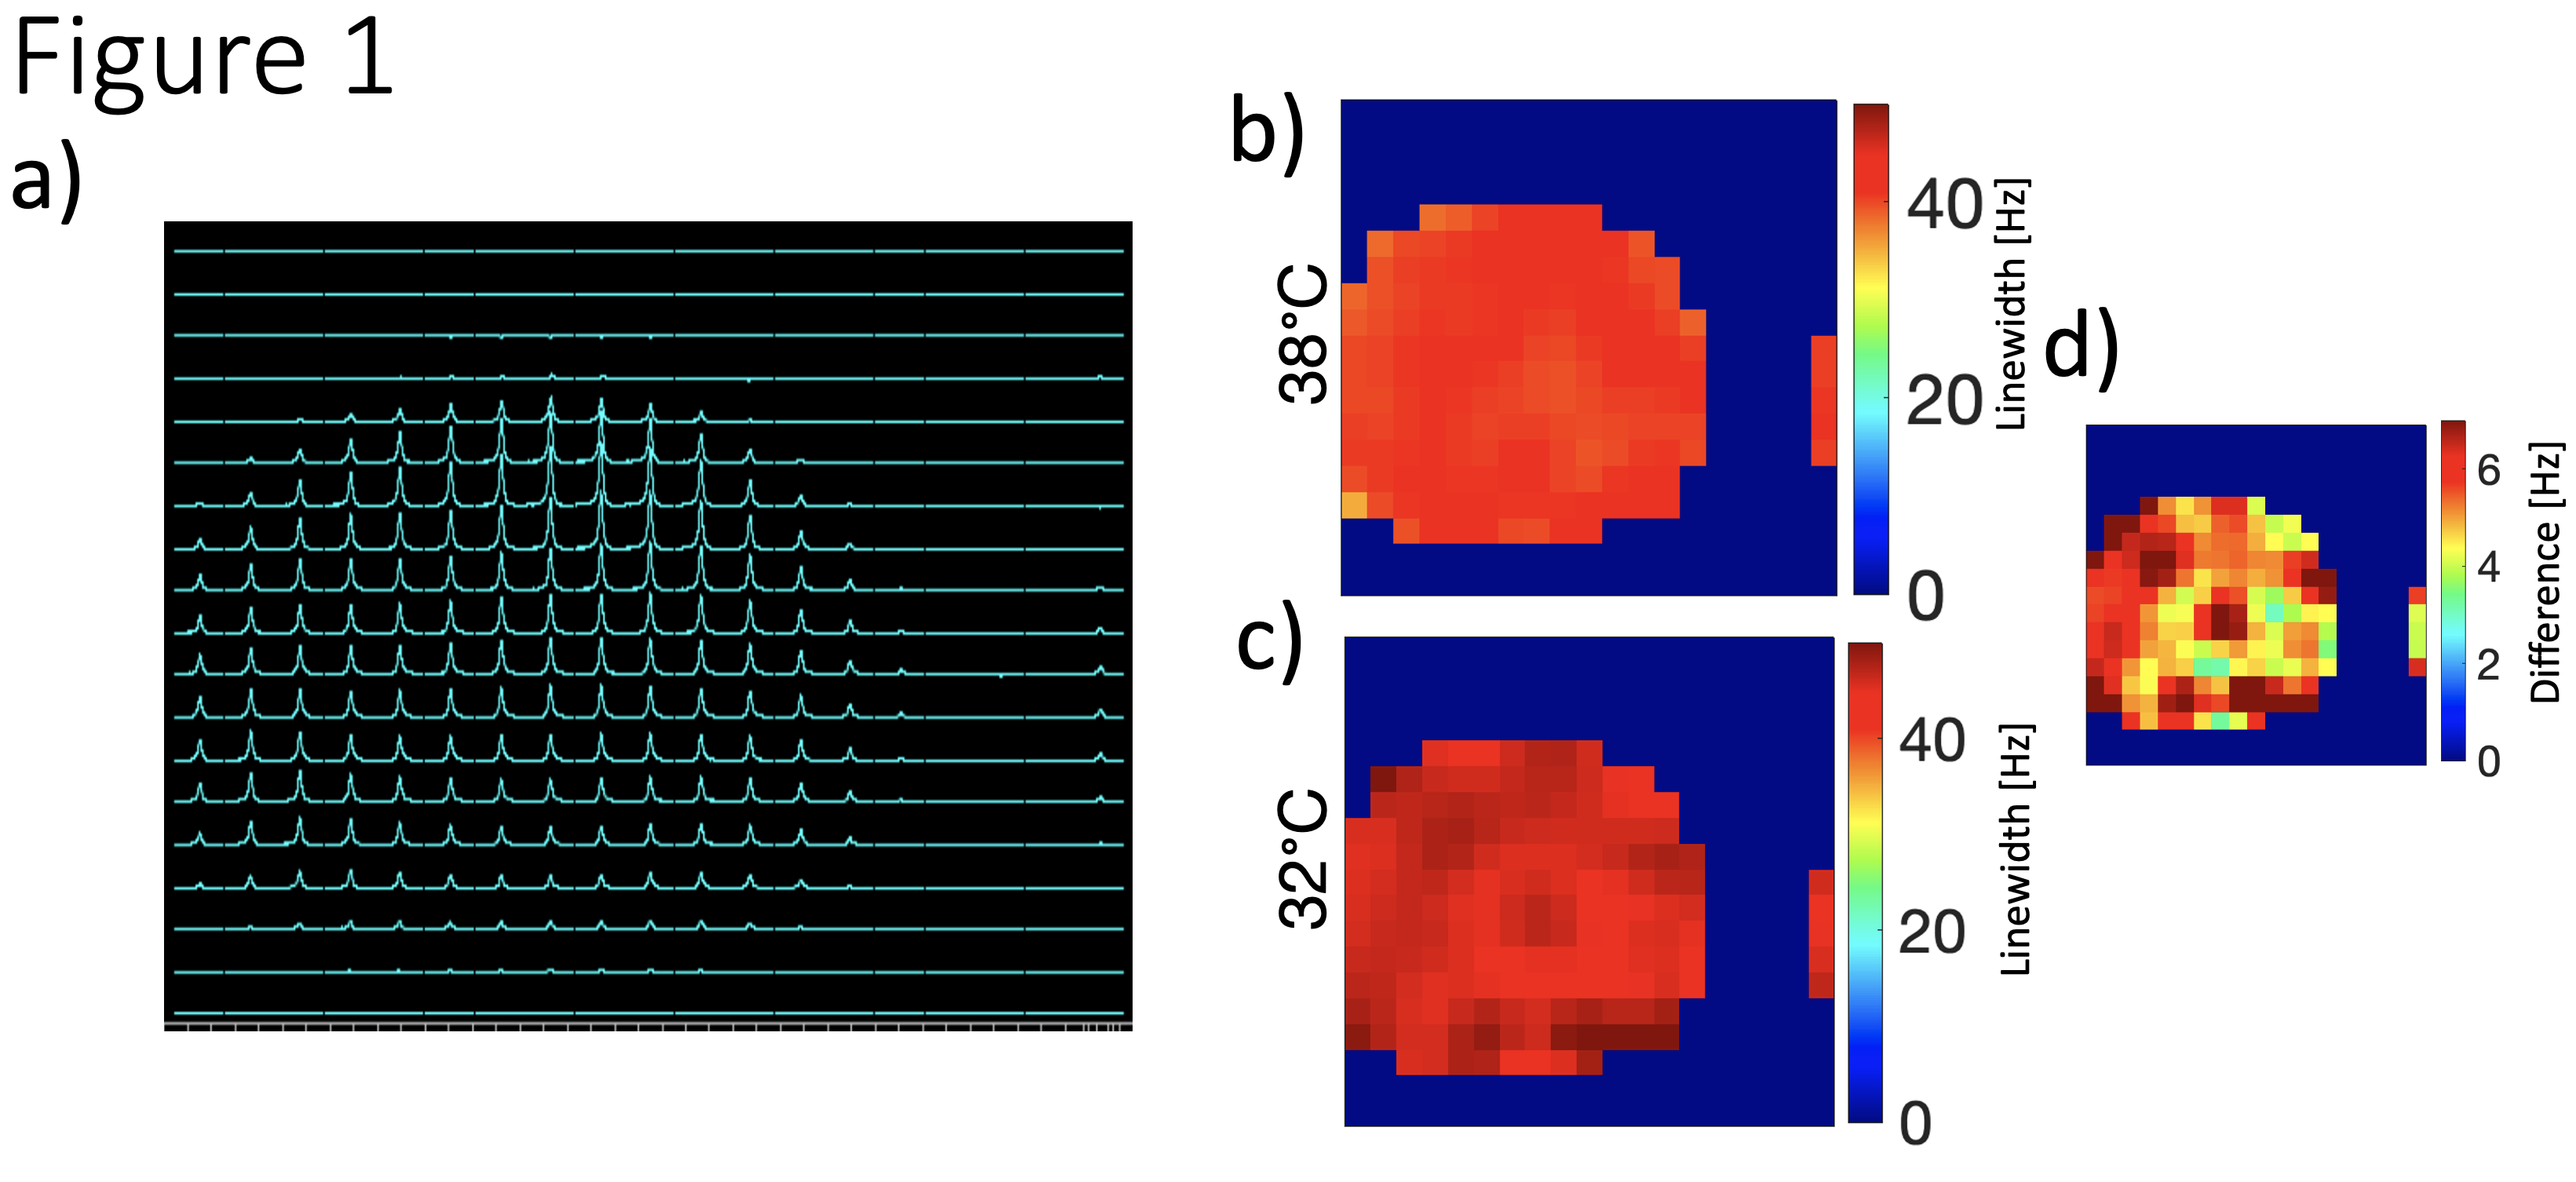
Figure 1. (a) One representative coronal (4 min acquisition) CSI slice of 17O spectra (8 ppm width) acquired at 7T human MRI scanner at the temperature of 38°C through the middle of a large phantom, for quantifying the signal intensity and linewidth distributions as demonstrated in (b) 38°C and (c) 32°C. (d) The 17O water resonance linewidth difference map between the warm and colder phantom condition.
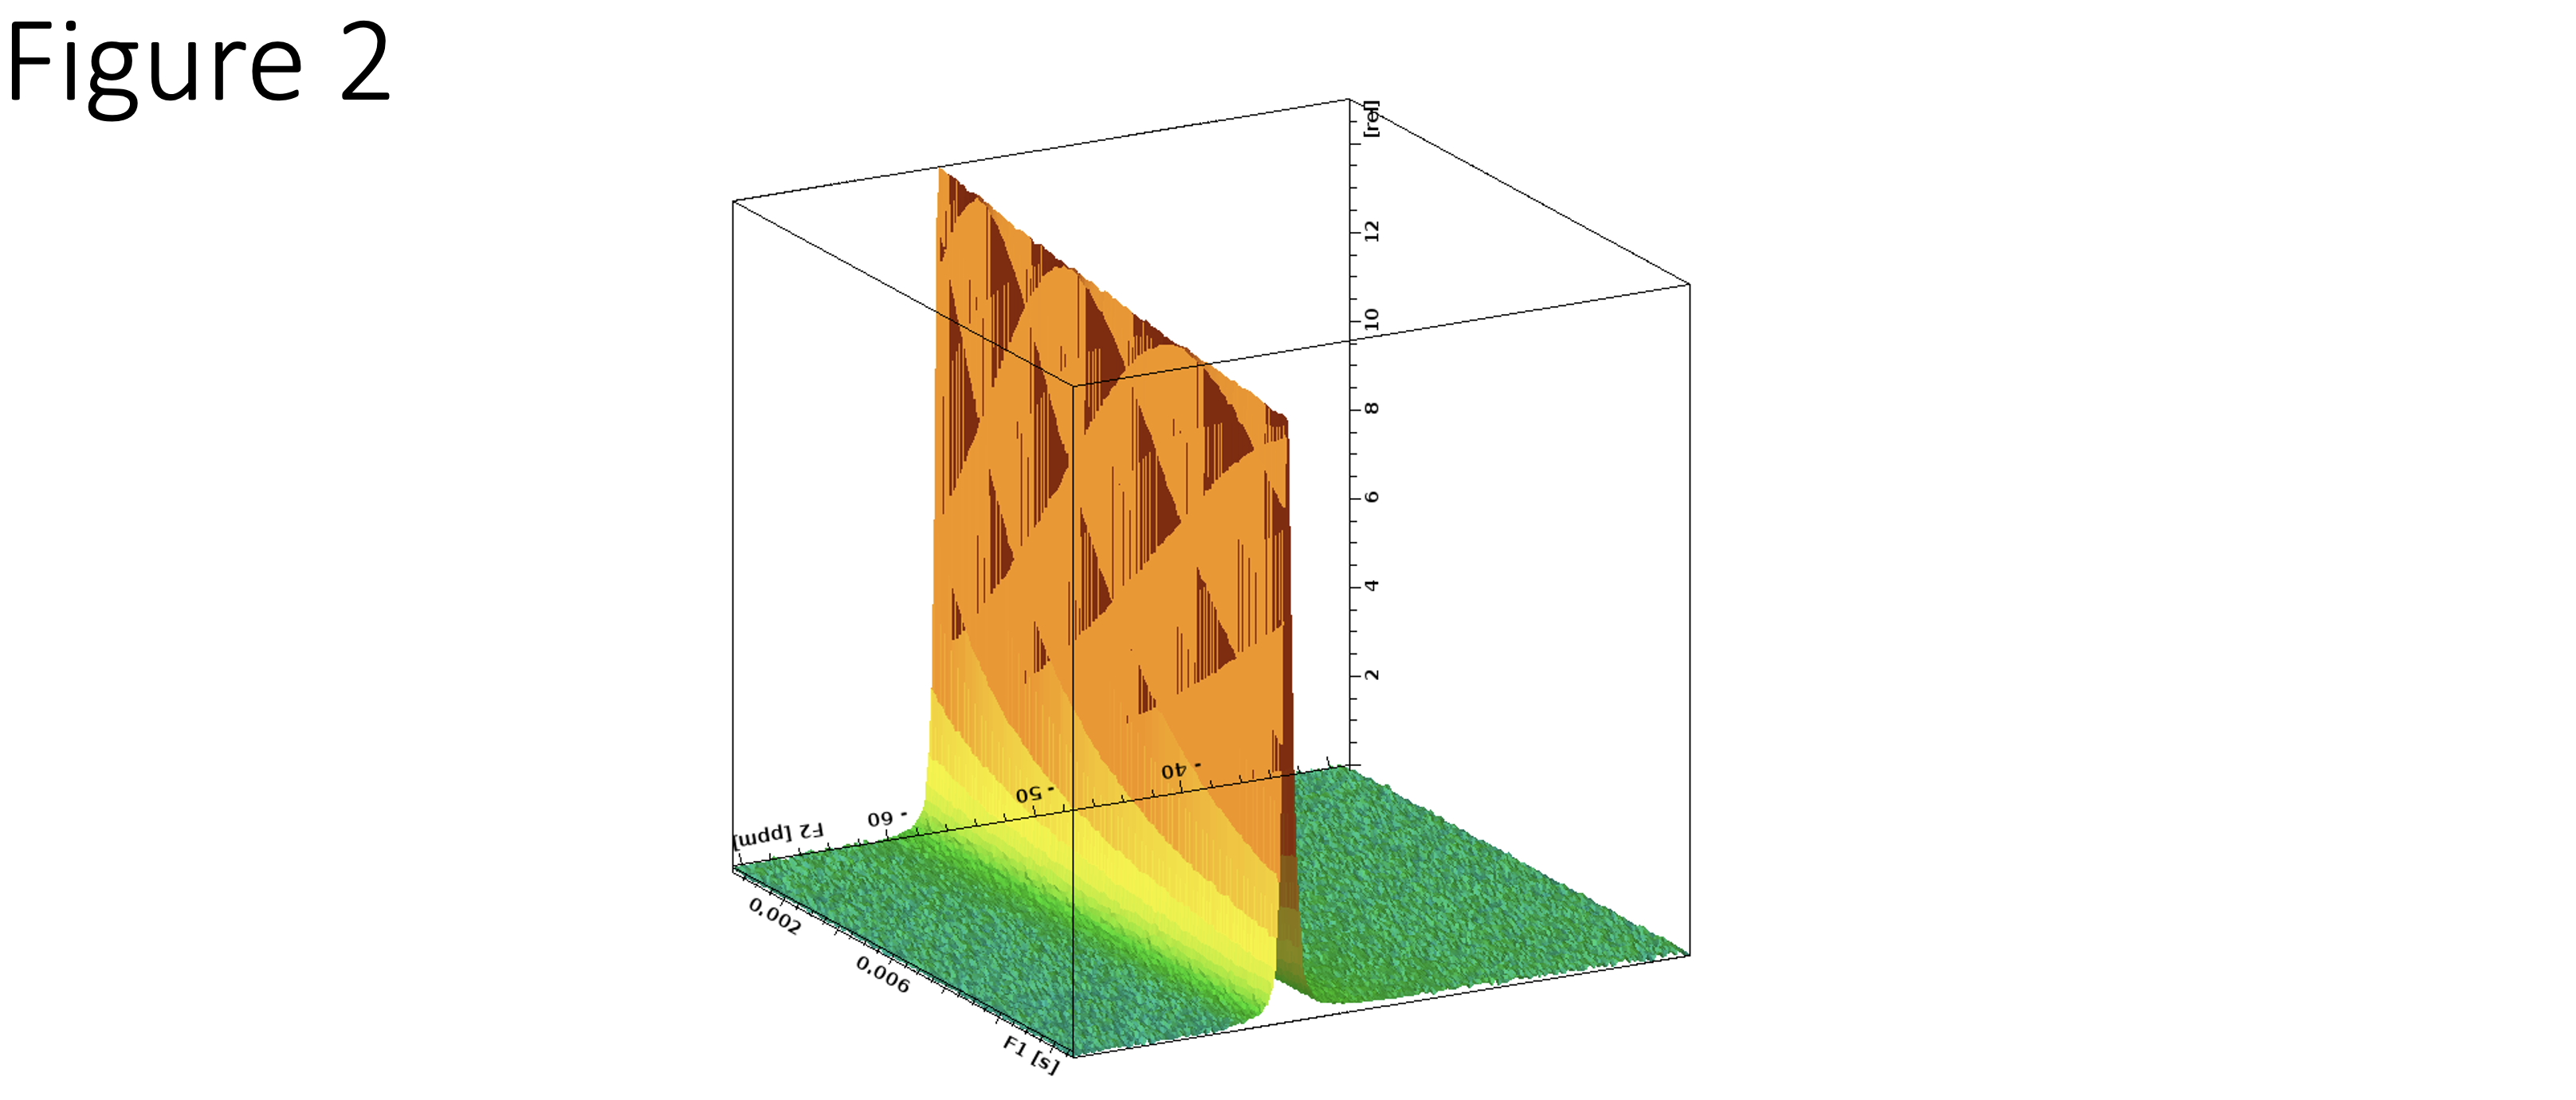
Figure 2. Stacked time course plot of 100 global FID-NMR spectra of a water phantom at natural abundance of H217O concentration over 30 min acquired at 16T, during the cooling process from 39°C to 28°C. The narrowing linewidth at higher temperatures is showing by the higher peak intensity in an exponential, but almost linear fashion, demonstrating the correlation between the H217O linewidth or intensity and sample temperature.
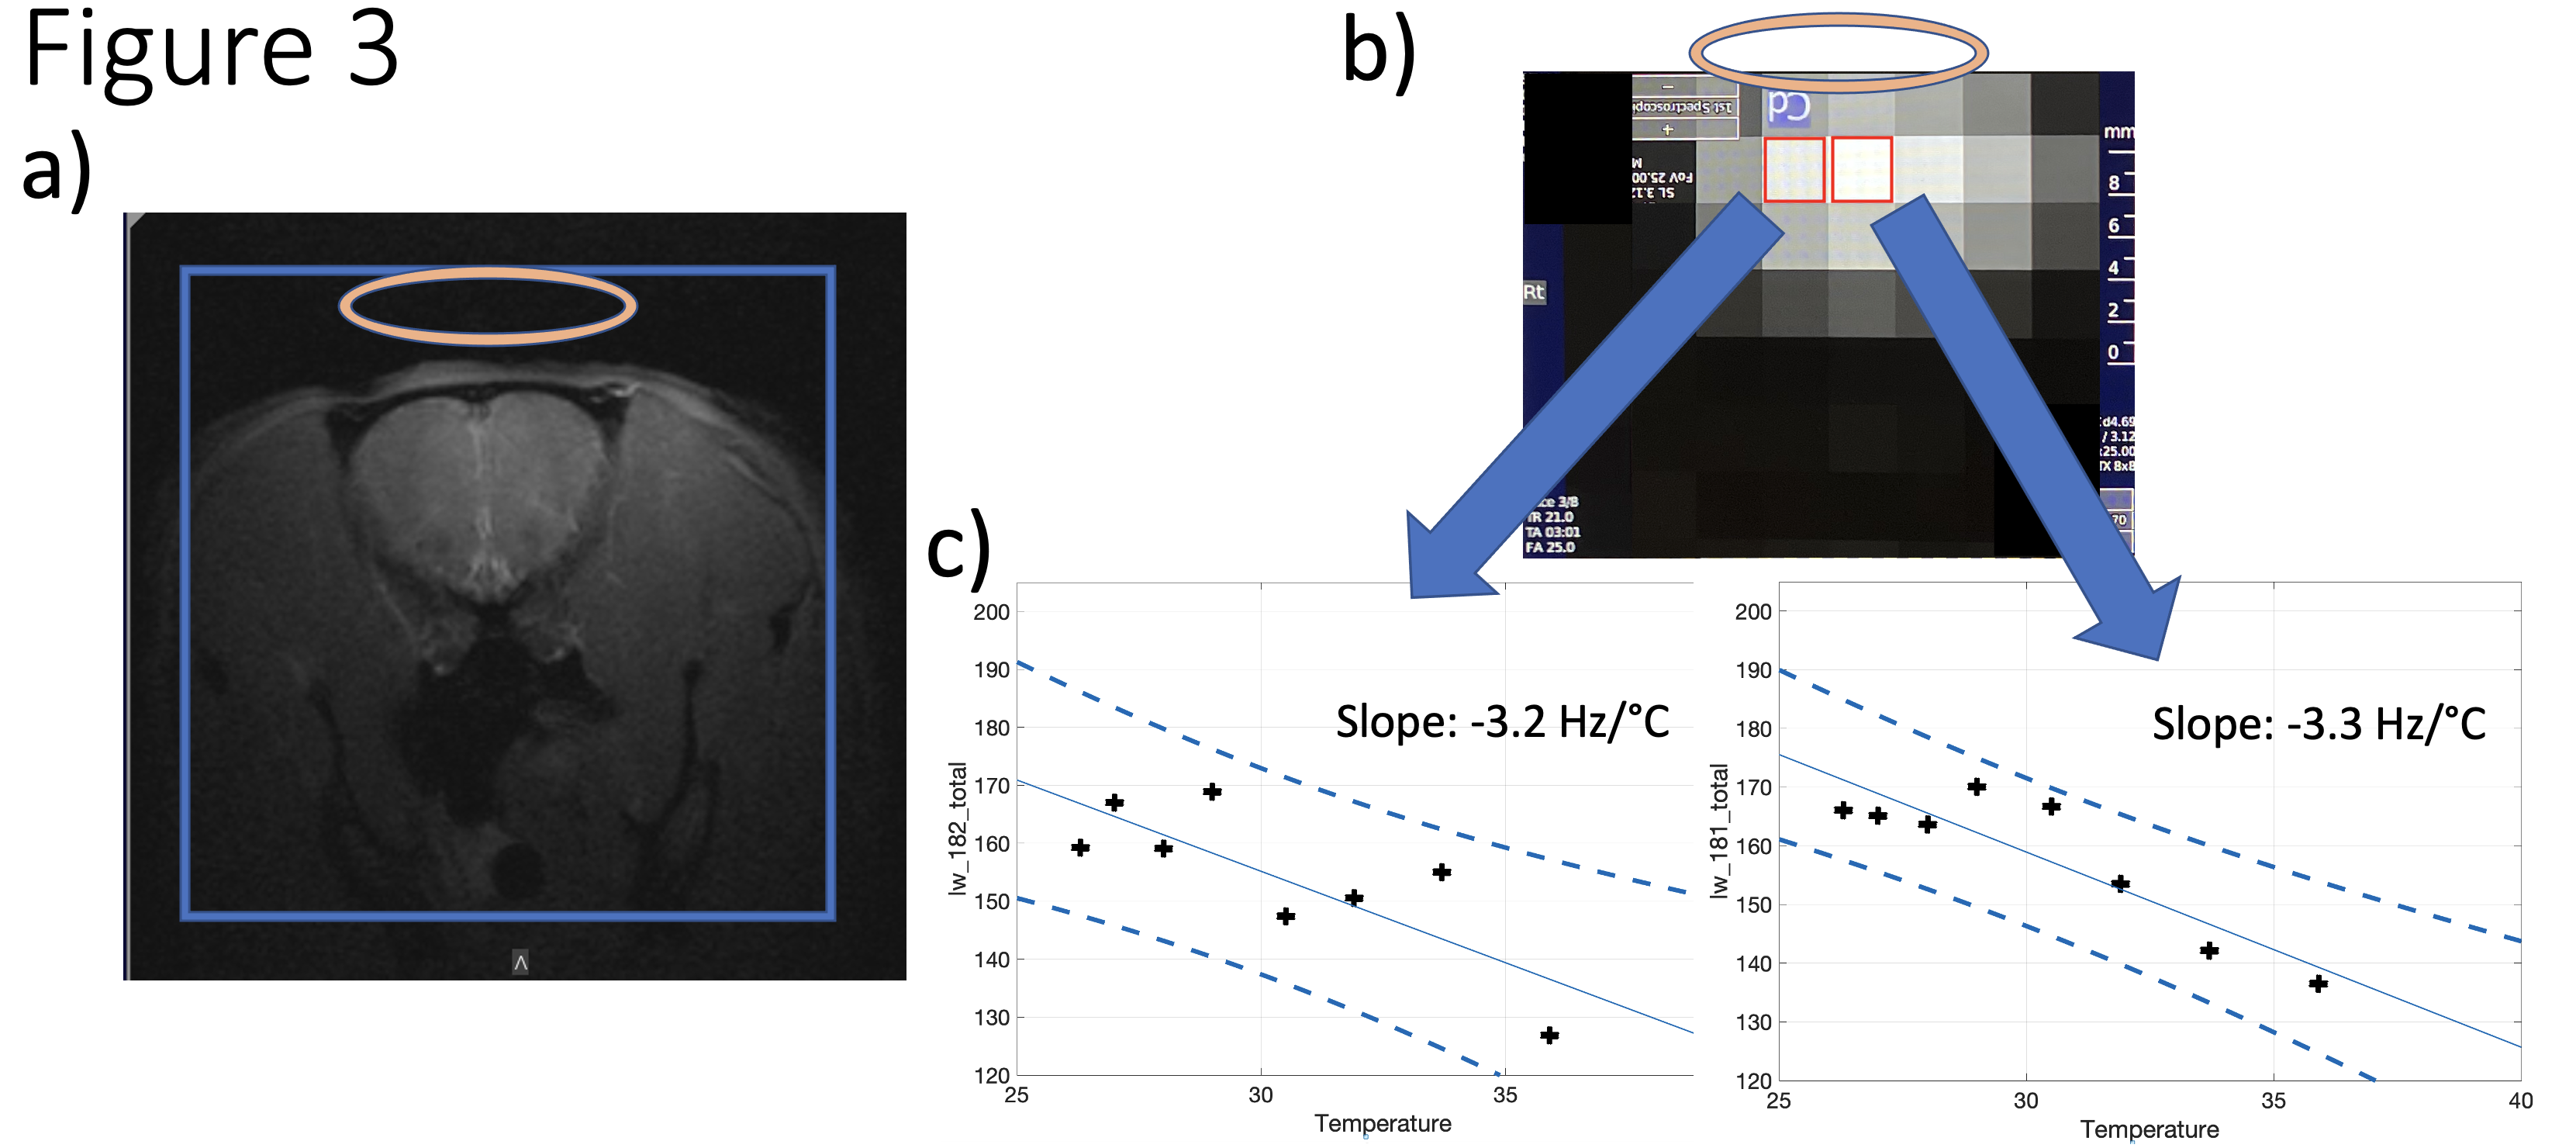
Figure 3. (a) A representative 1H anatomical FLASH MRI of a rat coronal slice acquired at 16T, corresponding to the 17O CSI thermometry with linewidth estimation (RF coil position by oval) shown in (b). Slope fitting was performed over several different temperatures measured in the ear canal. Individual fits are shown for the highlighted voxels in (b) showing a slope of -3.2Hz/°C and 3.3Hz/°C, respectively. Thereby showing a warm center and faster cooling periphery (90% confidence bounds shown in the dashed).
DOI: https://doi.org/10.58530/2023/2165