2161
Comparison of Constrained Quantitative BOLD with Dual-Gas Calibrated BOLD for 3D Mapping of Cerebral Oxygen Extraction Fraction1School of Electronics Engineering, Kyungpook National University, Daegu, Korea, Republic of, 2Department of Radiology, University of Pennsylvania, Philadelphia, PA, United States, 3Department of Radiology, Clinica Universidad de Navarra, Pamplona, Spain
Synopsis
Keywords: Quantitative Imaging, Metabolism
Recent advances of the cBOLD technique by means of dual-gas calibration have shown its ability in producing baseline OEF and CMRO2 in absolute physiologic units. A recently proposed constrained qBOLD method has shown its feasibility in proper separation of numerous confounders, yielding physiologically plausible values for both Yv and DBV across the entire brain. The purpose of this work was to compare the two oximetric techniques, dual-gas cBOLD versus constrained qBOLD, in terms of measured OEF and CMRO2 at baseline. Results suggest that the two methods yield statistically insignificant differences in OEF and CMRO2 quantifications for GM regions.
Introduction
Paramagnetism of deoxygenated hemoglobin (dHb) perturbs local magnetic fields, thereby modulating the MR signal, a well-known BOLD contrast mechanism. Thus, dHb concentration in the venous blood ([dHb]v) and deoxygenated blood volume (DBV) are the two critical determinants of the BOLD signal1,2. Calibrated BOLD (cBOLD)3 aims to find a calibration constant (termed ‘M’) incorporating the two parameters by comparing the BOLD signal in two states of the brain – one at baseline and one in an isometabolic (e.g., hypercapnia) state. While early attempts4,5 were only able to yield relative changes of oxygen extraction fraction (OEF) and cerebral metabolic rate of oxygen (CMRO2) in response to neural stimulations, recent advances of the technique by means of dual-gas calibration have shown its ability in producing baseline OEF and CMRO2 in absolute physiologic units6,7.Quantitative BOLD (qBOLD)8,9 is another class of methods that does not require a gas breathing challenge, and thus is calibration-free. The method models dHb-induced signal modulations in the extravascular compartment, and seeks to quantify both [dHb]v (or venous oxygen saturation Yv via [dHb]v = [Hb](1-Yv)) and DBV by estimating the RF-reversible component of the transverse magnetization (i.e., R2′). A key challenge in qBOLD is to separate the contributions from the four mechanisms that affect the temporal signal decay: R2, R2′ from heme (R2,h′) and non-heme (R2,nh′) iron contributions, and macroscopic magnetic field variations (ΔB0). Furthermore, disentangling R2,h′ into Yv and DBV is a nontrivial problem due to the parameters’ mutual coupling10. A recently proposed constrained qBOLD method11 has shown its feasibility in proper separation of the above-mentioned confounders, yielding physiologically plausible values for both Yv and DBV across the entire brain.
The purpose of this work was to compare the two oximetric techniques, dual-gas cBOLD versus constrained qBOLD, in terms of measured OEF and CMRO2 at baseline.
Methods
Data were acquired in 13 healthy subjects at 3T (Siemens Prisma) using both dual-gas cBOLD and qBOLD protocols. The dual-gas cBOLD protocol consists of three successive episodes – normocapnic/normoxic baseline (6 min), hyperoxia (~ 50% inspired O2; 6min), and hypercapnia (~6% inspired CO2; 6min). Target gas mixtures were administered to the subject via the RespirAct system (Thornhill Research). In each episode, a recently introduced pulse sequence (termed ‘OxBOLD’)12, comprising 3D stack-of-spirals pCASL (for CBF mapping), T2*-weighted multi-slice 2D spiral (for BOLD imaging), and dual-echo GRE (for Yv estimation at superior sagittal sinus (SSS)) acquisitions, was repeatedly applied (20 pairs of pCASL control/tag). See Reference 12 for detailed sequence structure.Baseline OEF mapping from the dual-gas cBOLD data was performed by following the processing steps in Reference 6. Briefly, the calibration parameter M was derived by comparing baseline and hypercapnic CBF/BOLD signals, followed by OEF derivation using the determined M, and baseline and hypercapnic CBF/BOLD images. Here, M-calibration was carried out using two different approaches, based on: 1) Davis model4 assuming isometabolism of the hypercapnic challenge, and 2) OxBOLD model12 measuring Yv of SSS without the isometabolic assumption in 1). Gray matter (GM) averages of M obtained using the two models were statistically compared.
The qBOLD protocol consists of three pulse sequences: alternating unbalanced SSFP-FID and SSFP-ECHO (AUSFIDE; 8min)13 yielding a set of volumetric maps (R2, R2′, voxel susceptibility, ΔB0), velocity-selective venous-spin-labeling (VS-VSL; 3.3min)14 for 3D venous blood volume estimation, and 3D stack-of-spirals pCASL (4.5min)15. Parametric maps obtained from AUSIFDE and VS-VSL data serve as prior information in solving a constrained qBOLD problem11, leading to 3D maps of Yv, DBV, and R2,nh′ across the entire brain. See Reference 11 for processing details in the constrained qBOLD mapping. Given the measured Yv, OEF was computed by OEF = 1-Yv/Ya with Ya = 0.98 (hemoglobin oxygen saturation of arterial blood) assumed.
Given the baseline OEF measurements along with pCASL-derived CBF, baseline CMRO2 maps were computed in dual-gas cBOLD and qBOLD methods, respectively, using the Fick’s Principle equation CMRO2=Ca·CBF·Ya·OEF (Ca: oxygen carrying capacity of arterial blood). GM averages of OEF and CMRO2 across 13 study subjects were compared using paired t-tests.
Results
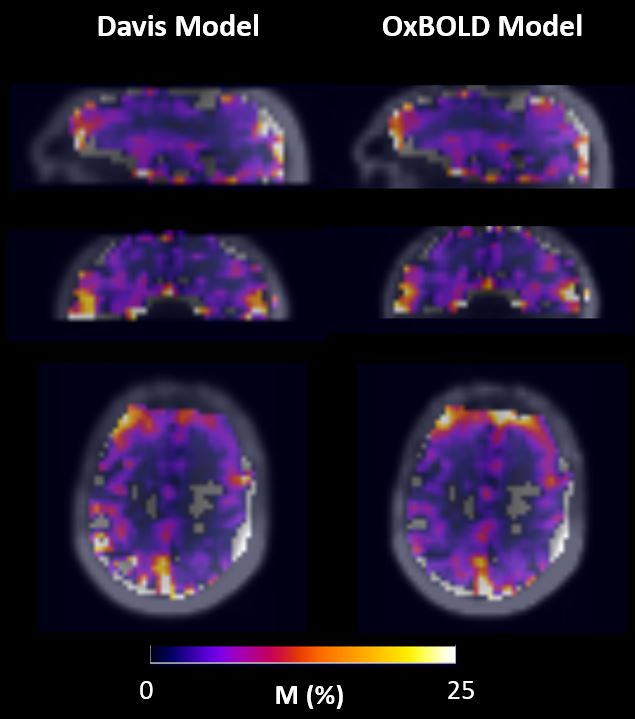
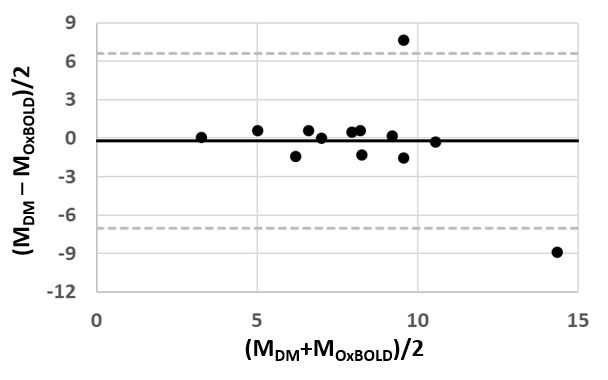
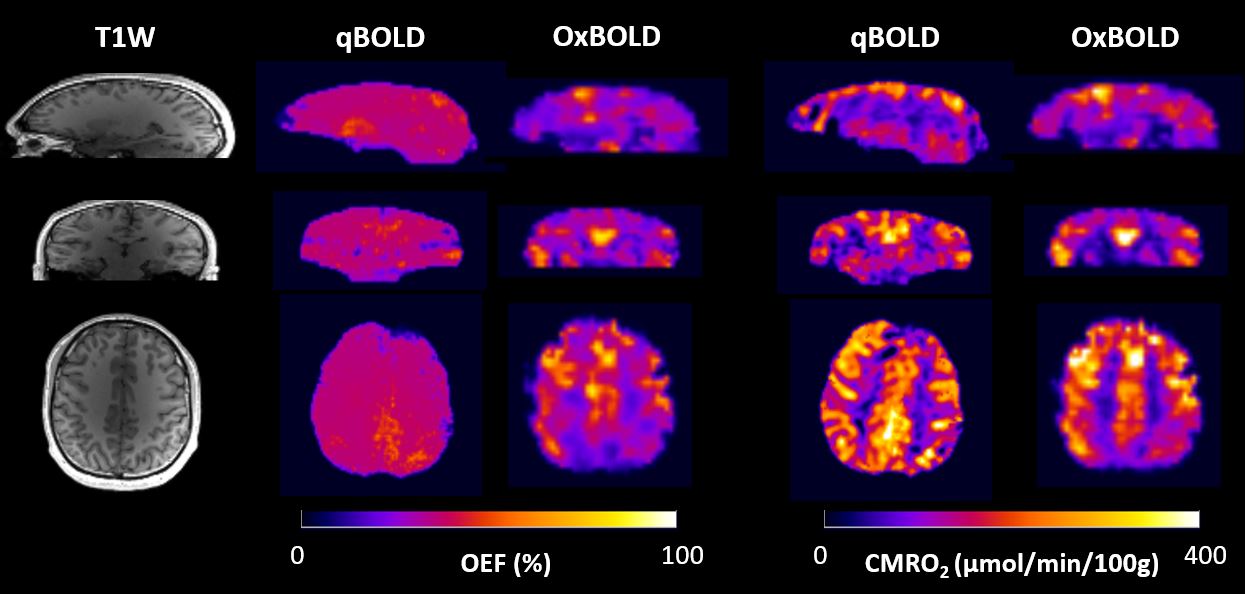
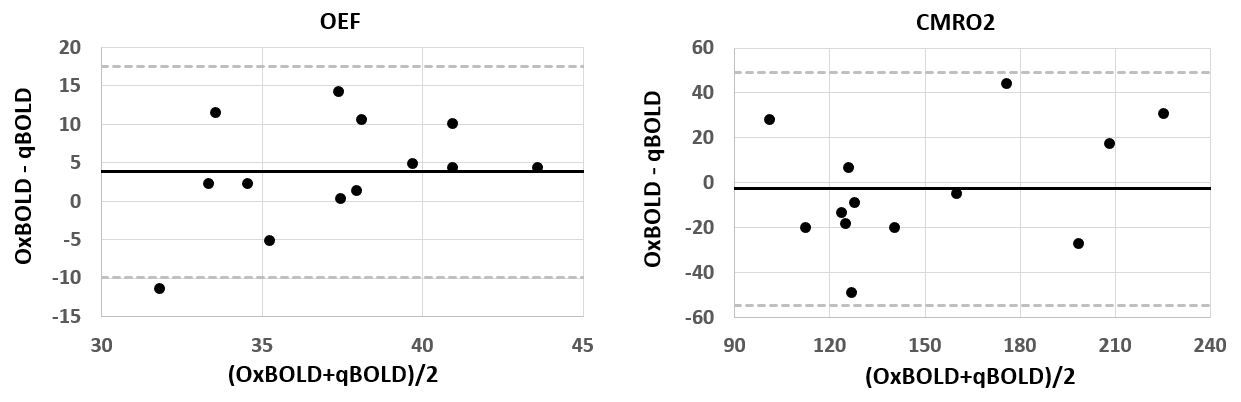
Figure 1 compares whole-brain 3D M maps in a subject, obtained using the Davis and OxBOLD models. Figure 2 shows a corresponding Bland-Altman plot for GM-averages in 13 subjects. Group-averaged M values, 8.0±2.5 (Davis) and 8.2±3.7 (OxBOLD), are not statistically different (p=0.8). Hence, we chose the OxBOLD-derived M maps for subsequent processing of OEF and CMRO2. Figure 3 displays 3D images of T1-weighted magnitude, and baseline OEF and CMRO2 maps, obtained via the dual-gas cBOLD and constrained qBOLD techniques. OEF maps in qBOLD present a largely invariable contrast across the brain as is expected from known physiology, whereas those in dual-gas cBOLD exhibit regional variations. Nevertheless, statistical comparisons for GM-averaged values via Bland-Altman plots (Figure 4) and paired t-tests suggest that both OEF (p=0.07) and CMRO2 (p=0.71) measurements are not different between the two methods.Discussion and Conclusions
We have performed cross-validation of the constrained qBOLD technique with dual-gas cBOLD. Results suggest that the two methods yield statistically insignificant differences in OEF and CMRO2 quantifications for GM regions. Considering the need for a specialized gas-breathing equipment in cBOLD, the present qBOLD method may be a cost-efficient and patient-friendly alternative for assessment of cerebral oxygen metabolism across the entire brain.Acknowledgements
NIH grant P41-EB029460 and R21-EB031364, and NRF Korea grant 2021R1F1A1045621References
1. Ogawa S, Lee T-M, Kay AR, Tank DW. Brain magnetic resonance imaging with contrast dependent on blood oxygenation. PNAS 1990;87(24):9868-72.
2. Bandettini PA. Twenty years of functional MRI: the science and the stories. NeuroImage. 2012;62(2):575-88.
3. Blockley NP, Griffeth VE, Simon AB, Buxton RB. A review of calibrated blood oxygenation level‐dependent (BOLD) methods for the measurement of task‐induced changes in brain oxygen metabolism. NMR in Biomedicine. 2013;26(8):987-1003.
4. Davis TL, Kwong KK, Weisskoff RM, Rosen BR. Calibrated functional MRI: mapping the dynamics of oxidative metabolism. Proceedings of the National Academy of Sciences. 1998;95(4):1834-9.
5. Chiarelli PA, Bulte DP, Wise R, et al. A calibration method for quantitative BOLD fMRI based on hyperoxia. Neuroimage 2007; 37: 808–820.
6. Bulte DP, Kelly M, Germuska M, et al. Quantitative measurement of cerebral physiology using respiratory-calibrated MRI. Neuroimage 2012; 60: 582–591.
7. Wise RG, Harris AD, Stone AJ, et al. Measurement of OEF and absolute CMRO2: MRI-based methods using interleaved and combined hypercapnia and hyperoxia. Neuroimage 2013; 83: 135–147.
8. An HY, Lin WL. Quantitative measurements of cerebral blood oxygen saturation using magnetic resonance imaging. J Cereb Blood Flow Metab 2000; 20:1225-1236.
9. He X, Yablonskiy DA. Quantitative BOLD: mapping of human cerebral deoxygenated blood volume and oxygen extraction fraction: default state. Magn Reson Med. 2007;57:115-126.
10. Lee H, Englund EK, Wehrli FW. Interleaved quantitative BOLD: Combining extravascular R2’- and intravascular R2-measurements for estimation of deoxygenated blood volume and hemoglobin oxygen saturation. NeuroImage. 2018;174:420-431.
11. Lee H, Wehrli FW. Whole-brain 3D mapping of oxygen metabolism using constrained quantitative BOLD. NeuroImage 2022;250:118952.
12. Englund EK, Fernández-Seara MA, Rodríguez-Soto AE, Lee H, Rodgers ZB, Vidorreta M, et al. Calibrated fMRI for dynamic mapping of CMRO2 responses using MR-based measurements of whole-brain venous oxygen saturation. Journal of Cerebral Blood Flow & Metabolism. 2020;40(7):1501-1506.
13. Lee H, Wehrli FW. Alternating unbalanced SSFP for 3D R2’ mapping of the human brain. Magn Reson Med. 2021;85:2391-2402.
14. Lee H, Wehrli FW. Venous cerebral blood volume mapping in the whole brain using venous-spin-labeled 3D turbo spin echo. Magn Reson Med. 2020;84:1991-2003.
15. Vidorreta, M., Wang, Z., Rodríguez, I., Pastor, M.A., Detre, J.A., Fernández-Seara, M.A., 2013. Comparison of 2D and 3D single-shot ASL perfusion fMRI sequences. Neuroimage 66, 662-671.
Figures