2160
Implementation of gradient nonlinearity correction for ADC measurements in head and neck cancer
Ramesh Paudyal1, Akash Deelip Shah2, Amaresha Shridhar Konar1, Victoria Yu1, Dariya I Malyarenko3, Nancy Lee4, Thomas L Chenevert3, and Amita Shukla-Dave1,2
1Medical Physics, Memorial Sloan Kettering Cancer Center, New York, NY, United States, 2Radiology, Memorial Sloan Kettering Cancer Center, New York, NY, United States, 3Radiology, University of Michigan, Ann Arbor, MI, United States, 4Radiation Oncology, Memorial Sloan Kettering Cancer Center, New York, NY, United States
1Medical Physics, Memorial Sloan Kettering Cancer Center, New York, NY, United States, 2Radiology, Memorial Sloan Kettering Cancer Center, New York, NY, United States, 3Radiology, University of Michigan, Ann Arbor, MI, United States, 4Radiation Oncology, Memorial Sloan Kettering Cancer Center, New York, NY, United States
Synopsis
Keywords: Quantitative Imaging, Tumor
The present study evaluated the correction efficacy for ADC values bias due to the gradient nonlinearity of the MRI system on primary tumors, neck nodal metastases, and masseter muscle in the head and neck region using a vendor-provided LOw VAriance (LOVA) ADC technique. The LOVA ADC technique was developed and implemented to compensate for gradient linearity errors that may allow consistent ADC values in large FOV independent of the offset from the scanner isocenter. Our results confirmed the potential of the LOVA technique to improve ADC accuracy independent of location and scanner gradient characteristics.Purpose
Diffusion-weighted (DW)-MRI-derived apparent diffusion coefficient (ADC), a surrogate of tumor cellularity, has shown promise in evaluating treatment response in metastatic nodes of head and neck cancer.1,2 Previous studies have demonstrated that the apparent diffusion coefficient (ADC) measurement is biased by spatially-dependent b-value due to gradient nonlinearity3,4, particularly for anatomy with increasing offset from the MRI scanner isocenter. It has been shown that there is an improvement in the accuracy of ADC measures by applying gradient nonlinearity (GNL) correction, for example, for breast DWI.5,6 Recently, the GNL correction method has been implemented on clinical scanners via an academic-industry partnership with the three major MRI vendors. In the present study, we aimed to use the vendor-provided LOw VAriance (LOVA) ADC technique for GNL correction to improve the accuracy of the ADC values measured for primary tumors, neck nodal metastases, and masseter muscles in patients with head and neck cancer.Methods
MRI data acquisition:Phantom: DW-MRI study was performed on the NIST/QIBA diffusion phantom at a 3T MRI scanner (Elition, Philips Healthcare, Netherlands) using a 16-channel head coil.7 DWI images of the phantom were acquired using a single shot spin echo planar imaging (SS-SE-EPI) sequence with 4 b-values (i.e., b= 0, 500, 900, 2000 s/mm2) and the following parameters: repetition time (TR)=15000 ms, echo time (TE) = minimum (99 ms), number of averages (NA)=1, acquisition matrix=128×128, the field of view (FOV) = 220 mm2, number of slices (NS)=20, slice thickness = 4 mm, all 3 orthogonal directions. The total acquisition time for the multiple b-value DWI data acquisition was ~2 minutes 30 seconds. For real-time processing, the LOVA ADC technique was selected during acquisition, which generated two DW- datasets with and without GNL correction. On both ADC maps, a 186 mm2 region of interest was placed in each vial using Image J software. 8 The three vials' ( #Oc, #10o, and #50o ) ADC values were reported herein.
Patient: DW-MRI data was acquired from fifteen HPV positive (+) oropharyngeal squamous cell carcinoma (OPSCC) patients (median age 54 years, 15 male) in this retrospective study between December 2021 and September 2022. The patients were treated with chemoradiation therapy (CRT). MRI protocol consisted of multi-planar T1/T2 weighted imaging followed by multi-b-value DWI on a 3.0T scanner (Elition, Philips Healthcare, Netherlands) using a neurovascular phased-array coil at pretreatment (Tx). The multi b-value DW images were acquired using a single shot spin echo planar imaging (SS-SE-EPI) sequence with TR/TE=4000/80(minimum) ms, FOV=20-24 cm, matrix=128×128, slices=8-10, slice thickness=5mm, number of excitation (NEX)=2, and b=0,300,800 s/mm2. Regions of Interest (ROIs): A neuro-radiologist delineated regions of Interest (ROIs) on primary tumors, neck nodal metastases where tumors lesion were seen, and masseter muscle on the DW image (b = 0 s/mm2) using ITK-SNAP. All DW data analysis was performed using in-house software MRI-QAMPER (Quantitative Analysis Multi-Parametric Evaluation Routines) written in MATLAB (MathWorks, Natick, MA). ADC values were calculated for b = 0, 300, and 800 s/mm2, and maps were generated using a mono-exponential diffusion model. The relative percentage change in mean ADC values (rΔADC (%) ) with and without GNL correction was calculated as follows: rΔADC(%) = (ADCGNL-ADC)/ADCGNL×100, where ADCGNL and ADC represent ADC values measured with and without GNL correction, respectively. Mean ADC values with and without the GNL correction were compared using a Wilcoxon signed rank test, and P <0.05 was considered significant.
Results
Phantom: Mean ADC values with GNL correction for three representative vials # 0c, # 10o, and # 50o were 1.68% (1.067±0.016 vs. 1.085±0.016 ×10⁻³ [mm2/s]),4.39% (0.820±0.007 vs. 0.856±0.007×10⁻³ [mm2/s]), and 5.11% (0.137±0.008 vs. 0.144±0.009×10⁻³ [mm2/s]) which were lower than those without GNL correction (Figure 1).Patient: The study evaluated 8 primary lesions, 15 metastatic nodes, and 8 masseter muscles from 15 OPSCC patients. In Figure 2, the boxplot compares mean ADC values with and without GNL correction for primary tumors, metastatic nodes, and master muscle from OPSCC patients. GNL-corrected means ADCs values of primary tumors, metastatic nodes, and master muscles were lower than the uncorrected ADCs, consistent with the phantom study (Table 1). Figure 3 shows the ADC parametric maps generated with and without GNL correction. Figure 4 shows the representative histogram plot for ADC values obtained with and without GNL correction from metastatic nodes. The impact of GNL correction on narrowing the ADC values can be appreciated.
Discussion
Mean ADC value with and without GNL correction differed by 5.74%, 3.98%, and 6.11% for primary, metastatic nodes, and master muscle, respectively. The results suggest that implementing GNL correction improves ADC measurement accuracy and reduces unnecessary variability due to different offsets from the isocenter. GNL correction needs to be implemented across all scanner platforms to ensure uniformity and consistency of diagnostic ADC measures, particularly if considering the incorporation of ADC as a quantitative imaging biomarker in standardized multiplatform clinical studies.Conclusion
This study showed that implementing GNL correction significantly improves the accuracy of ADC measures, enhancing the robustness of ADC thresholds as a quantitative imaging biomarker used in clinical trials.Acknowledgements
Support: Funding support from National Institutes of Health Grants: U01CA166104, U24CA237683, U01 CA211205, R01CA190299, and 75N91021C00036References
1. Paudyal R, Oh JH, Riaz N, et al. Intravoxel incoherent motion diffusion-weighted MRI during chemoradiation therapy to characterize and monitor treatment response in human papillomavirus head and neck squamous cell carcinoma. J Magn Reson Imaging. Apr 2017;45(4):1013-1023. doi:10.1002/jmri.25523 2. Riaz N, Sherman E, Pei X, et al. Precision Radiotherapy: Reduction in Radiation for Oropharyngeal Cancer in the 30 ROC Trial. JNCI: Journal of the National Cancer Institute. 2021;113(6):742-751. doi:10.1093/jnci/djaa184 3. Bammer R, Markl M, Barnett A, et al. Analysis and generalized correction of the effect of spatial gradient field distortions in diffusion‐weighted imaging. Magnetic Resonance in Medicine: An Official Journal of the International Society for Magnetic Resonance in Medicine. 2003;50(3):560-569. 4. Malyarenko DI, Ross BD, Chenevert TL. Analysis and correction of gradient nonlinearity bias in apparent diffusion coefficient measurements. Magnetic resonance in medicine. 2014;71(3):1312-1323. 5. Malyarenko DI, Newitt DC, Amouzandeh G, et al. Retrospective correction of ADC for gradient nonlinearity errors in multicenter breast DWI trials: ACRIN6698 multiplatform feasibility study. Tomography. 2020;6(2):86-92. 6. Newitt DC, Tan ET, Wilmes LJ, et al. Gradient nonlinearity correction to improve apparent diffusion coefficient accuracy and standardization in the american college of radiology imaging network 6698 breast cancer trial. J Magn Reson Imaging. Oct 2015;42(4):908-19. doi:10.1002/jmri.24883 7. Paudyal R, Konar AS, Obuchowski NA, et al. Repeatability of Quantitative Diffusion-Weighted Imaging Metrics in Phantoms, Head-and-Neck and Thyroid Cancers: Preliminary Findings. Tomography. Mar 2019;5(1):15-25. doi:10.18383/j.tom.2018.00044 8. Amouzandeh G, Chenevert TL, Swanson SD, Ross BD, Malyarenko DI. Temperature and concentration dependence of water diffusion in polyvinylpyrrolidone solutions. Medical Physics. 2022;49(5):3325-3332.Figures
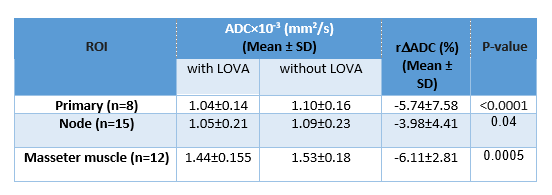
Table 1. Summary of ADC values
with and without GNL correction for primary tumors, metastatic nodes, and
masseter muscle.
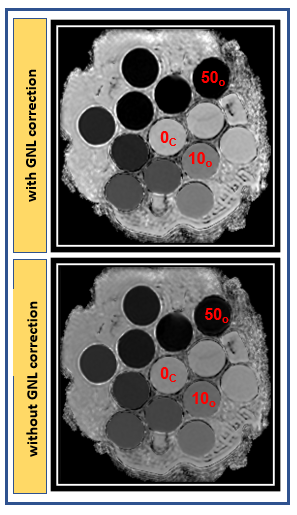
Figure 1. Representative ADC map generated
with and without GNL correction on the scanner. The ADC values of the vials # 0c,
#10o, and #50o are reported. (c=center, o= outer, and
i=inner vial)
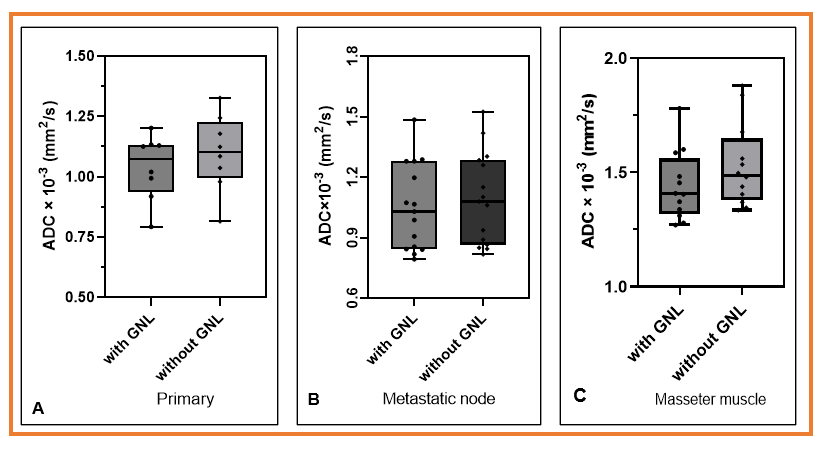
Figure 2 Bar plots display the mean ADC
values obtained with and without GNL correction for primary, metastatic lymph
nodes, and masseter muscle. The GNL corrected mean ADC values are lower from
those of uncorrected ADC values.
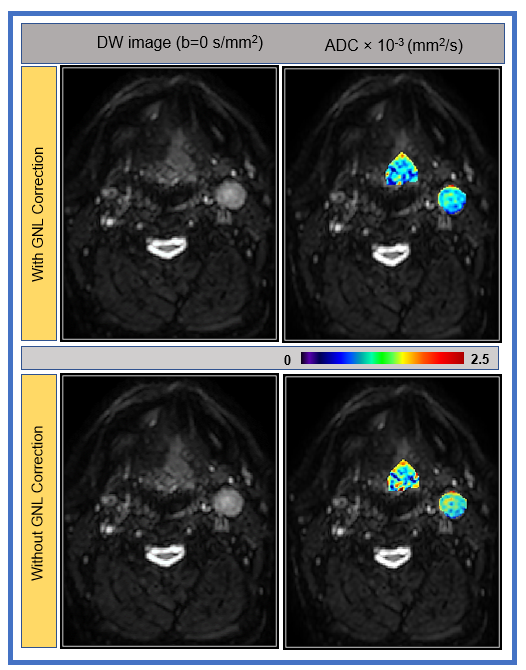
Figure
3. Representative DWI images (b=0 s/mm2) and ADC maps of primary tumors
and mestastic nodes with and without GNL correction from HPV+ OPSCC patient (50-year,
male). The ADC maps exhibiting lower ADC values after GNL correction both in
primary and metastatic lymph nodes.
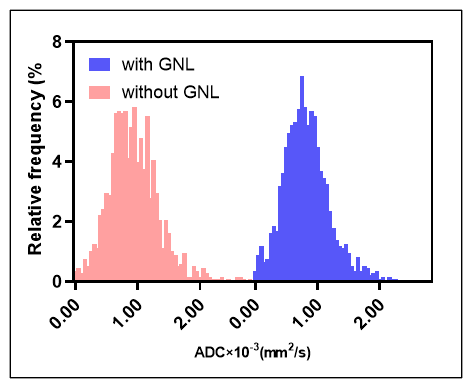
Figure 4. Representative histogram plot
for ADC values with and without GNL correction from metastatic node. The GNL
correction restores the uniformity of ADC values substantially narrowing the
ADC histogram.
DOI: https://doi.org/10.58530/2023/2160