2158
Free-water Investigation In Parkinsonian Disorders Using Diffusion-weighted Imaging1Symbiosis Centre for Medical Image Analysis, Symbiosis International (Deemed University), Pune, India, 2Department of Radiology, National Institutes of Mental Health and Neuroscience, Bengaluru, India, 3Department of Neurology, National Institutes of Mental Health and Neuroscience, Bengaluru, India
Synopsis
Keywords: Neuroinflammation, Parkinson's Disease, Parkinsonism, Free water
Parkinson's disease(PD), multiple system atrophy(MSA), and progressive supranuclear palsy(PSP) are neurodegenerative disorders with parkinsonism as a central feature. Although MSA and PSP are atypical parkinsonian disorders, they may be difficult to differentiate from PD particularly in the early stages. Multiple studies have demonstrated that patients with Parkinsonian disorders have higher freewater(FW) in the substantia-nigra-pars-compacta(SNc) and basal ganglia(BG), and FW was shown to reliably distinguish between these patients, making it a potential biomarker. Our investigation into the alterations of FW in PD and atypical parkinsonian disorders, we attempt to evaluate the alterations of freewater in the SNc and basal ganglia structures.Introduction
Parkinson's disease (PD), multiple system atrophy (MSA), and progressive supranuclear palsy (PSP) are neurodegenerative disorders with parkinsonism as a central feature. Although MSA and PSP are atypical parkinsonian disorders, they may be difficult to differentiate from PD particularly in the early stages. Multiple studies have demonstrated that patients with Parkinsonian disorders have higher levels of free water (FW) in the substantia nigra pars compacta (SNc) and basal ganglia (BG), and FW was shown reliably distinguish between these patients, making it a potential biomarker1,2. In the present study, we attempt to evaluate FW of the whole WM and deep gray matter structures to evaluate the possibility of variations in FW between PD, MSA and PSP.Method
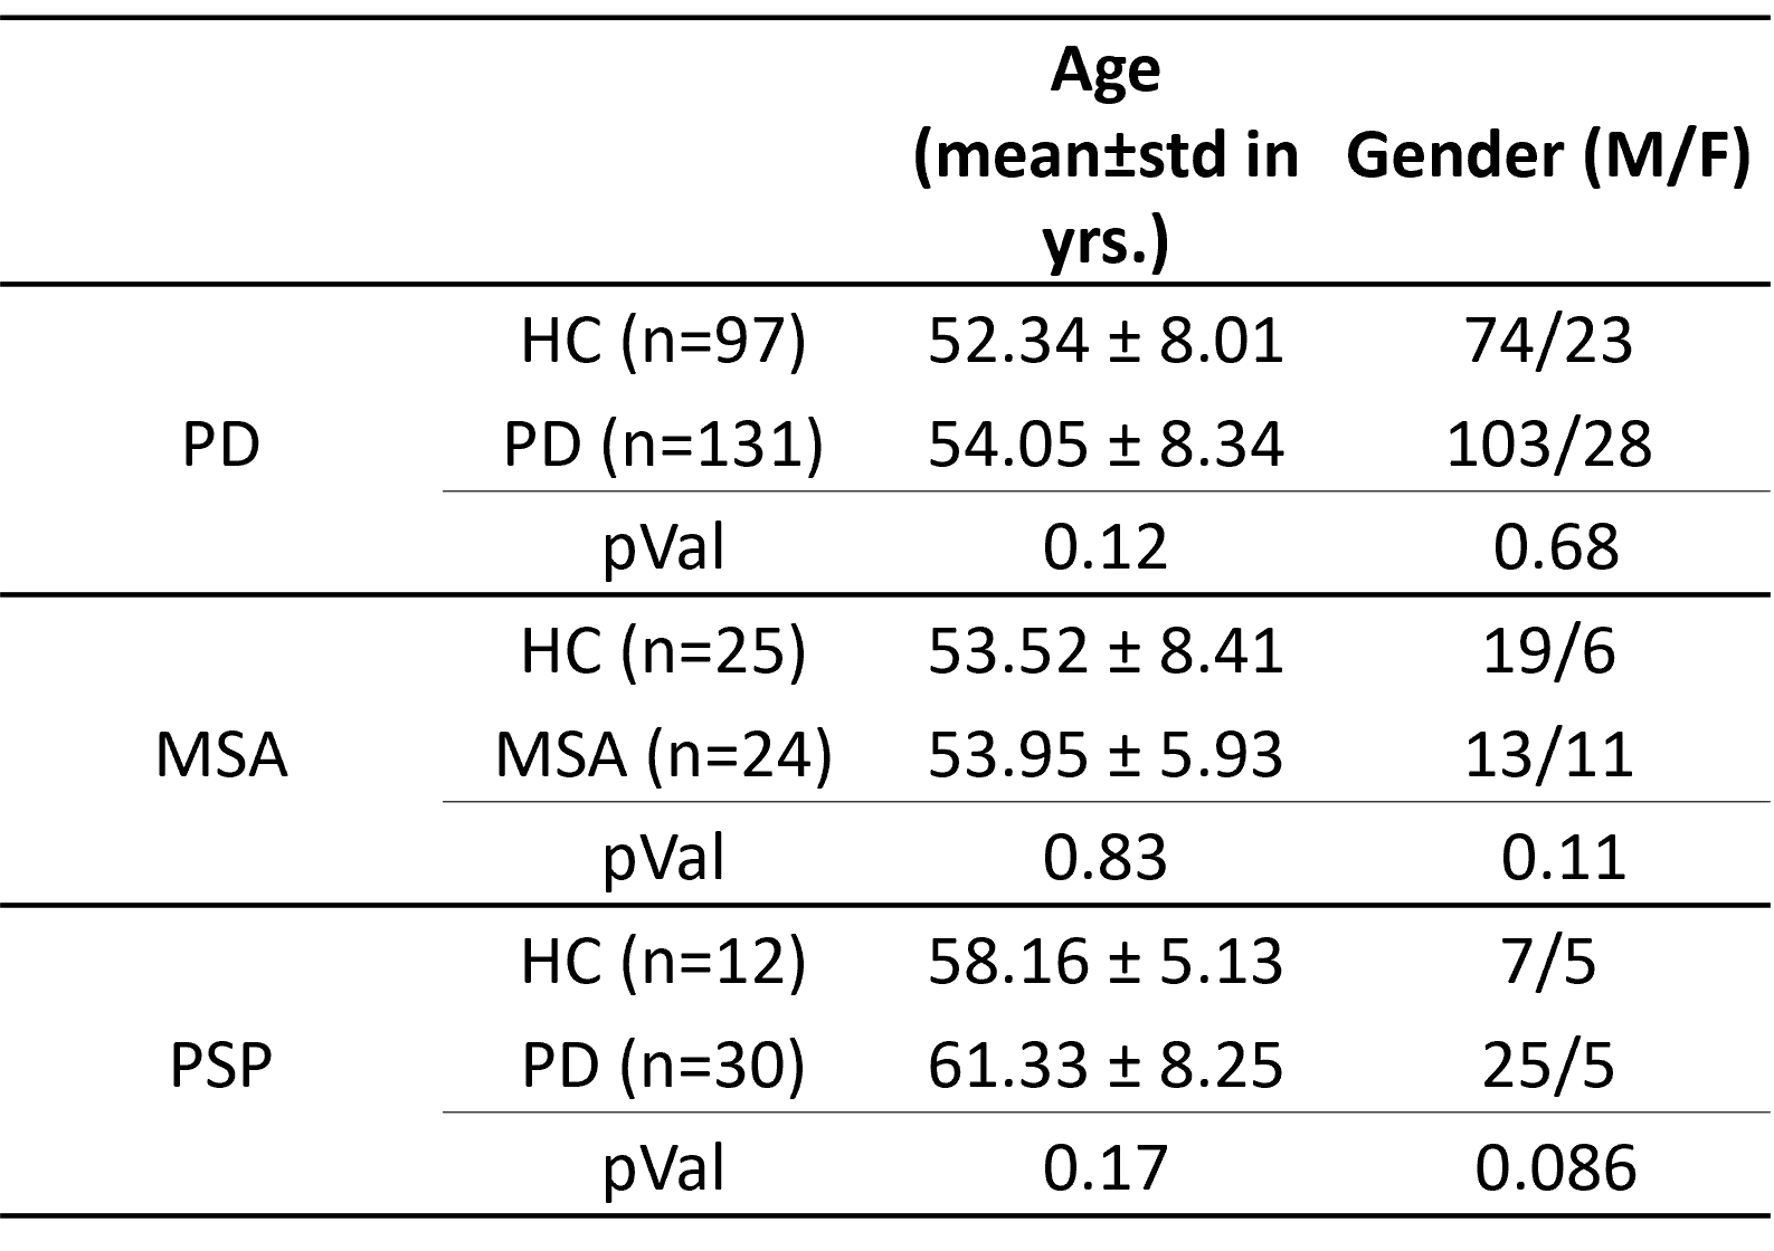
In this study, we included three datasets on Parkinson's disease as well as healthy controls that were matched for age and gender, as shown in Table 1. The diffusion magnetic resonance imaging (dMRI) with a repetition time (TR) of 8783 ms, an echo time (TE) of 62 ms, a field of view (FOV) of 224 x 224 mm, a slice thickness of 2 mm, and a voxel size of 1.75 x 1.75 x 2 mm (without any intersection gap) with 15 diffusion-sensitive gradient directions with a b-value of 1000 sec/mm2, and the images without diffusion weighting were acquired corresponding to b = 0 sec/mm2, was carried out on every individual using the 3T Philips Achieva scanner.3,4,5 After the dMRI images had been preprocessed with the FSL pipeline6,7, which includes the eddy and motion noise correction and is followed by the brain extraction, the FW estimate was performed with a minimization technique that fits a bi-tensor model8 to quantify the fractional volume of FW in the extracellular compartment for each voxel using Dipy9. After that, voxel-wise analysis using tract-based spatial statistics (TBSS)10 was employed on the FW maps to examine the changes in the WM. For grey matter (GM), the mean value of fractional free water (FW) that was extracted from BG regions and SN pars compacta (SNc) atlas defined on neuromelanin MRI11 were analyzed using a multivariate analysis of covariance test with age and gender as covariates, followed by the FDR correction for multiple comparisons.Results
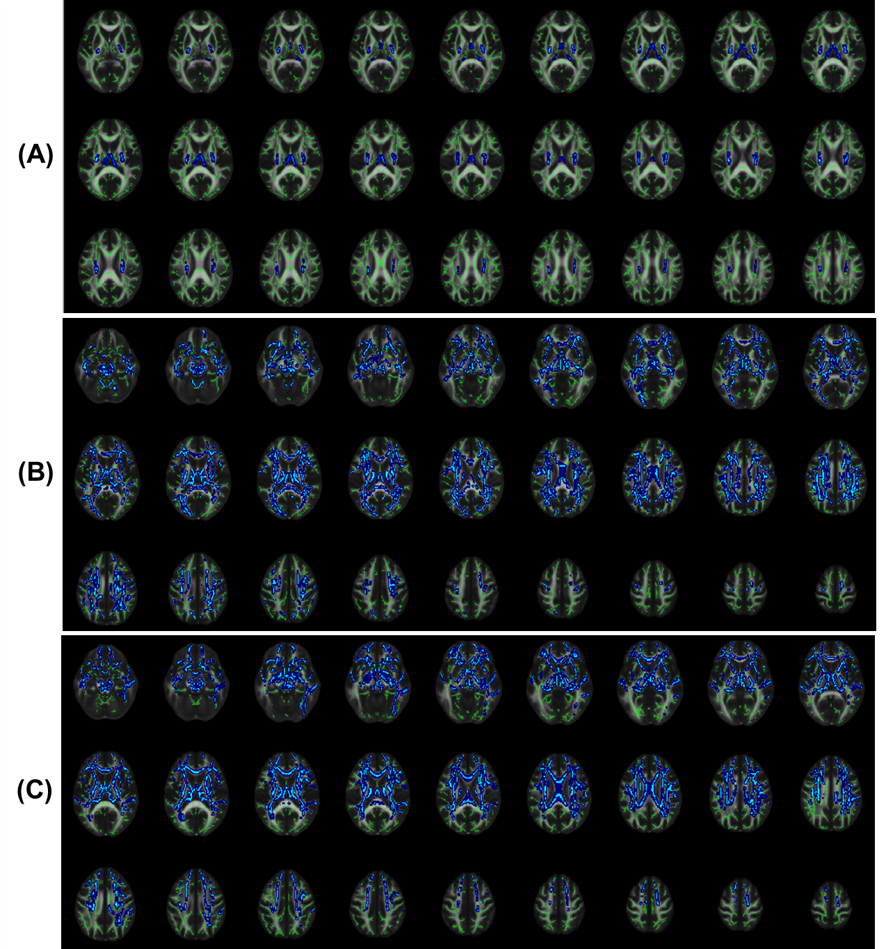
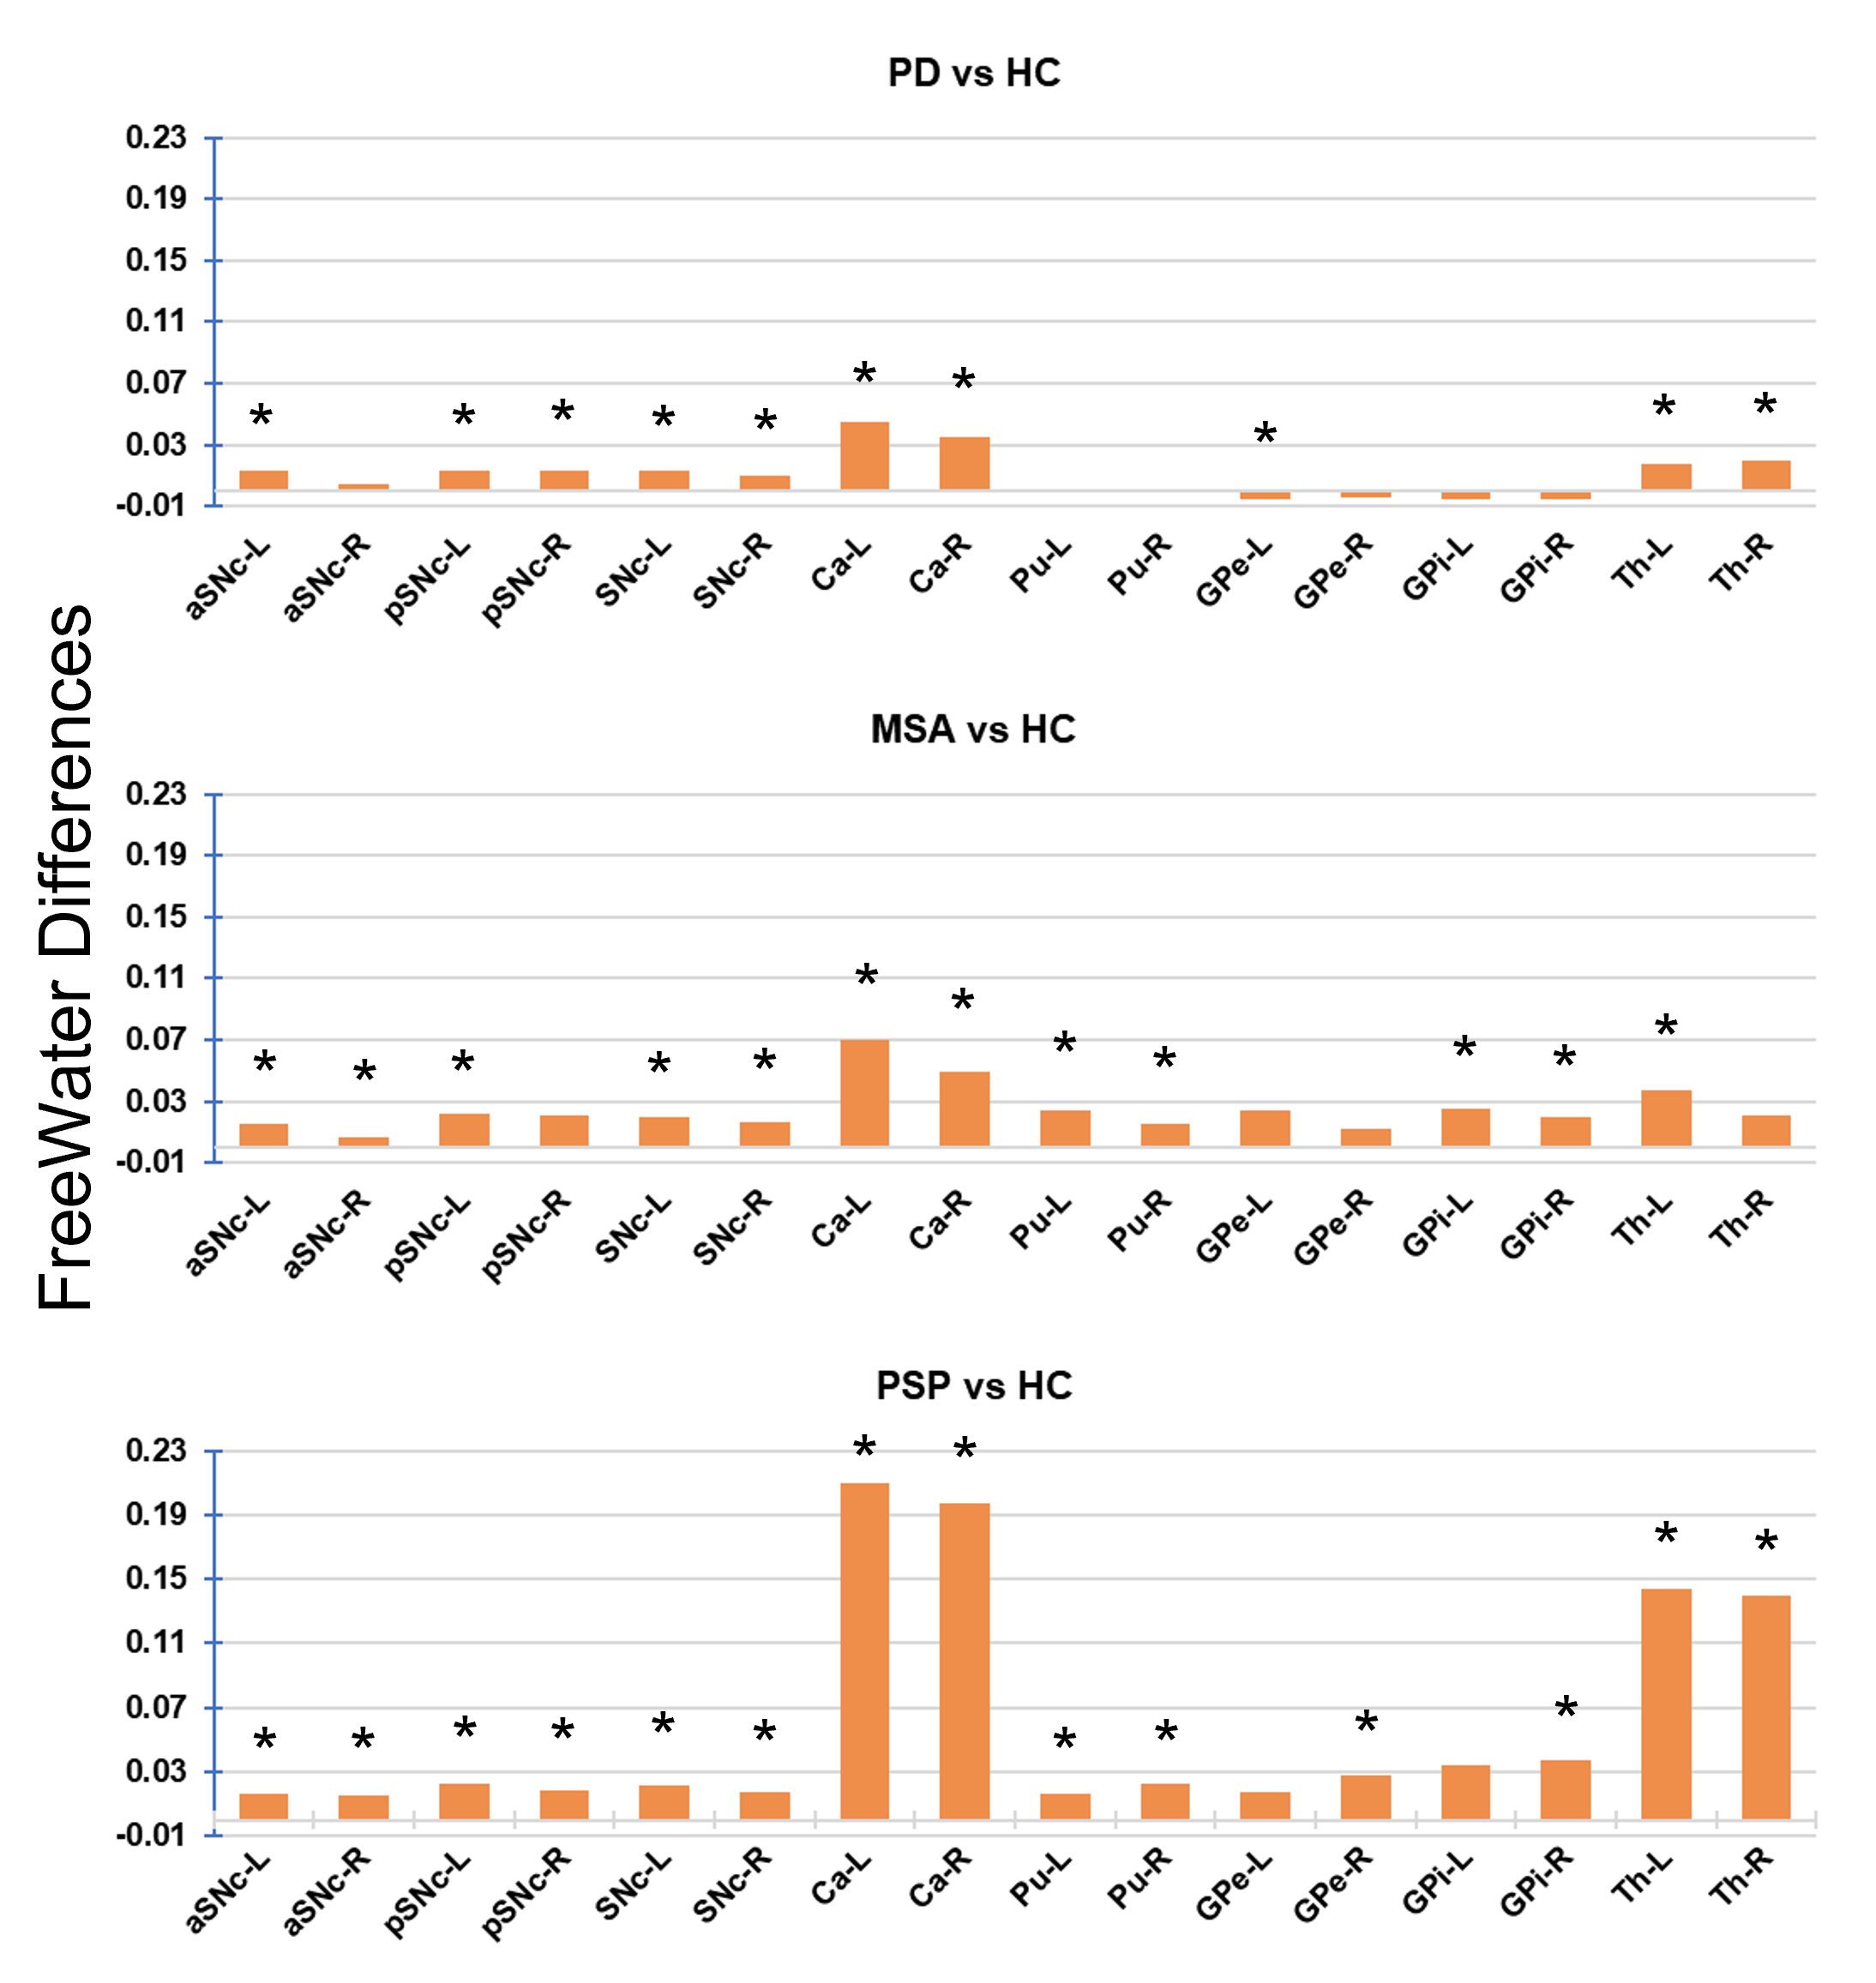
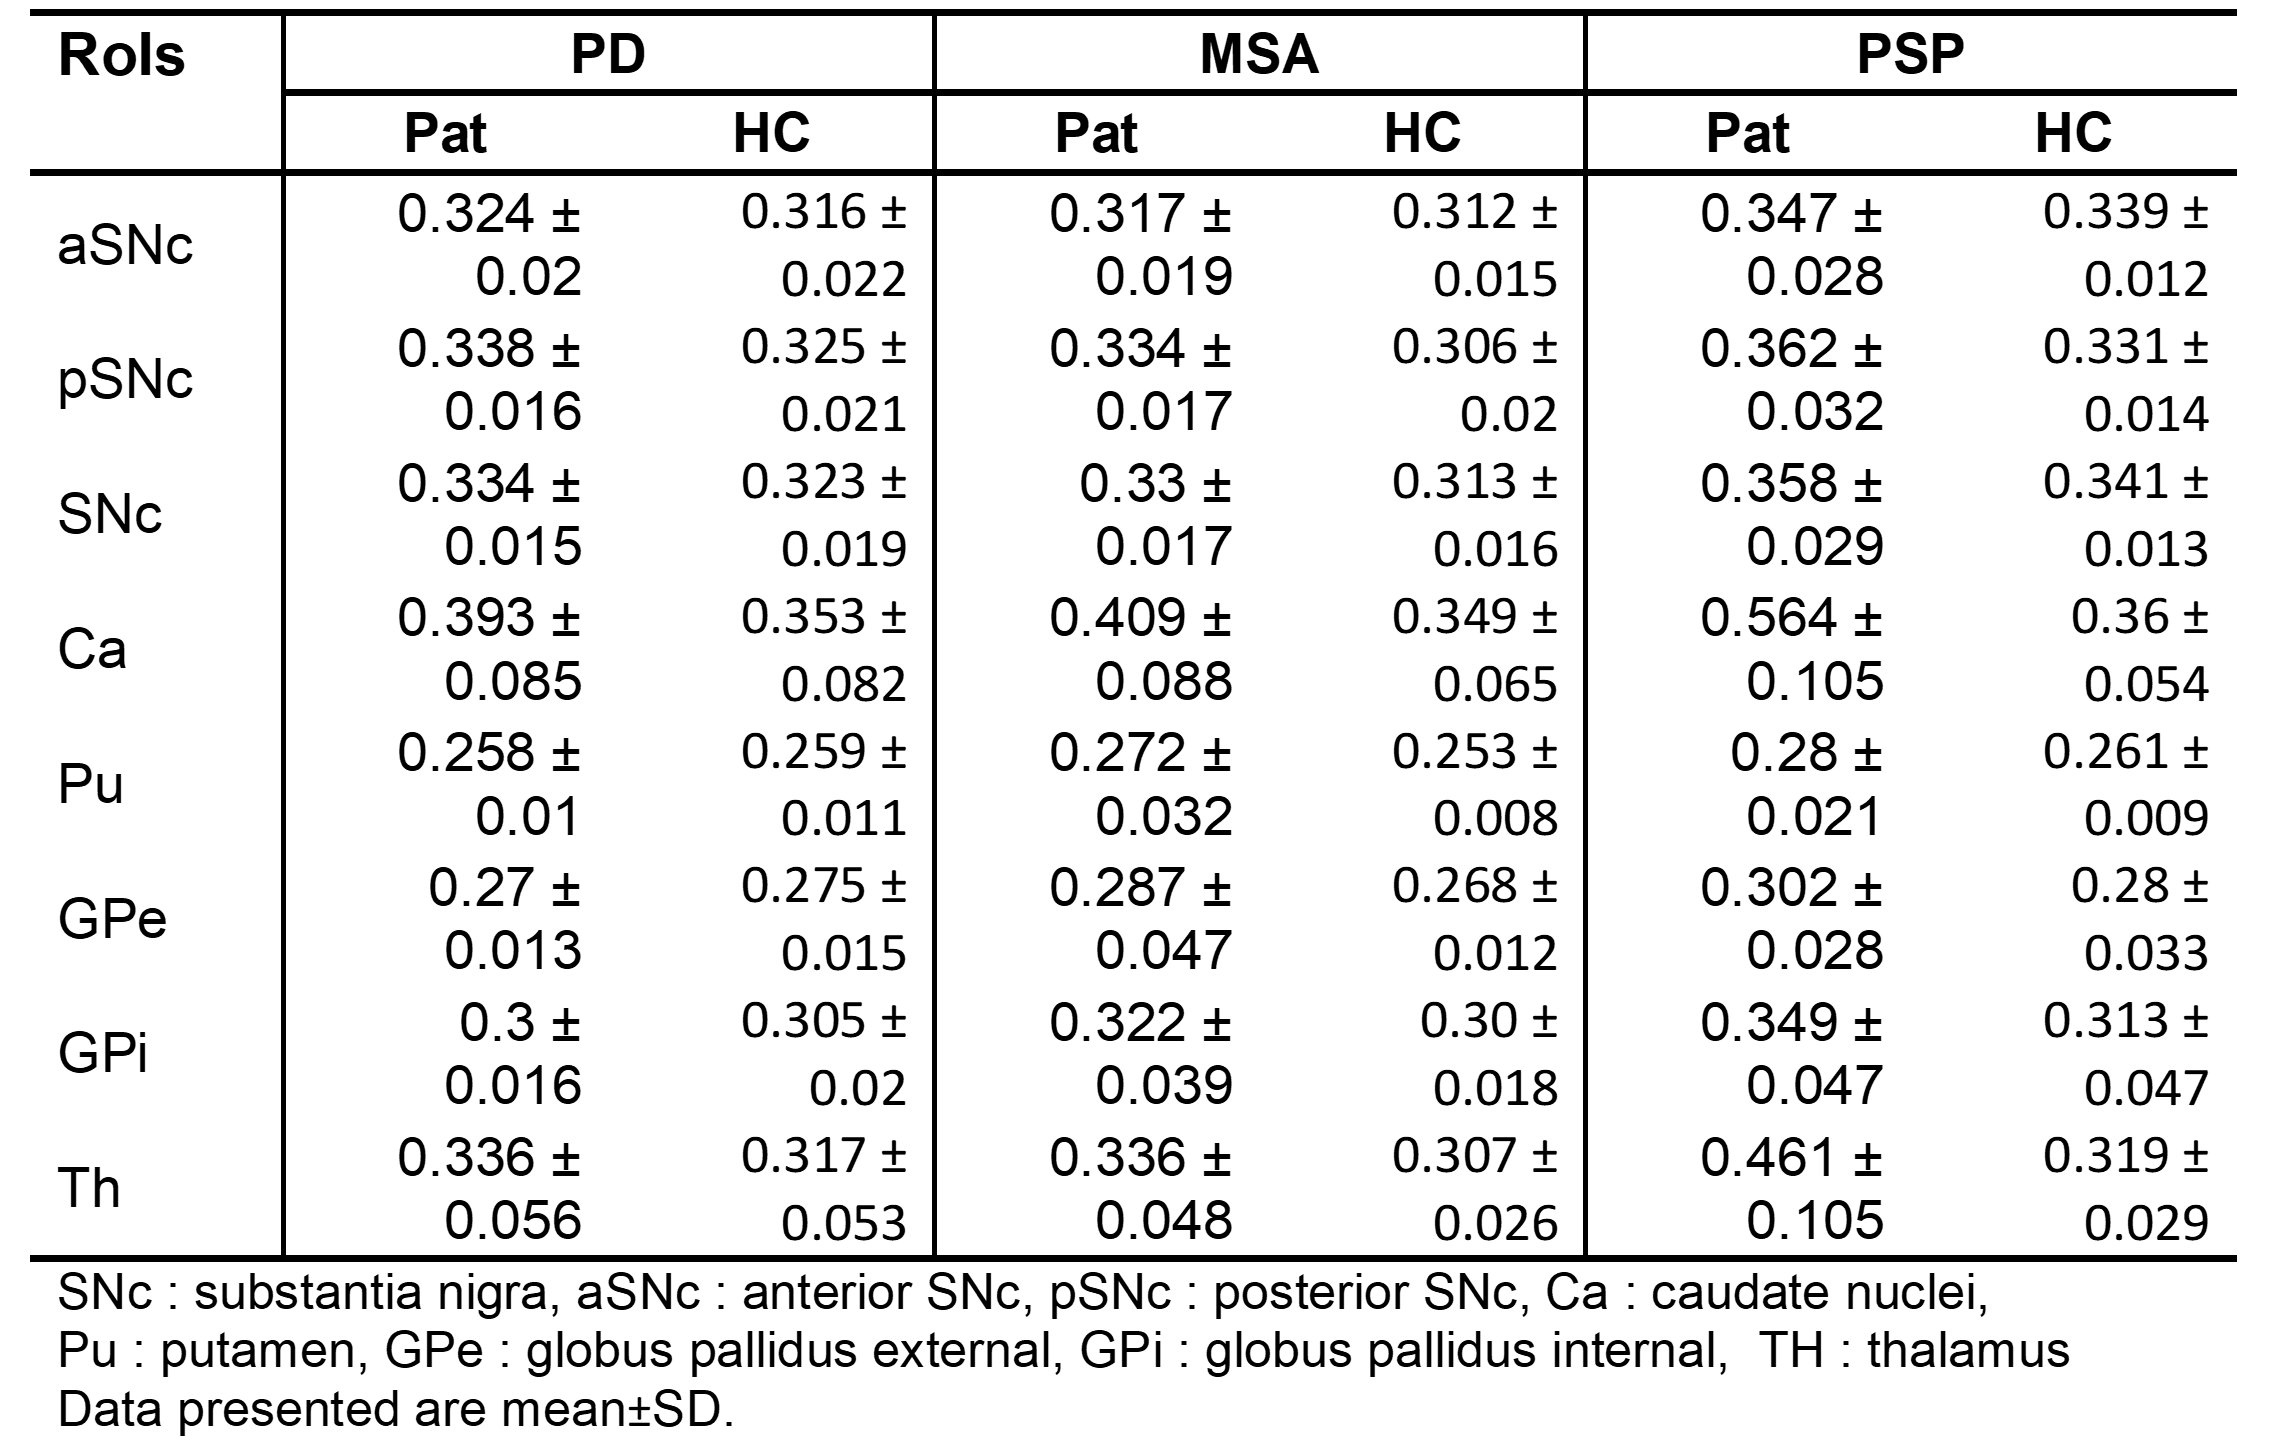
In the TBSS analysis, FW was significantly increased in the bilateral corticospinal tract (CST), the left superior longitudinal fasciculus, and the left hemisphere forceps major tract in patients with Parkinson's disease (see figure 1). Figure 1 demonstrates in MSA and PSP, FW was significantly higher in bilateral CST, anterior thalamic radiation, inferior fronto-occipital fasciculus, uncinate fasciculus, and forceps minor pathways than HC. The region impacted by the significant increase in FW observed in the MSA and PSP was much larger than the PD. All three scenarios yielded comparable results, indicating that there was an increase in FW in SNc, as shown in figure 2. FW also demonstrated a significant increase in the bilateral caudate nucleus (CA) in patients with PD; the left-hemispheric thalamus (Th) and the CA in patients with MSA; and the bilateral CA, Th, and right-hemispheric global pallidum and putamen in patients with PSP. All of these changes were found in patients shown in figure 2 and mean values were mentioned in Table 2.Conclusion
Idiopathic Parkinson's disease (PD) and atypical parkinsonian disorders display distinctive patterns and degrees of FW expansion in their respective GM structures such as the caudate, pallidum, and WM. The FW level in the SNc is raised in all three diseases. It is feasible to consider FW as a candidate for defining these disorders.Acknowledgements
We would also like to acknowledge DSTSERB for funding this project (ECR/2016/000808), and (EMR/2017/ 004523)References
1. Planetta, P.J., Ofori, E., Pasternak, O., Burciu, R.G., Shukla, P., DeSimone, J.C., Okun, M.S., McFarland, N.R. and Vaillancourt, D.E., 2016. Free-water imaging in Parkinson’s disease and atypical parkinsonism. Brain, 139(2), pp.495-508
2. Andica, C., Kamagata, K., Hatano, T., Saito, A., Uchida, W., Ogawa, T., Takeshige-Amano, H., Zalesky, A., Wada, A., Suzuki, M. and Hagiwara, A., 2019. Free-water imaging in white and gray matter in Parkinson’s disease. Cells, 8(8), p.839.
3. Shah, A., Lenka, A., Saini, J., Wagle, S., Naduthota, R.M., Yadav, R., Pal, P.K. and Ingalhalikar, M., 2017. Altered brain wiring in Parkinson's disease: a structural connectome-based analysis. Brain connectivity, 7(6), pp.347-356
4. Shah, A., Prasad, S., Rastogi, B., Dash, S., Saini, J., Pal, P.K. and Ingalhalikar, M., 2019. Altered structural connectivity of the motor subnetwork in multiple system atrophy with cerebellar features. European Radiology, 29(6), pp.2783-2791.
5. Prasad, S., Rajan, A., Pasha, S.A., Mangalore, S., Saini, J., Ingalhalikar, M. and Pal, P.K., 2021. Abnormal structural connectivity in progressive supranuclear palsy—Richardson syndrome. Acta Neurologica Scandinavica, 143(4), pp.430-440.
6. Smith, S.M., Jenkinson, M., Woolrich, M.W., Beckmann, C.F., Behrens, T.E., Johansen-Berg, H., Bannister, P.R., De Luca, M., Drobnjak, I., Flitney, D.E. and Niazy, R.K., 2004. Advances in functional and structural MR image analysis and implementation as FSL. Neuroimage, 23, pp.S208-S219.
7. Andersson, J.L. and Sotiropoulos, S.N., 2016. An integrated approach to correction for off-resonance effects and subject movement in diffusion MR imaging. Neuroimage, 125, pp.1063-1078.
8. Pasternak, O. , Sochen, N. , Gur, Y. , Intrator, N. and Assaf, Y. (2009), Free water elimination and mapping from diffusion MRI. Magn. Reson. Med. 62: 717-730.
9. Henriques,R.N., Rokem, A., Garyfallidis, E., St-Jean, S., Peterson, E.T. and Correia, M.M., 2017. [Re] Optimization of a free water elimination two-compartment model for diffusion tensor imaging. bioRxiv, p.108795.
10. S.M. Smith, M. Jenkinson, H. Johansen-Berg, D. Rueckert, T.E. Nichols, C.E. Mackay, K.E. Watkins, O. Ciccarelli, M.Z. Cader, P.M. Matthews, and T.E.J. Behrens. Tract-based spatial statistics: Voxelwise analysis of multi-subject diffusion data. NeuroImage, 31:1487-1505, 2006
11. Safai, A., Prasad, S., Chougule, T., Saini, J., Pal, P.K. and Ingalhalikar, M., 2020. Microstructural abnormalities of substantia nigra in Parkinson's disease: a neuromelanin sensitive MRI atlas based study. Human brain mapping, 41(5), pp.1323-1333.
Figures