2157
Normative brain atlas of T2/T1 relaxometry ratio for detection of microstructural pathology1Advanced Clinical Imaging Technology, Siemens Healthineers International AG, Lausanne, Switzerland, 2Department of Radiology, Lausanne University Hospital and University of Lausanne, Lausanne, Switzerland, 3LTS5, Ecole Polytechnique Fédérale de Lausanne, Lausanne, Switzerland, 4Department of Radiology, First Faculty of Medicine, Charles University and General University Hospital, Prague, Czech Republic, 5Department of Neurology and Center of Clinical Neuroscience, First Faculty of Medicine, Charles University and General University, Prague, Czech Republic, 6Human Neuroscience Platform, Fondation Campus Biotech Geneva, Geneva, Switzerland, 7CIBM-AIT, Ecole Polytechnique Fédérale de Lausanne, Lausanne, Switzerland
Synopsis
Keywords: Quantitative Imaging, Tissue Characterization, Neuroinflammation; Neurodegeneration
Quantitative MRI allows the characterization and comparison of microstructural tissue properties and, by defining normative ranges for healthy tissue, detection of pathology. The simultaneous evaluation of multiple qMRI measures facilitates the understanding of what biological mechanisms underlie the observed deviations in relaxometry. Here, we introduce the ratio between quantitative T2 and T1 maps (T2/T1) as a microstructural property whose deviations from normative values could be predictive or characteristic of brain pathologies. A T2/T1 voxel-wise normative atlas was created and allowed characterization of tissue changes in two multiple sclerosis patients, providing complementary information to the existing T1 and T2 atlases.Introduction
Quantitative MRI measures were proven to be sensitive to microstructural tissue alteration characterizing the pathophysiology of neuroinflammatory and neurodegenerative diseases1,2. Recently, the establishment of normative atlases based on a healthy population allowed to identify voxel-wise microstructural alterations in individual patients3,4.However, different microstructural processes can have the same effect on relaxometry measures (e.g., T1 increases with demyelination and axonal loss5), hence limiting the unambiguous identification of the underlying biological mechanisms. Furthermore, multiple biological processes can occur simultaneously, sometimes neutralizing their measurable impact on relaxometry measures (e.g., demyelination and iron deposition versus T2 change). In this context, the simultaneous evaluation of several quantitative MRI measures can help to disentangle the sources of tissue alterations. However, methods to efficiently combine such measures have been poorly investigated in clinically relevant frameworks.
In this study, we build a voxel-wise normative atlas of the ratio between T2 and T1 maps (T2/T1) to provide an interpretable quantification of the relative severity of alterations reflected by T1 and T2. We present the normal evolution of T2/T1 with age and extract deviations from the atlas as voxel-wise z-scores from data of two example multiple sclerosis (MS) patients as first evidence of the sensitivity of T2/T1 z-scores to pathology and their complementarity to T1 and T2 maps.
Methods
MR dataset and pre-processingSixty-eight healthy volunteers (45$$$\,$$$females,$$$\,$$$42.6±10.4$$$\,$$$y/o) and two patients with multiple sclerosis (females,$$$\,$$$35$$$\,$$$and$$$\,$$$40 y/o), were scanned at 3T (MAGNETOM Skyra, Siemens Healthcare, Erlangen, Germany) with MP2RAGE6 (resolution$$$\,$$$=$$$\,$$$1$$$\times$$$1$$$\times$$$1$$$\,$$$mm3,$$$\,$$$FOV$$$\,$$$=$$$\,$$$240$$$\times$$$256$$$\times$$$224$$$\,$$$mm3,$$$\,$$$TI1/TI2$$$\,$$$=700$$$\,$$$ms$$$\,$$$/$$$\,$$$2500$$$\,$$$ms,$$$\,$$$TR$$$\,$$$=$$$\,$$$5$$$\,$$$s,$$$\,$$$undersampling:$$$\,$$$CSx4, TA$$$\,$$$=$$$\,$$$4:35$$$\,$$$min) and GRAPPATINI7 (resolution$$$\,$$$=$$$\,$$$0.7$$$\times$$$0.7$$$\times$$$3$$$\,$$$mm3,$$$\,$$$FOV$$$\,$$$=$$$\,$$$210$$$\times$$$224$$$\times$$$132$$$\,$$$mm3,$$$\,$$$TE$$$\,$$$=$$$\,$$$80$$$\,$$$ms,$$$\,$$$#echoes$$$\,$$$=$$$\,$$$16,$$$\,$$$TR$$$\,$$$=$$$\,$$$4$$$\,$$$s,$$$\,$$$TA$$$\,$$$=$$$\,$$$7:49$$$\,$$$min) research application sequences for T1 and T2 mapping, respectively.
T2 maps were co-registered to the MP2RAGE space8 and both maps were skull-stripped using the MorphoBox9,10 research application, a brain segmentation algorithm. Individual T2/T1 maps were computed by dividing each subject’s T2 map by their T1 map.
Computation of normative atlases
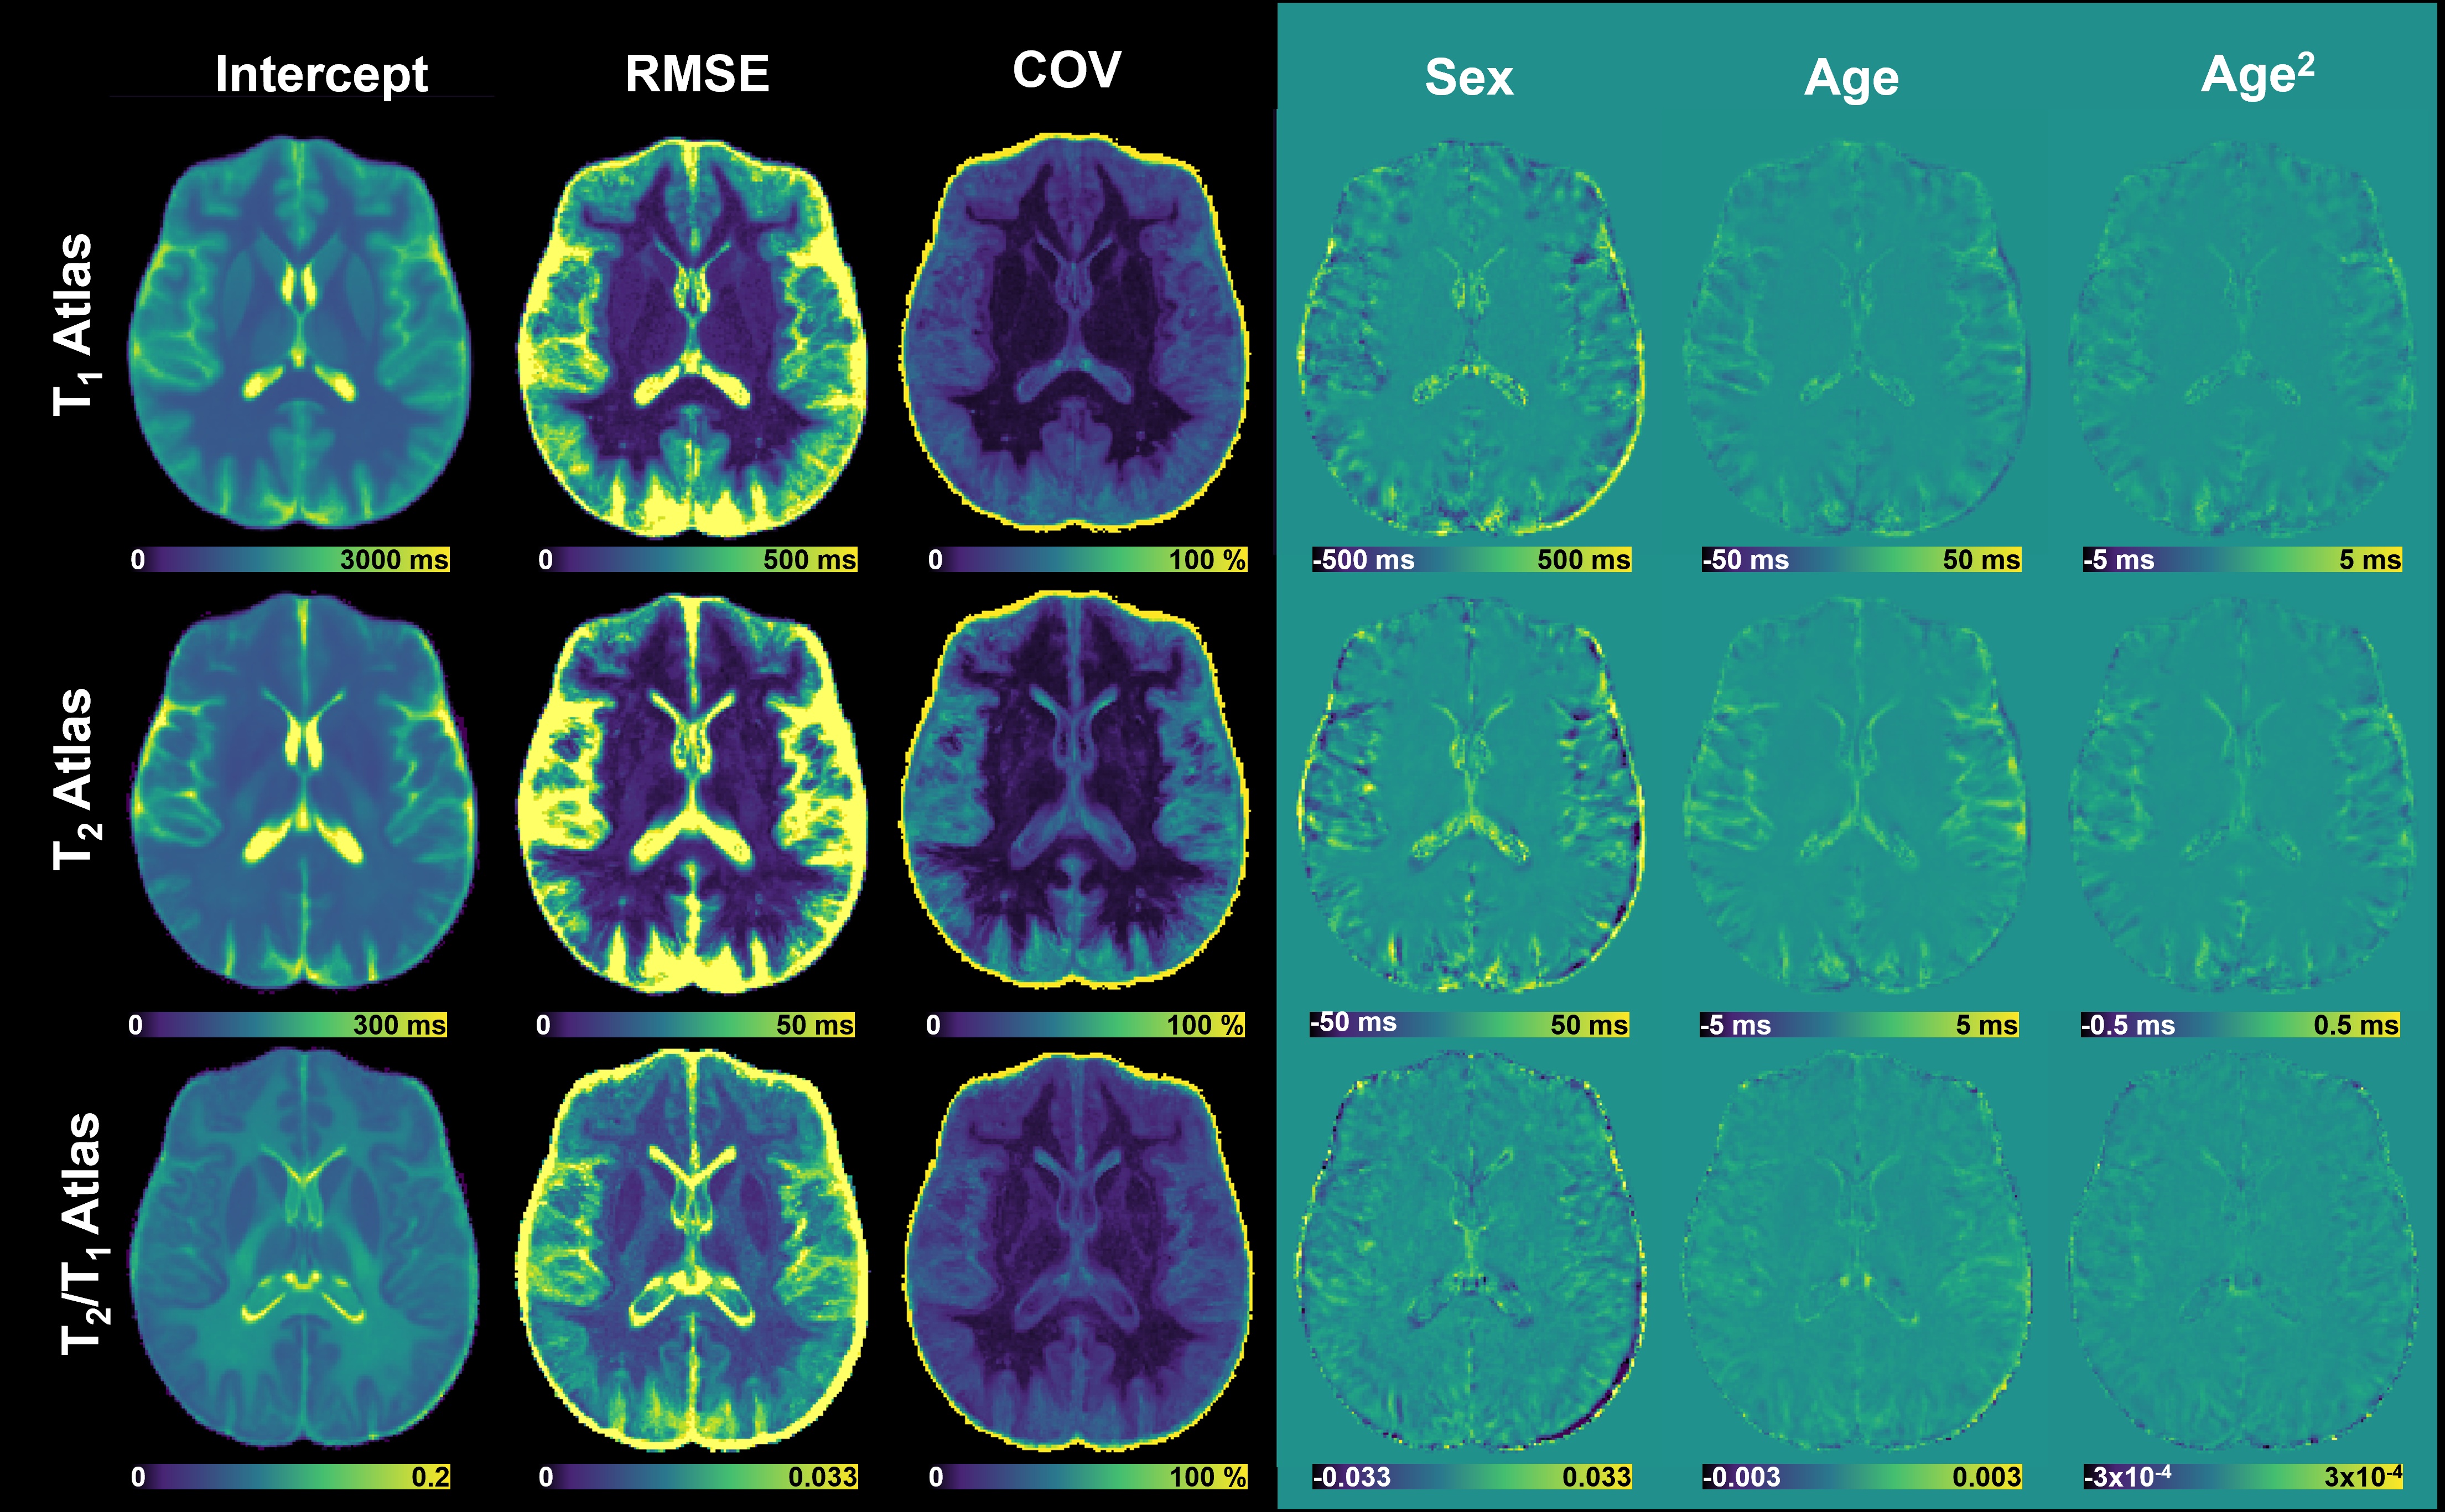
Normative T1, T2 and T2/T1 atlases were computed following the method described by Piredda et al3. Voxel-wise regression models including sex, age and squared age were computed:$$E\{X\}= β_0^X+β_{sex}^X*sex+β_{age}^X*age+β_{age^2}^X*age^2+ε\,\textrm{,}$$with X being T1, T2 or T2/T1 values, sex being binary (1 for male), and the age being centered at the mean age of our healthy cohort. Z-score maps showing deviations from normative values were obtained for individual patients.
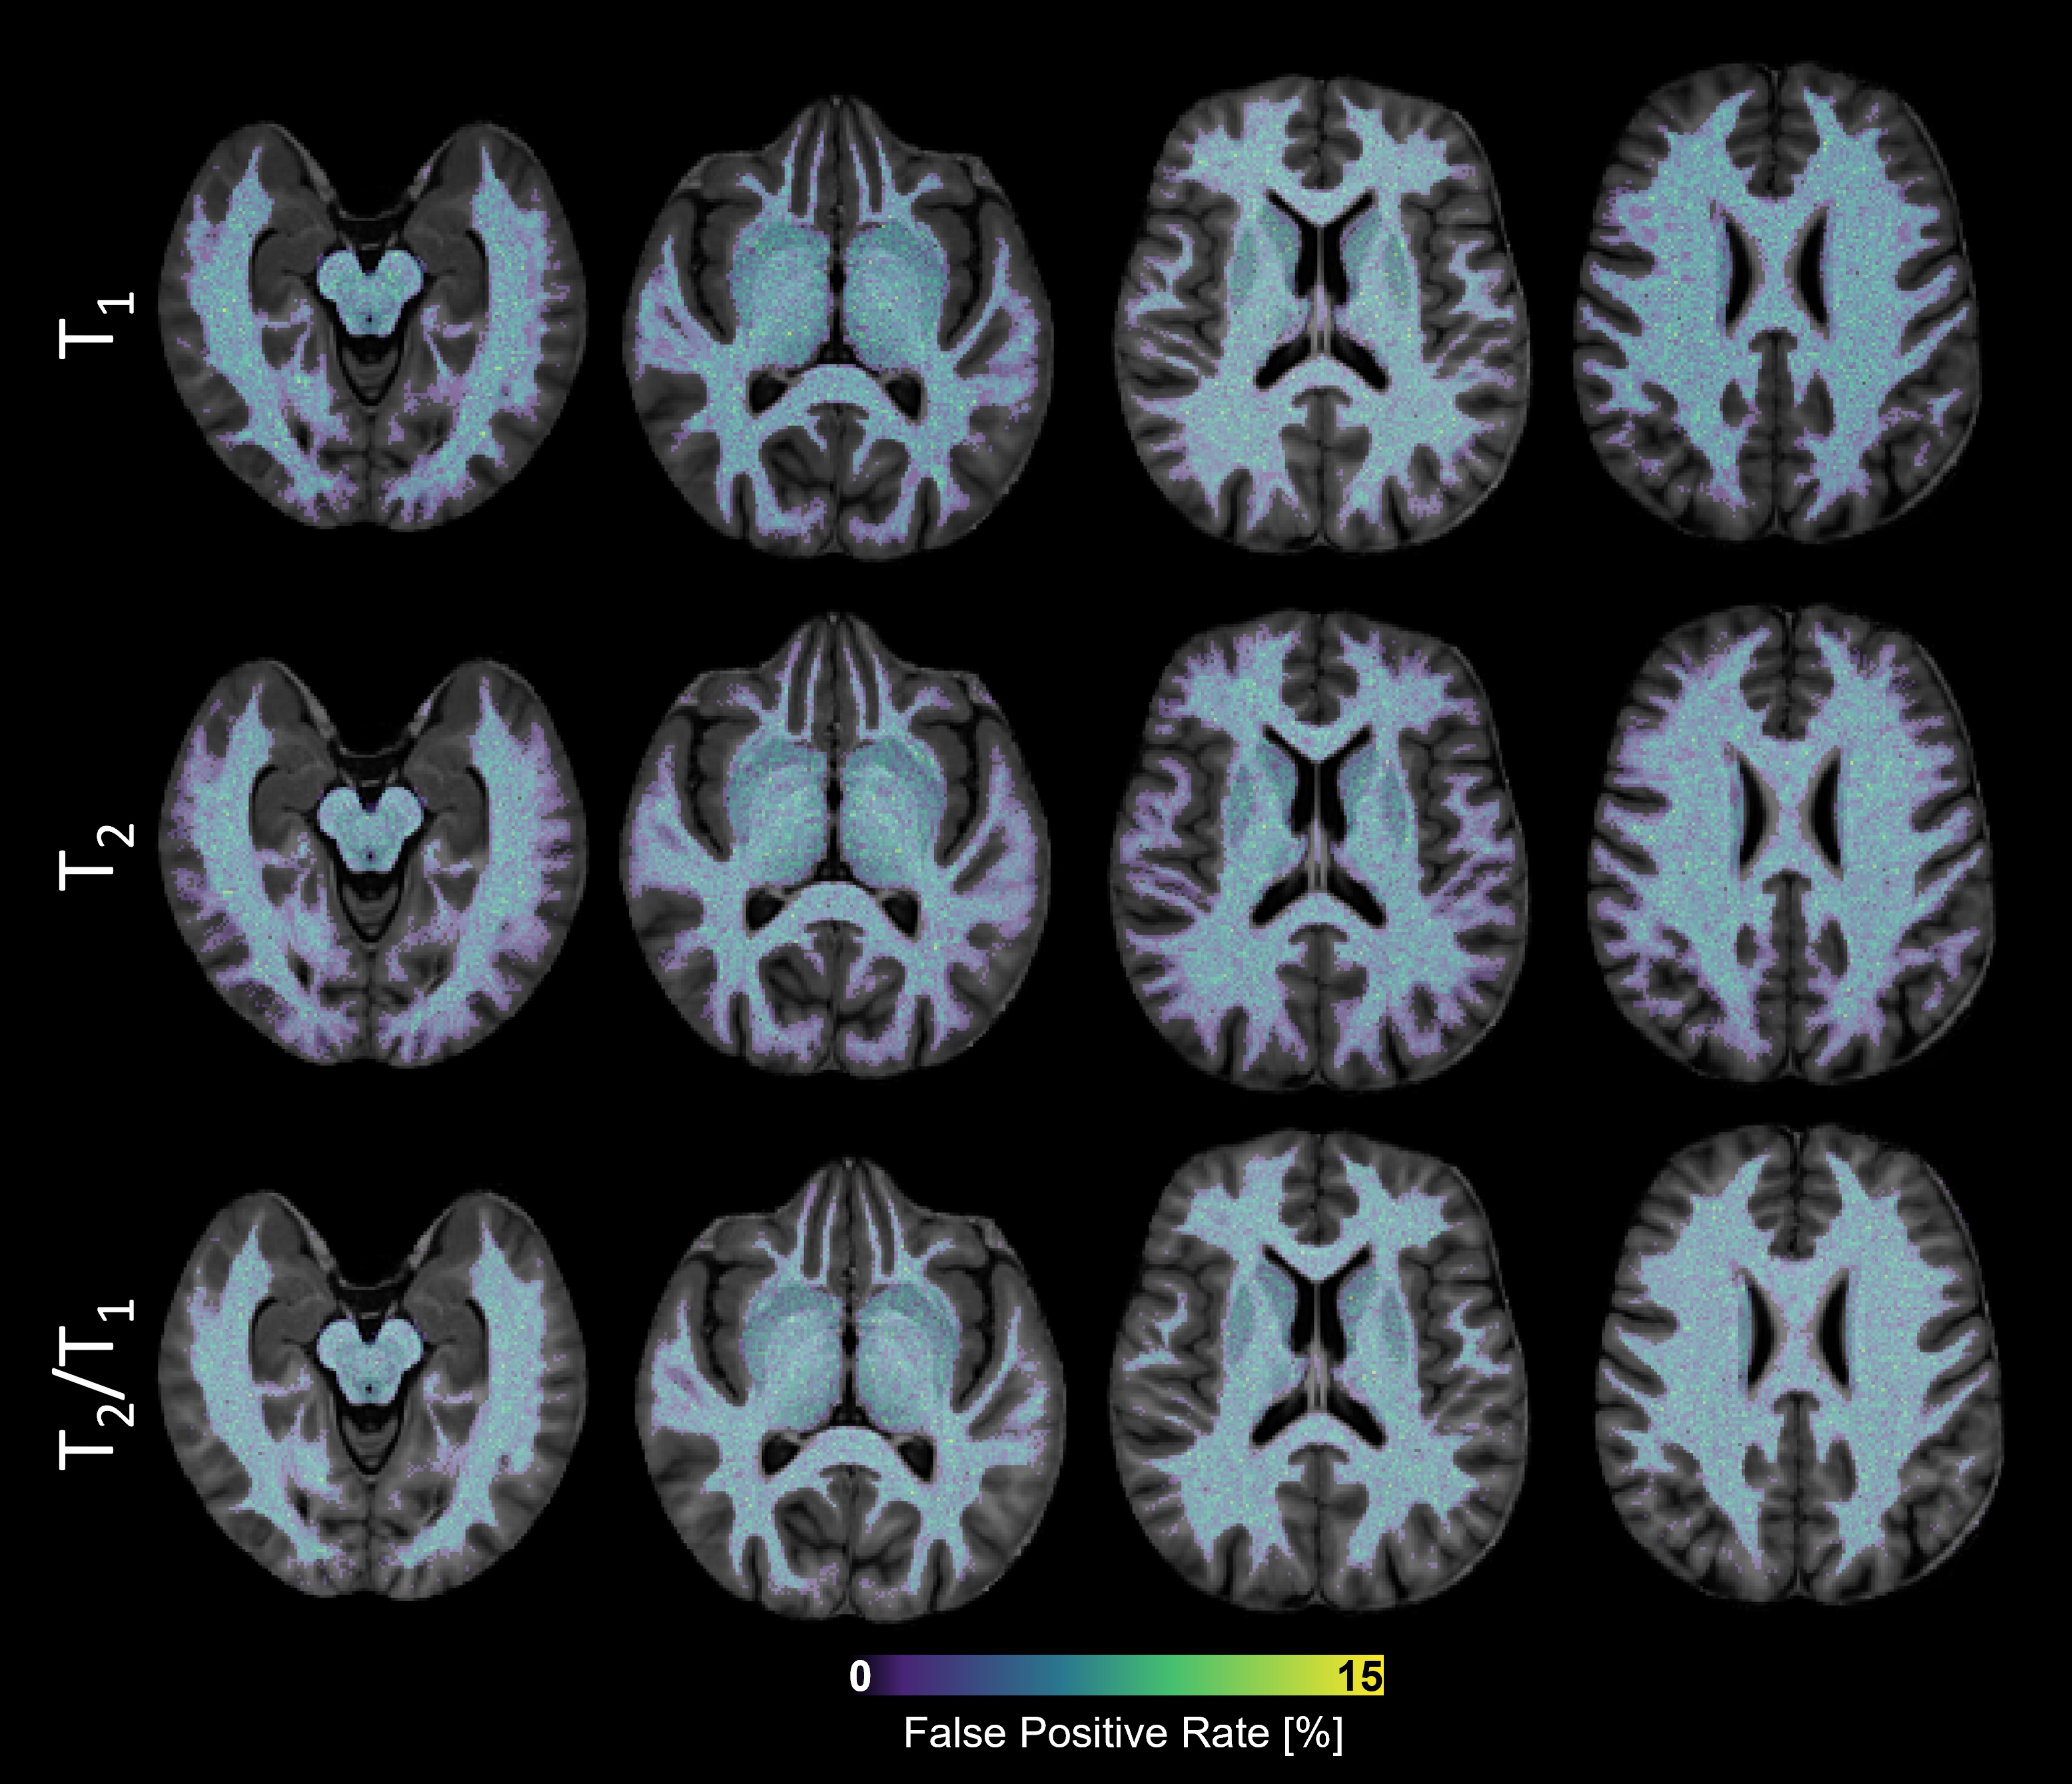
To investigate the probability of false positives in the z-score maps, the healthy cohort was split into 10 batches. For each batch, normative atlases were established from 61 healthy subjects and voxel-wise z-scores were extracted for the remaining testing healthy subjects. False positive voxels were identified by setting a z-score cut-off of |2|, and resulting maps were averaged across the testing data to create a false positive rate (FPR) map.
Results
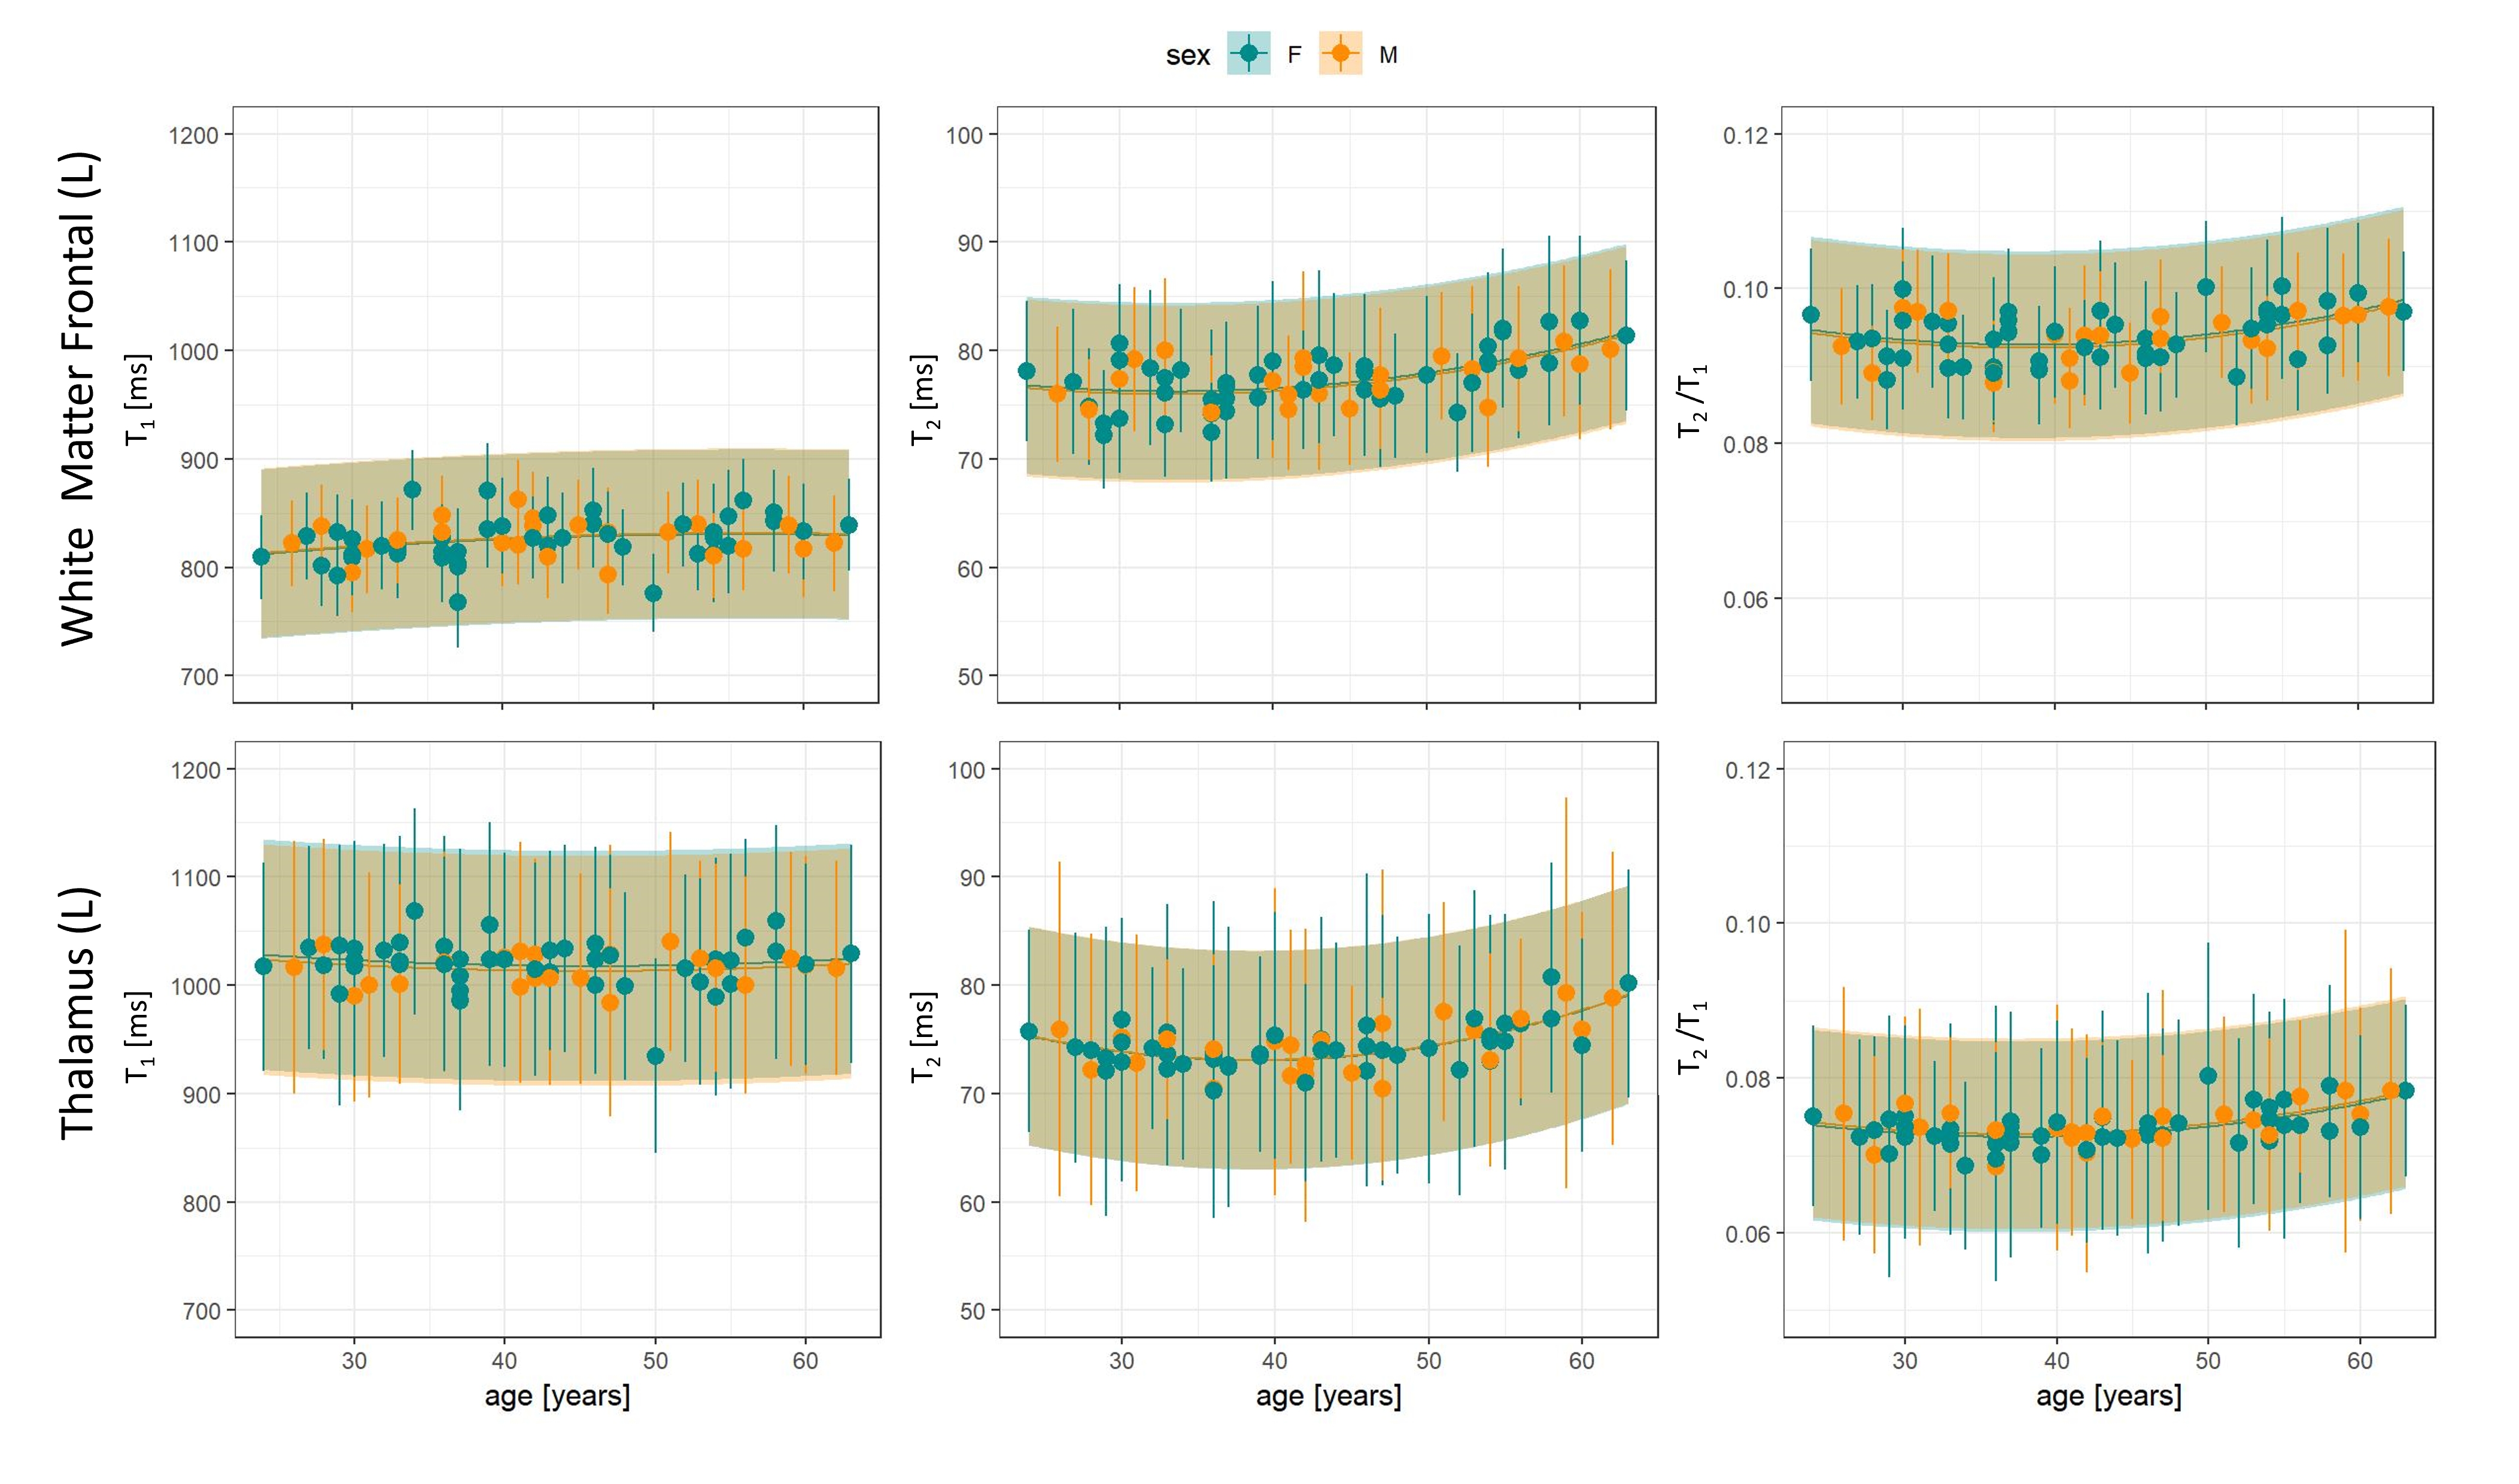
Figure 1 reports the normative atlases with the root mean squared error (RMSE) and coefficient of variation (COV) maps (ratio between RMSE and intercept), as well as the regression coefficients. On average, the COV in the white matter (WM) was 5.0±0.8% for T1, 6.4±3.4% for T2 and 7.6±3.4% for T2/T1, while higher values were observed in the deep gray matter (DGM) (T1:$$$\,$$$5.1±1.6%,$$$\,$$$T2:$$$\,$$$8.0±5.2%,$$$\,$$$T2/T1:$$$\,$$$8.6±3.9%).Regional trends of T1, T2 and T2/T1 values in the left thalamus and left frontal WM are shown in Figure 2 for the healthy cohort. T2/T1 values increased with age following a quadratic trend in both regions.
Figure 3 reports FPR maps for each atlas. In the WM, FPR was on average 5.8±1.9% for T1, 5.6±1.9% for T2 and 5.7±1.9% for T2/T1. Comparable values were observed in DGM nuclei (T1:$$$\,$$$6.0±1.9%, T2:$$$\,$$$5.5±2.0%, T2/T1:$$$\,$$$5.6±2.0%).
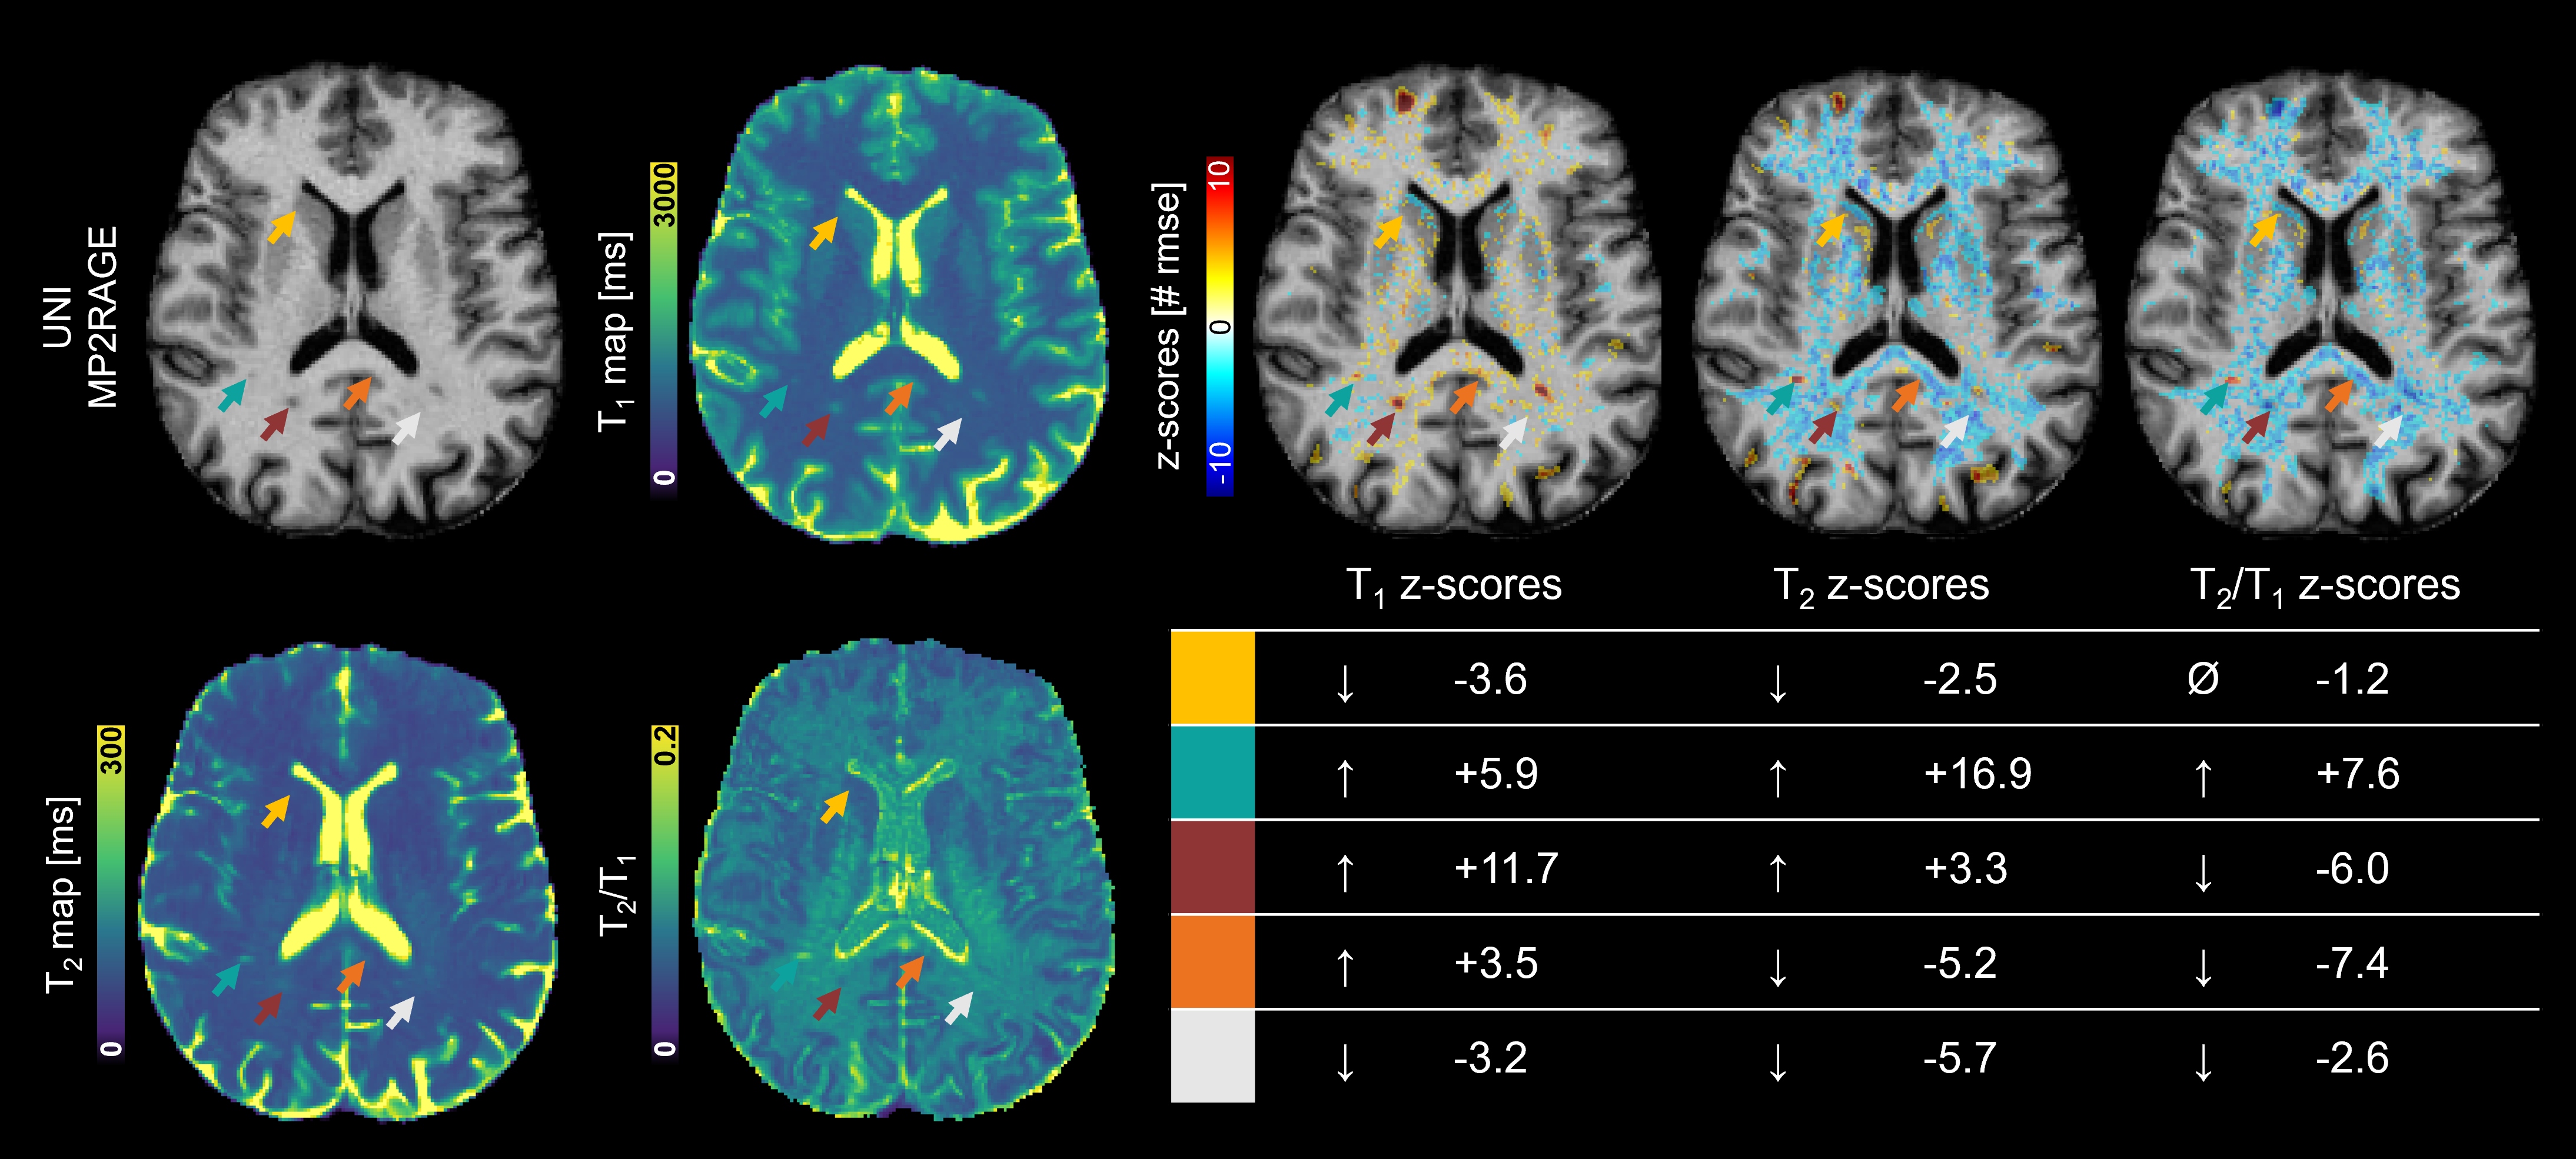
Example data of a patient with MS is shown in Figure 4, where different trends of T1, T2 and T2/T1 z-scores can be observed in different brain voxels. Notably, the amplitude and sign of T2/T1 z-scores allowed to distinguish different patterns of tissue alteration, with higher values reflecting an uncoupled variation of T1 and T2.
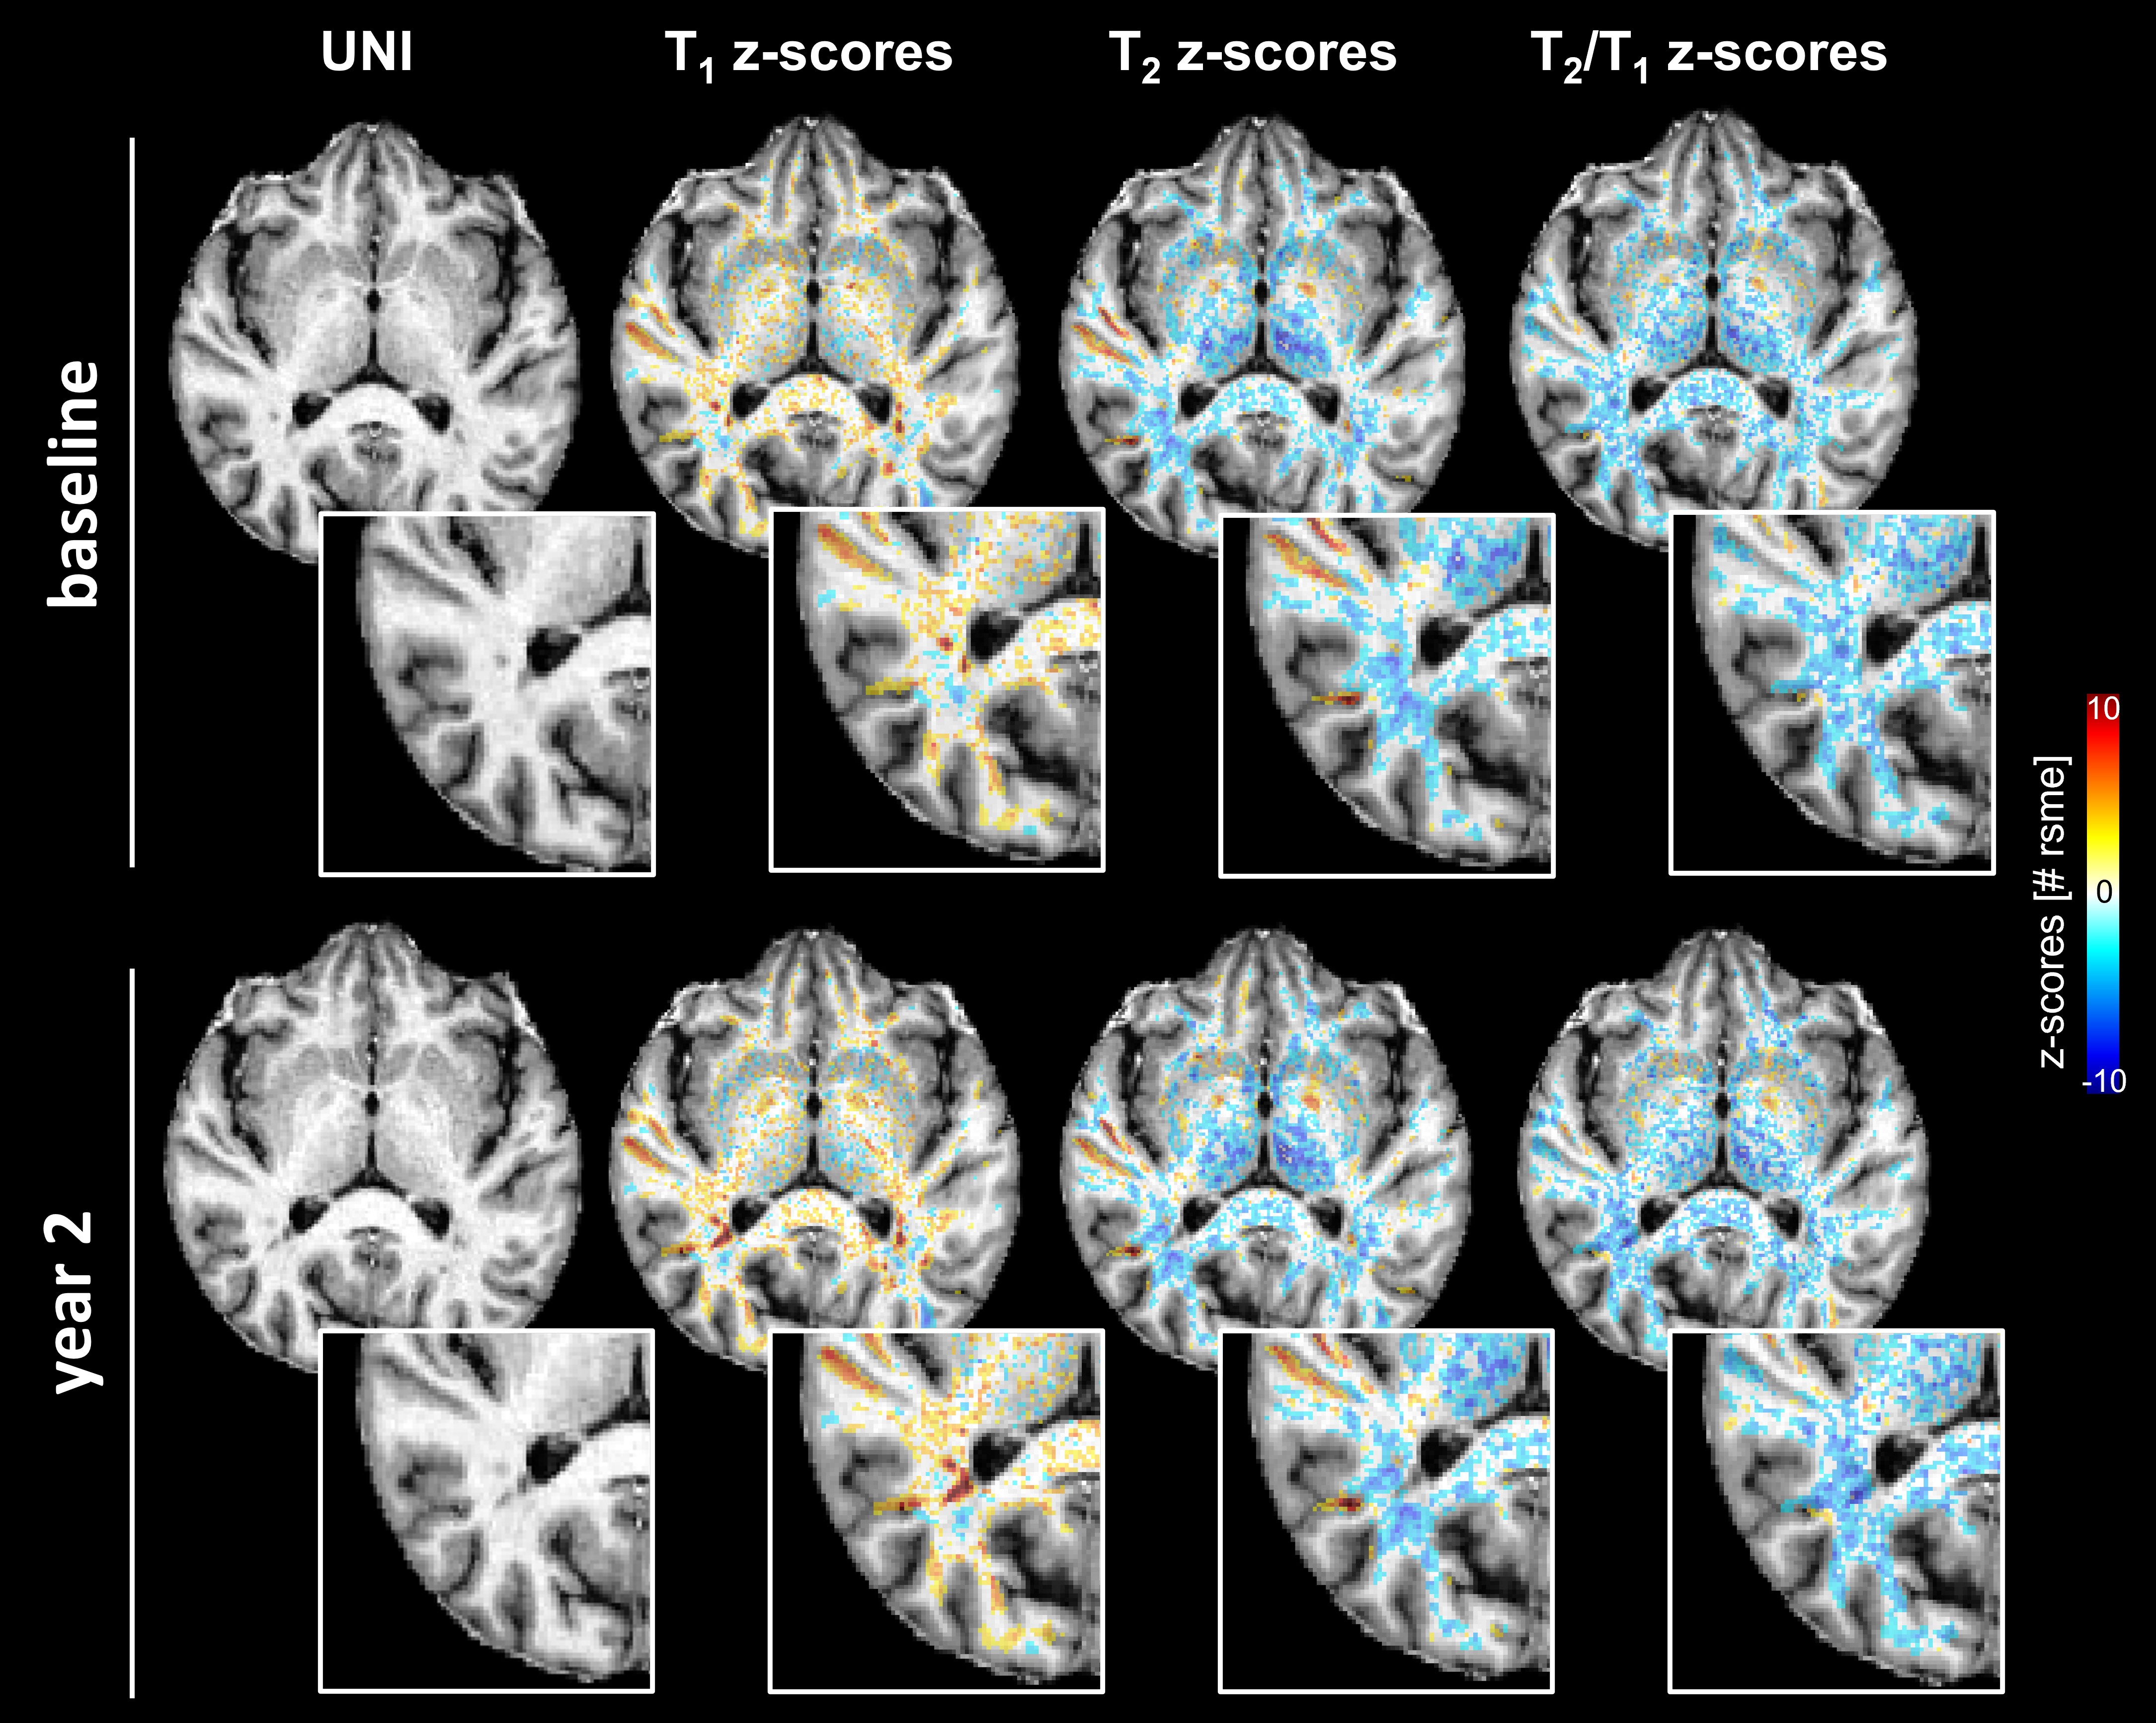
Figure 5 depicts another example patient with longitudinal data showing an enlarging lesion after two years. Significant T2 z-scores were observed in the perilesional tissue at the first time point. Notably, the T2/T1 z-scores showed a different longitudinal evolution compared to T1 and T2 z-scores.
Discussion and Conclusion
Relaxometry can be used to quantify microstructural brain tissue alterations in the presence of pathology. However, methods to combine tissue properties into a single quantitative and interpretable measure have been poorly investigated. Here, we propose a voxel-wise T2/T1 atlas established from sixty-eight healthy controls. We explore its sensitivity to brain pathology and complementarity to existing T1 and T2 atlases. Importantly, our method differs from other work that propose to use a ratio of T1- and T2-weighted intensities11–14 (i.e., not quantitative maps) to reduce common biases of weighted images.Our FPR analysis showed comparable results for the three normative atlases, suggesting a strong reliability and sensitivity to detect microstructural alterations in WM and DGM nuclei. Such findings were also supported by a low COV. Future work will focus on varying z-score thresholds to study their impact on FPR while also accounting for the number of voxels.
T2/T1 z-score maps extracted for two example MS patients reflected the coupling between T1 and T2 z-scores, hence providing an additional and complementary quantification of microstructural alterations that could support the interpretation and differentiation of the underlying pathological processes.
Acknowledgements
No acknowledgement found.References
1. Lin Y-C, Daducci A, Meskaldji DE, et al. Quantitative Analysis of Myelin and Axonal Remodeling in the Uninjured Motor Network After Stroke. Brain Connect. 2015;5(7):401-412. doi:10.1089/brain.2014.0245
2. Blystad I, Håkansson I, Tisell A, et al. Quantitative MRI for analysis of active multiple sclerosis lesions without gadolinium-based contrast agent. Am J Neuroradiol. 2016;37(1):94-100. doi:10.3174/ajnr.A4501
3. Piredda GF, Hilbert T, Granziera C, et al. Quantitative brain relaxation atlases for personalized detection and characterization of brain pathology. Magn Reson Med. 2020;83(1):337-351. doi:10.1002/mrm.27927
4. Vaneckova M, Piredda GF, Andelova M, et al. Periventricular gradient of T1 tissue alterations in multiple sclerosis. NeuroImage Clin. 2022;34(March):1-10. doi:10.1016/j.nicl.2022.103009
5. Granziera C, Wuerfel J, Barkhof F, et al. Quantitative magnetic resonance imaging towards clinical application in multiple sclerosis. Brain. 2021;144(5):1296-1311. doi:10.1093/brain/awab029
6. Marques JP, Kober T, Krueger G, van der Zwaag W, Van de Moortele P-F, Gruetter R. MP2RAGE, a self bias-field corrected sequence for improved segmentation and T1-mapping at high field. Neuroimage. 2010;49(2):1271-1281. doi:10.1016/j.neuroimage.2009.10.002
7. Hilbert T, Sumpf TJ, Weiland E, et al. Accelerated T 2 mapping combining parallel MRI and model-based reconstruction: GRAPPATINI. J Magn Reson Imaging. 2018;48(2):359-368. doi:10.1002/jmri.25972
8. Klein S, Staring M, Murphy K, Viergever M a., Pluim J. elastix: A Toolbox for Intensity-Based Medical Image Registration. IEEE Trans Med Imaging. 2010;29(1):196-205. doi:10.1109/TMI.2009.2035616
9. Schmitter D, Roche A, Maréchal B, et al. An evaluation of volume-based morphometry for prediction of mild cognitive impairment and Alzheimer’s disease. NeuroImage Clin. 2015;7(1):7-17. doi:10.1016/j.nicl.2014.11.001
10. Piredda GF, Venkategowda PB, Radojewski P, Al. E. Automated brain morphometry for sub-millimeter 7T MRI using transfer learning. Proc Int Soc Magn Reson Med. 20022; London, UK(Abstract:2155).
11. Cappelle S, Pareto D, Sunaert S, et al. T1w/FLAIR ratio standardization as a myelin marker in MS patients. NeuroImage Clin. 2022;36(March):103248. doi:10.1016/j.nicl.2022.103248
12. Nakamura K, Chen JT, Ontaneda D, Fox RJ, Trapp BD. T1-/T2-weighted ratio differs in demyelinated cortex in multiple sclerosis. Ann Neurol. 2017;82(4):635-639. doi:10.1002/ana.25019
13. Boaventura M, Sastre-Garriga J, Garcia-Vidal A, et al. T1/T2-weighted ratio in multiple sclerosis: A longitudinal study with clinical associations. NeuroImage Clin. 2022;34(December 2021). doi:10.1016/j.nicl.2022.102967
14. Pareto D, Garcia-Vidal A, Alberich M, et al. Ratio of T1-weighted to T2-weighted signal intensity as a measure of tissue integrity: Comparison with magnetization transfer ratio in patients with multiple sclerosis. Am J Neuroradiol. 2020;41(3):461-463. doi:10.3174/AJNR.A6481
Figures