2156
Investigating the Accuracy of PD Measurements at 3T1Medical Physics, St George’s University Hospitals NHS Foundation Trust, London, United Kingdom, 2Joint Department of Physics, The Institute of Cancer Research and The Royal Marsden NHS Foundation Trust, London, United Kingdom, 3The Royal Marsden NHS Foundation Trust, London, United Kingdom
Synopsis
Keywords: Phantoms, Quantitative Imaging
We investigated the accuracy of clinical proton density (PD) mapping employing the variable flip-angle (VFA) method at 3T, considering the effects of B1+ and B1- fields. Following B1+ correction, the PD measurements were within 5% of the expected value for flip-angle variations up to 18%. Considerable discrepancies were observed for T1<300ms and flip-angle variations >25%. Using image intensity filters, considerable PD variations were found at the edges of the test object. Clinically, the B1+ and B1- corrected PD values of the brain were similar to values reported in the literature, rendering the VFA method a viable tool for PD mapping.Introduction
Quantitative Magnetic Resonance Imaging (QMRI) methods are increasingly used to study tissue properties non-invasively, mapping relaxation times and proton density (PD) to aid diagnoses and assess response to treatment1. Different methods are available, but long Acquisition Times (Tacq) are impractical2. The Variable Flip Angle (VFA) method offers high resolution imaging with short Tacq3 to map both PD and T14 but requires accurate knowledge of the actual flip angle. Hence, it is vulnerable to errors in the transmitted RF field (B1+), which are significant at 3T due to the conductivity of the subject5.Objective: To determine whether the VFA method can be used clinically to produce accurate PD maps at 3T when used in conjunction with B1+ mapping tools and post-processing to remove B1+ and receive RF field (B1-) effects. Differences in receiver coil loading were also investigated while focusing on brain tissue mapping.
Methods
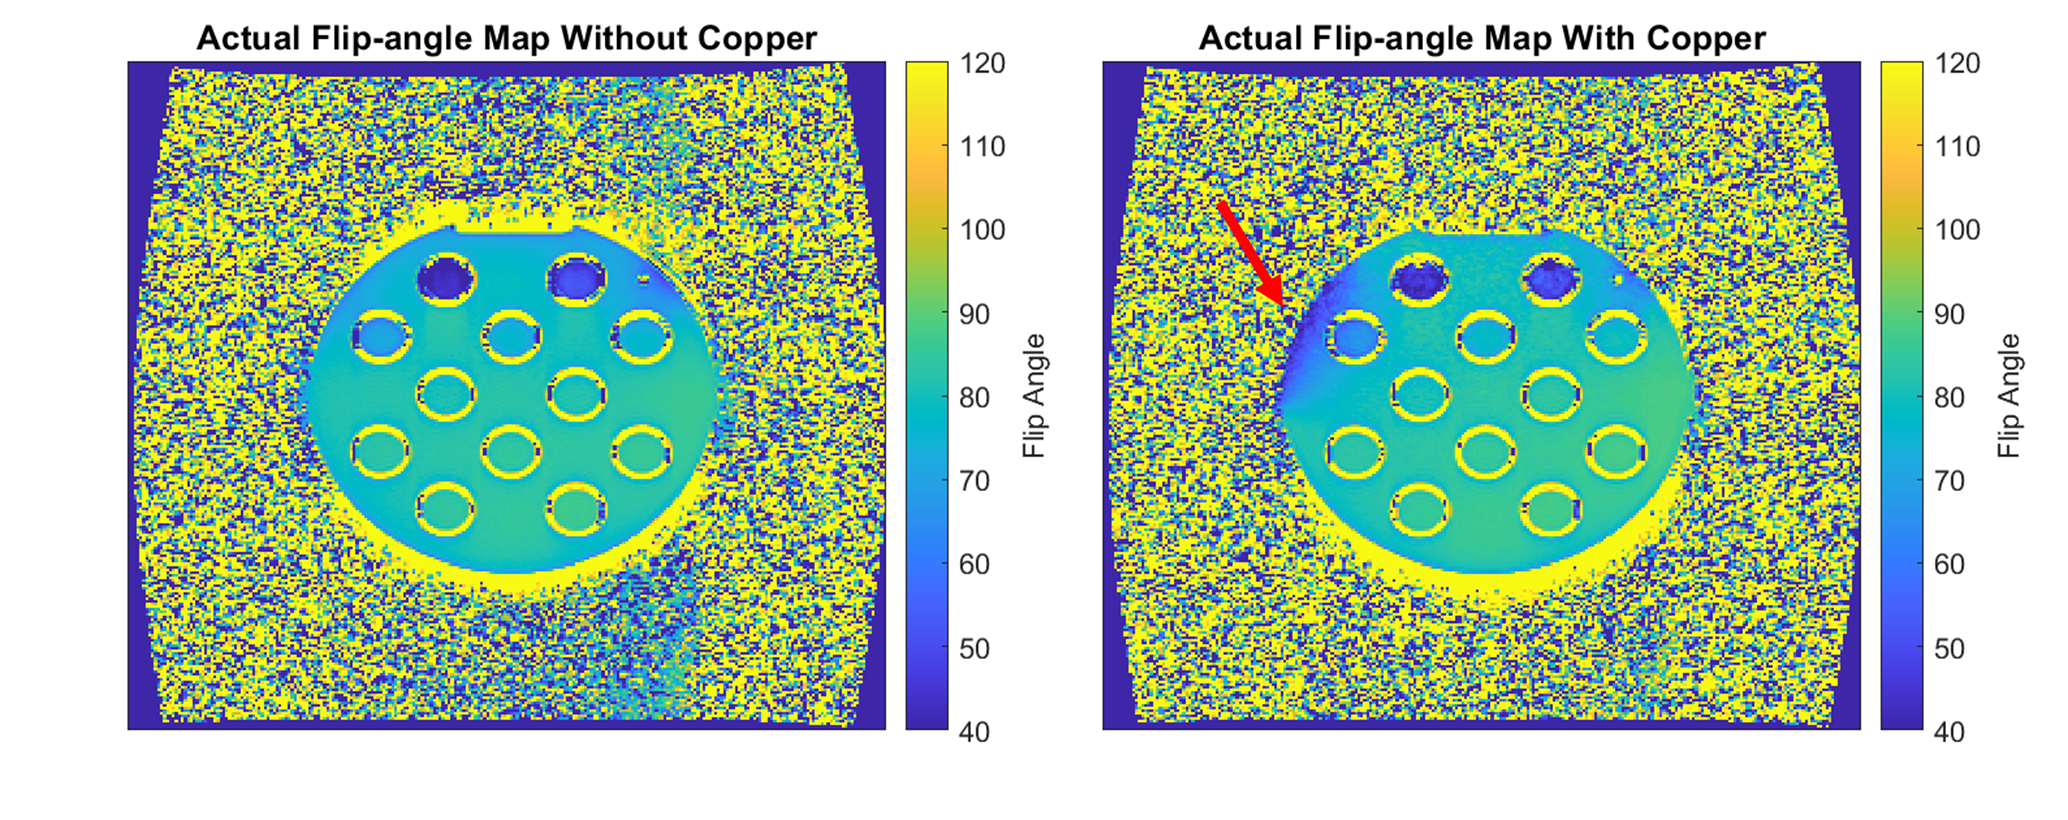
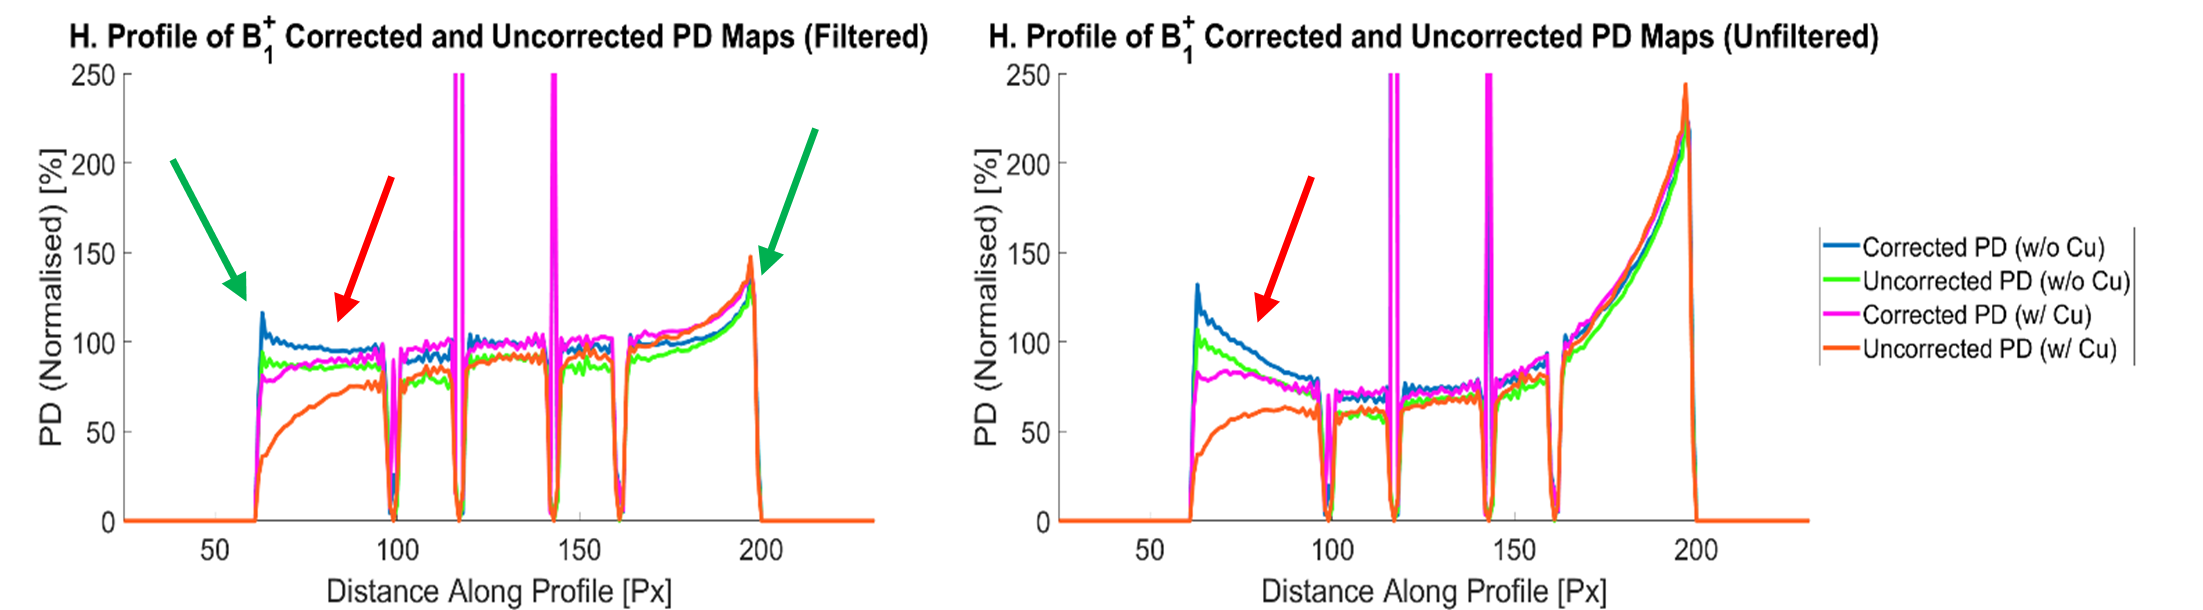
Work was undertaken at 3T (Siemens MAGNETOM Vida & Skyra, Erlangen, Germany) at the Royal Marsden Hospital, using the integrated transmit body coil with a 20-channel head receiver coil.Experiment 1: Initial experiments assessed PD and T1 measurements in a Eurospin (Diagnostic Sonar, Livingston, Scotland) Test Object (TO) with and without B1+ corrections. This required using Siemens’ B1+ mapping tool, which uses the 2D Actual Flip-angle Imaging (AFI) method and implementing it in the calculation for PD and T1. Acquisitions were repeated with and without Image Intensity Filters (IIFs) to assess whether these could correct B1- bias. PD maps were generated using in-house software (MATLAB 2019b), on a voxel-wise basis from the signal intensity and flip angle. B1+ mapping tool performance was assessed by adhering copper to the Eurospin TO, inducing strong B1+ inhomogeneities, and repeating PD measurements.
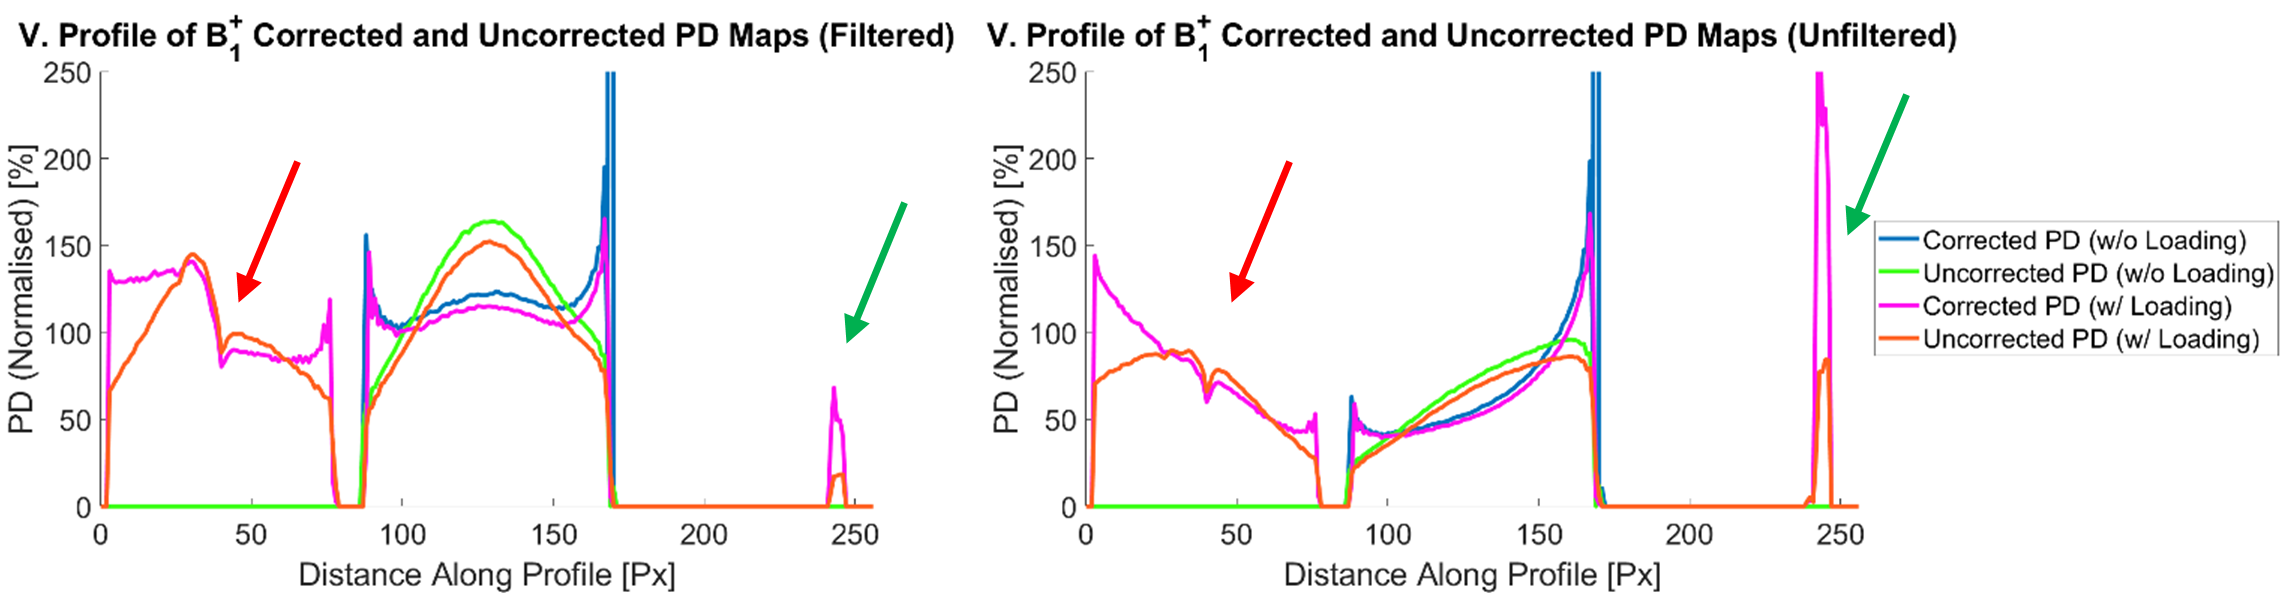
Experiment 2: For PD mapping to be useful for diagnoses or treatment assessments, individuals’ tissue measurements will need to be evaluated against a range of healthy tissue values. Therefore, it needed to be ascertained whether patient size variations impact PD measurements. Therefore, PD in a uniform TO was measured and repeated with additional TOs in order to load the transmit coil (integrated body) and receive coil (head coil) differently, simulating variations in patient sizes.
Experiment 3: Head coil sensitivity was mapped by measuring PD in an oil phantom (IIFs disabled, B1+ corrected) and assuming PD variations were solely due to B1- bias. This was applied to the previous PD experiment.
Experiment 4: PD was measured in a volunteer with research-ethics approval. VFAs of 3° & 14° were selected as these are optimal for tissues with T1 ~1000ms6, in-between White Matter (WM) and Grey Matter (GM) at 3T. Tacq for two VFA sequences and a B1+ map was ~90s. Coil sensitivity was measured prior to scanning.
Results
Experiment 1: Correcting B1+ errors improved results, but variations in coil sensitivity caused apparent reductions in PD. IIFs caused variations unlike those associated with coil sensitivity. PD was reduced in regions near the copper, indicating a limit of the B1+ mapping tool.Experiment 2: Frequency adjustments and appropriate B0 shimming resulted in negligible differences in PD measurements with the additional loading. Variations caused by IIFs were more obvious with the uniform TO.
Experiment 3: Correcting PD measurements of B1- bias improved uniformity but was not completely effective. Possibly due to additional post-processing that affects signal intensity.
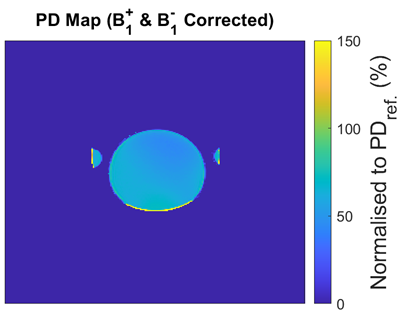
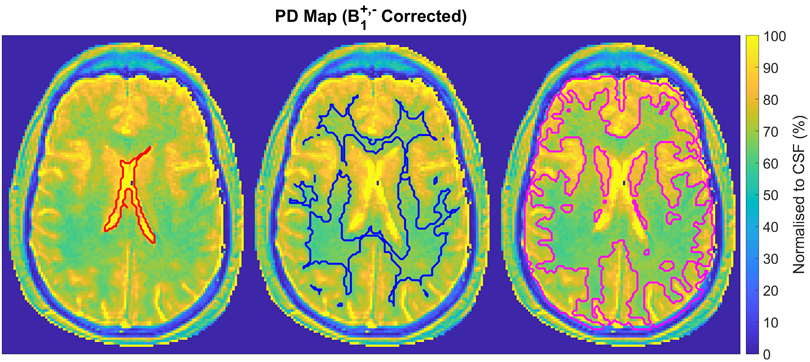
Experiment 4: B1+ and B1- corrected PD measurements normalised to the PD of CSF were generated, resulting in values like those in the literature (PDWM = 65.9±3.7%, PDGM = 80.5±8.1%). The ventricles, WM and GM were segmented using SPM127 (Functional Imaging Laboratory, Wellcome Centre for Human Neuroimaging, London, UK). Average T1 measurements (T1CSF = 5319±3614ms, T1WM = 957.8±384.1ms, T1GM = 1398±965.8ms) were also found to be like those reported in the literature, providing greater confidence in the results.
Discussion
Results show IIFs do not remove the coil sensitivity weighting completely with TOs showing unexpected variations in PD closest to their edges. Better results were achieved using a B1- map obtained in oil but is only possible in fixed coils. Additionally, B1+ correction is essential for accuracy; the B1+ mapping tool is only accurate for small variations. The remaining areas of concern are tissues with T1 < 300ms and with B1+ inhomogeneities >25%.Though average PD and T1 values resembled those in the literature8, this study highlights the distribution of brain tissue measurements, meriting further discussion. The distribution can be attributed to noise and partial volume effects, but errors in TOs have also been demonstrated. While the VFA method offers high resolution in 3D, the AFI B1+ mapping produced by Siemens is 2D, and this may be a source of error9. For the future, a 3D AFI should be explored as an alternative.
Conclusion
Measuring PD at 3T is viable with the VFA and B1+ mapping tool. For flip angle variations of up to ~18%, PD measurements were kept within 5% of the correct value. Best results were achieved without IIFs and correcting coil sensitivity using a non-conductive (oil) TO. Unfixed coils are not recommended, and regular QA is needed since changes in coil performance will affect coil sensitivity.Acknowledgements
This study represents independent research funded by the National Institute for Health and Care Research (NIHR) Biomedical Research Centre and the Clinical Research Facility in Imaging at The Royal Marsden NHS Foundation Trust and The Institute of Cancer Research, London. The views expressed are those of the author(s) and not necessarily those of the NIHR or the Department of Health and Social Care.References
1. Baudrexel S, Reitz S, Hof S, et al. Quantitative T1 and proton density mapping with direct calculation of radiofrequency coil transmit and receive profiles from two-point variable flip angle data. NMR in Biomedicine. 2016; 29(3): 349–360.
2. Neeb H, Zilles K, Shah N.J., et al. A new method for fast quantitative mapping of absolute water content in vivo. NeuroImage 2006; 31(3): 1156-1168.
3. Liberman G, Louzoun Y, Bashat D.B., et al. T-1 Mapping Using Variable Flip Angle SPGR Data With Flip Angle Correction. Journal of magnetic resonance imaging 2014; 40.
4. Wang Y, Chen Y, Wu D, et al. STrategically Acquired Gradient Echo (STAGE) imaging, part II: Correcting for RF inhomogeneities in estimating T1 and proton density. Magnetic Resonance Imaging. 2018; 46: 140–150.
5. Vaidya MV, Collins CM, Sodickson DK, et al. Dependence of B1+ and B1- Field Patterns of Surface Coils on the Electrical Properties of the Sample and the MR Operating Frequency. Concepts Magn Reson Part B Magn Reson Eng. 2016; 46(1): 25-40.
6. Wood T.C. Improved formulas for the two optimum VFA flip-angles. Magnetic Resonance in Medicine 2015; 74(1): 1–3.
7. Flandin G, Wellcome Trust Centre for Neuroimaging, University College, London, 12 Queen Square, London, WC1N 3BG
8. Bojorquez J.Z., Bricq S, Acquitter C, et al. What are normal relaxation times of tissues at 3 T? Magnetic Resonance Imaging 2017; 35: 69-80.
9. Malik S.J., Kenny G, Hajnal J.V. Slice profile correction for transmit sensitivity mapping using actual flip angle imaging. Magnetic resonance in medicine 2011; 65(5): 1393–1399.
Figures