2152
T1 and T2* Relaxometry MRI of Knee Growth Plate Using Ultra-Short TE MRI: Feasibility Study1Biomedical Imaging Center, Beckman Institute, University of Illinois at Urbana-Champaign, Urbana, IL, United States, 2Beckman Institute, University of Illinois at Urbana-Champaign, Urbana, IL, United States
Synopsis
Keywords: Cartilage, Relaxometry, growth plate, UTE
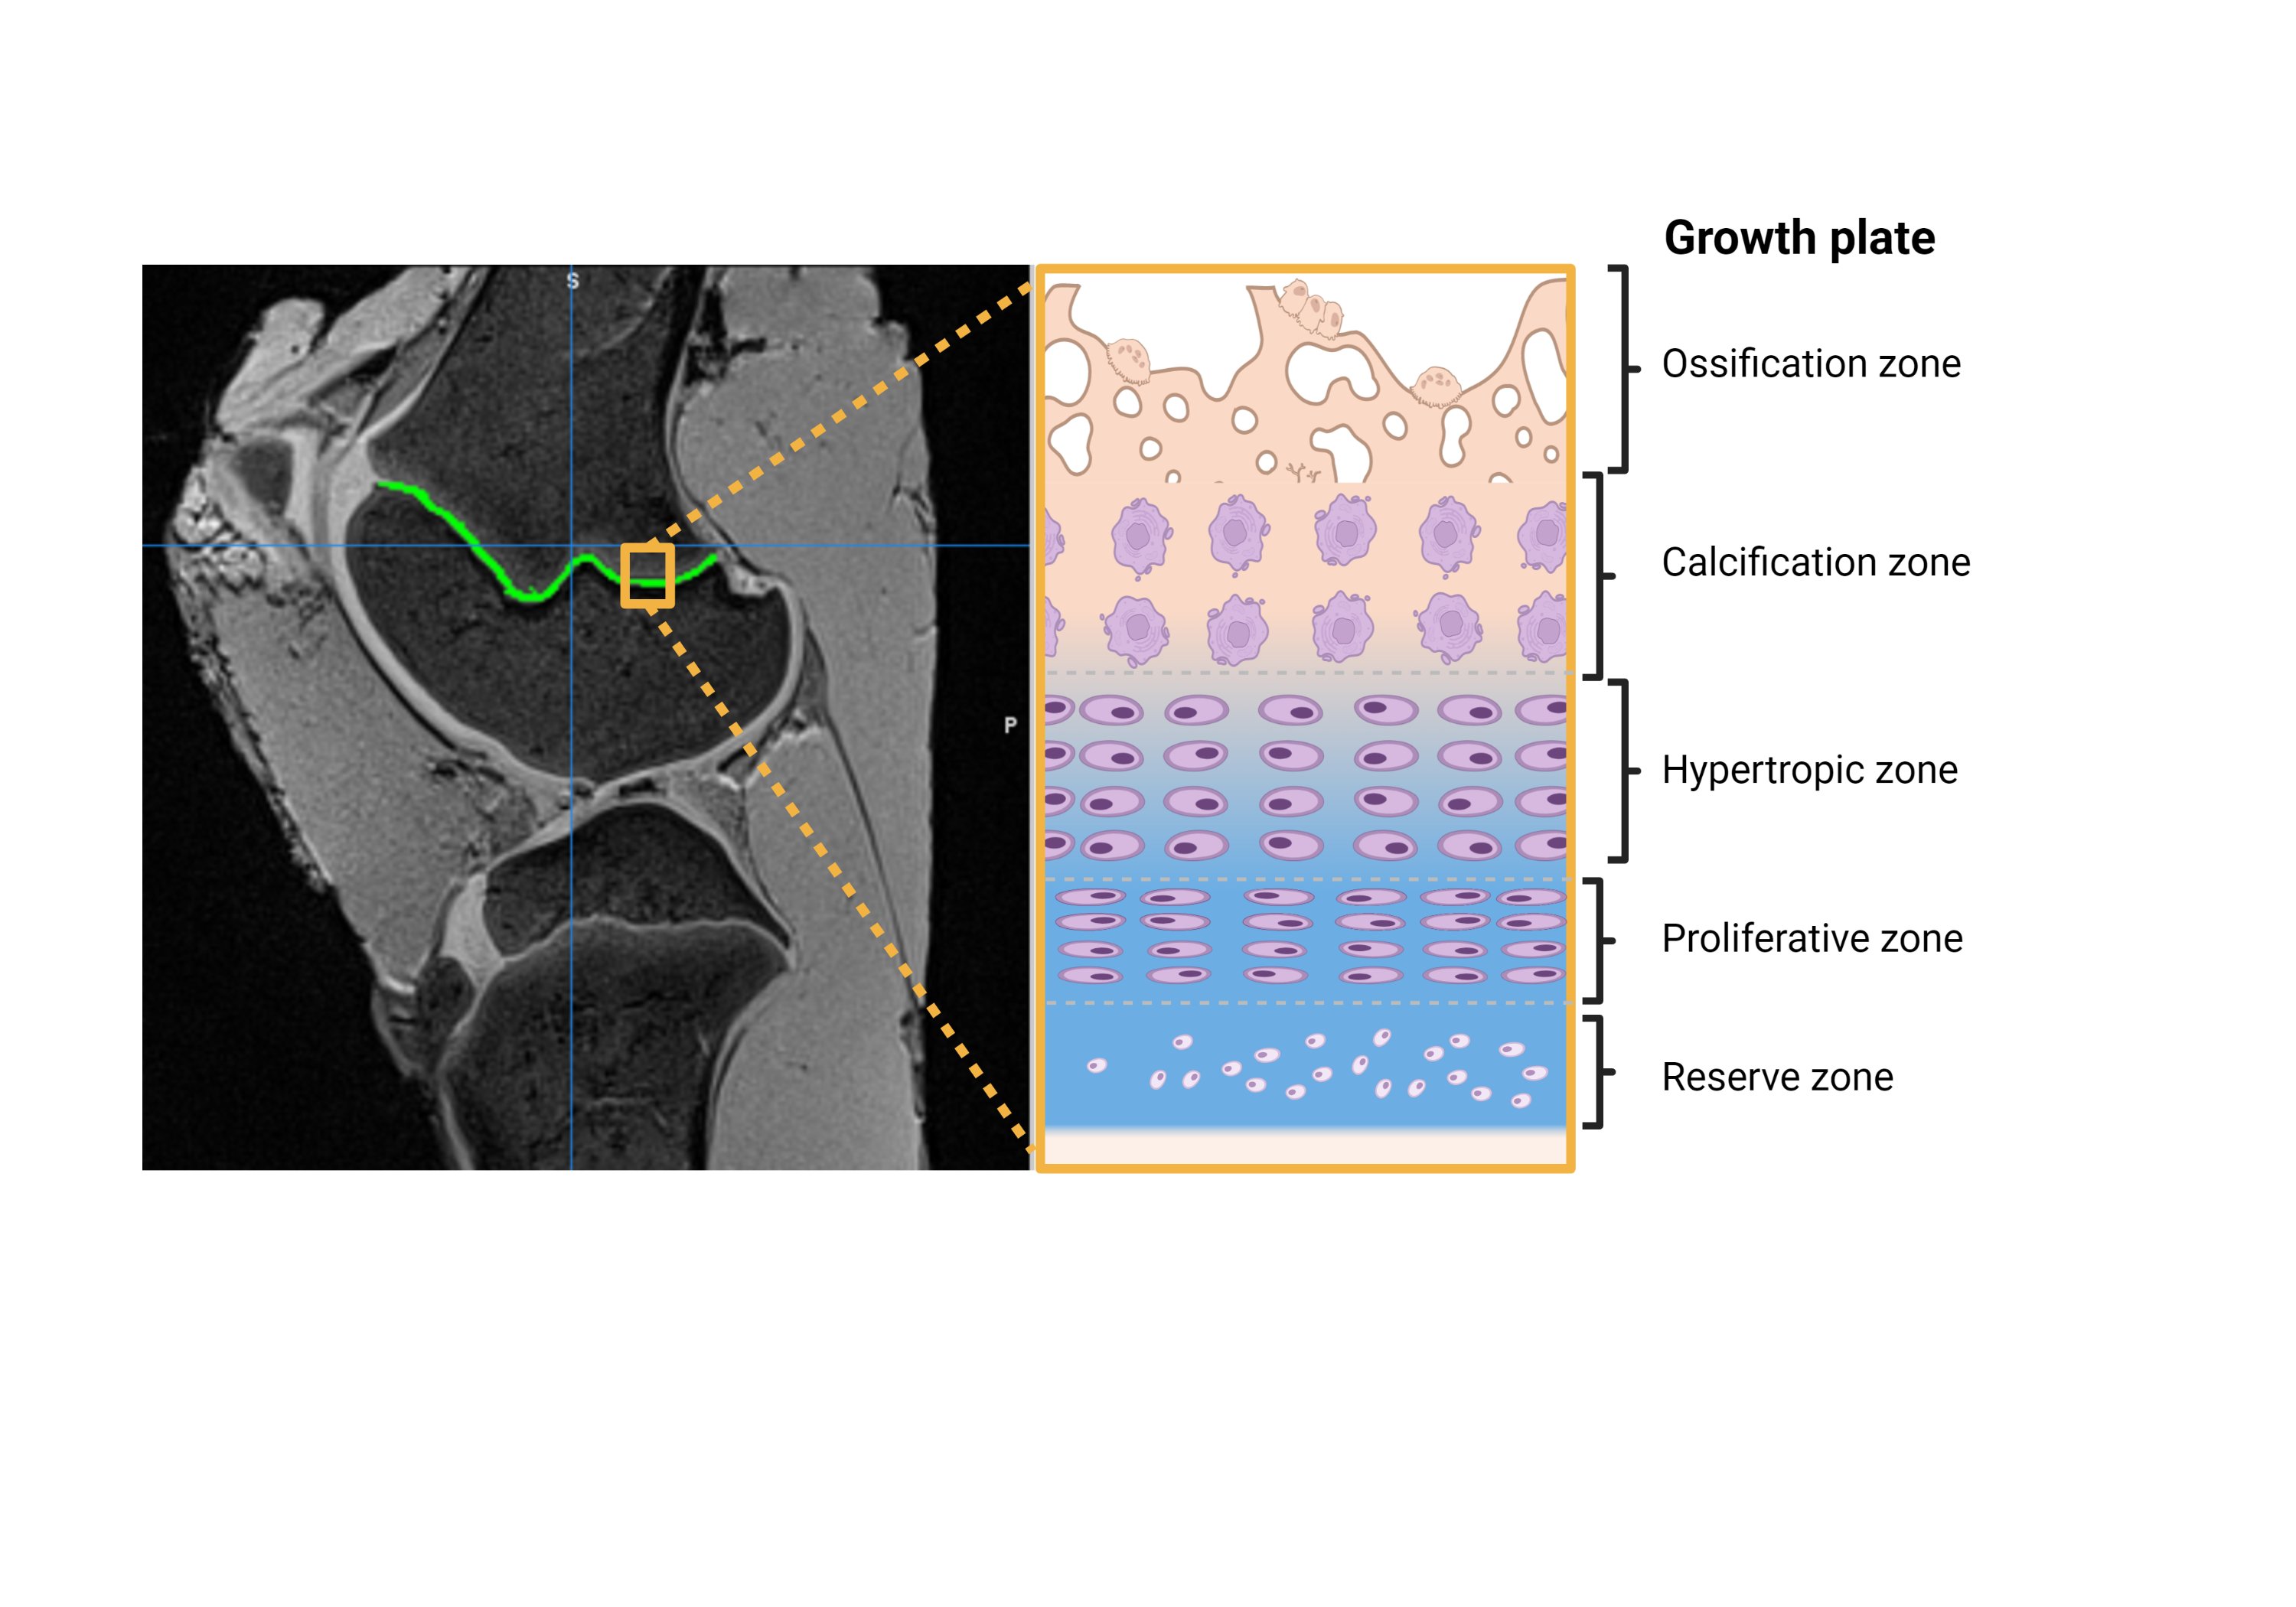
Growth plates are one of the most common sites of injury in the young skeleton. The growth plate is an interwoven and multi-layered interfacial tissue that transitions from cartilaginous to mineral morphology as it extends into metaphysis of long bones. We used Ultrashort Echo-time (UTE) MR imaging as a promising sensitive technique to detect the growth plate transition that has short T2. The UTE sequence was extended to measure T2* and T1 using multi-echoes and variable flip angles. The contrast of the transitional zone was further enhanced by a ratio of T1 over T2*.Introduction
Growth plates are one of the most common sites of injury in the young skeleton, especially in aspiring athletes. Growth plate injuries result in systemic healthcare burden and impairment of long-term musculoskeletal health. The complications associated with growth plate injuries are due in part to unavailability of early and non-invasive diagnostic techniques to prevent injury and improve intervention outcomes. MRI is a promising imaging modality for the diagnosis of musculoskeletal injuries that has been used to non-invasively detect structural and compositional changes in biological tissues such as bone and cartilage.1–3 Conventionally, cartilage-specific MR sequences have been used to detect and morphologically assess the cartilaginous growth plate. However, these sequences can only provide a bi-phasic contrast that distinguishes cartilage from surrounding bone, without capturing the transitional zone that extends into the metaphysis.3 The growth plate is an interwoven and multi-layered interfacial tissue that transitions from cartilaginous to mineral morphology as it extends into metaphysis of long bones (Figure 1).4 In this study, we used Ultrashort Echo-time (UTE) MR imaging, a flexible and emergent technique that circumvents limitations of conventional sequences by providing qualitative and quantitative assessments of tissues with short T2 relaxation times, such as bone.5,6 We evaluated the utility of UTE in capturing morphology and T1 and T2 relaxometry in growth plate.Methods
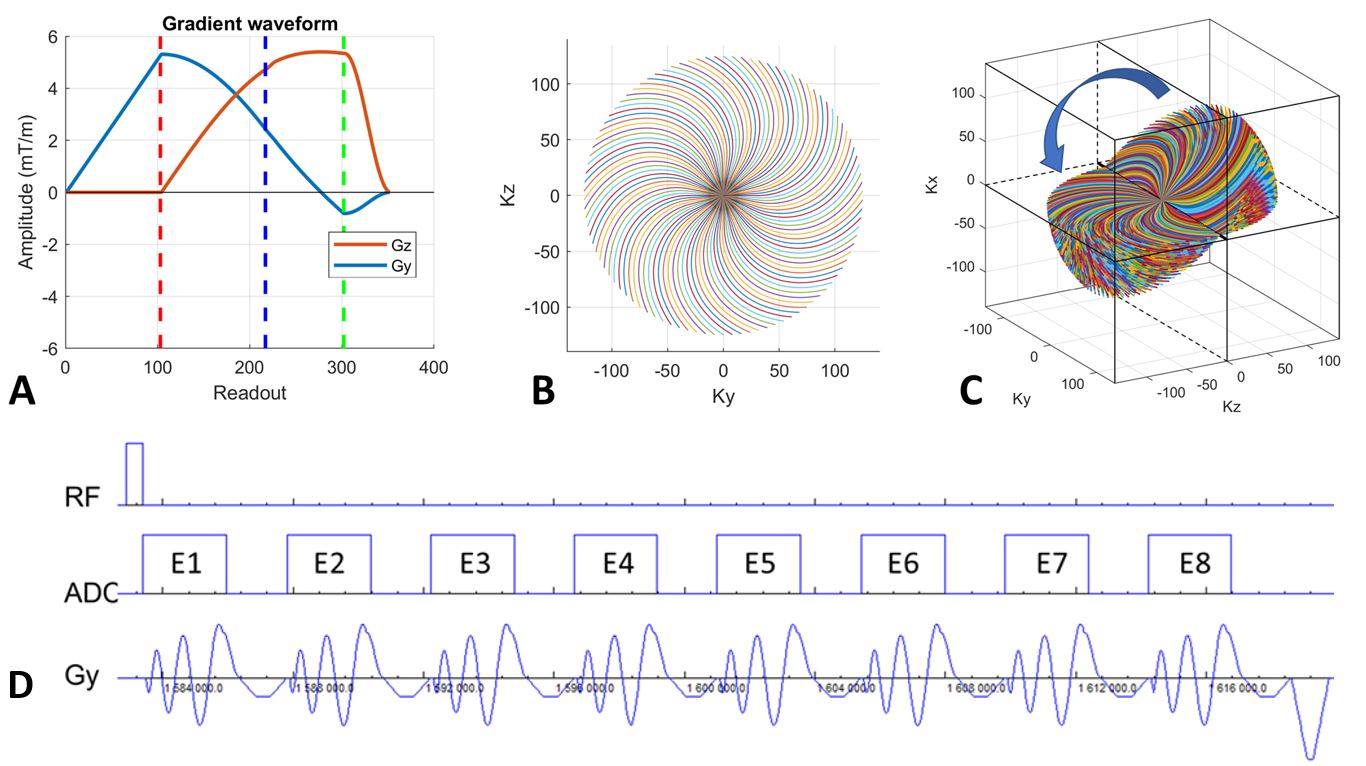
Intact hindlimbs were collected from two 6-month-old castrated male pigs7 that were provided from Meat Science Laboratory. Intact, freshly harvested knees were placed in a 15-channel knee coil and inside a 3T MRI scanner with the tibial longitudinal axis oriented parallel to the main magnetic field. For morphological imaging, conventional 3-dimensional (3D) T1-weighted interpolated breath-hold examination (VIBE; TR/TE = 12 /4.07 ms; FA 10 degrees; scan time 5 minutes) sequence and 3D T2-weighted dual echo steady state (DESS) sequence (TR/TE = 11/3.5 ms) were used. UTE sequence was a custom-built sequence of a rotation-of-spiral disc (RSD) with extension into multiple echoes and variable flip angles (Figure 2).8 The echo times for multiple echo UTE sequence were from 0.13 to 29.53 ms at an interval of 4.2 ms with TR=28 ms and flip angle = 15 degree. The scan time was 9:10 min. The flip angles for the variable flip angle UTE sequence were 2, 3, 4, 5, 7, 9, 12, and 15 degrees with TE = 0.2 ms and TR=28 ms. The scan time was 9:10 min. The voxel size was 0.5 mm and 0.8 mm isotropic for morphologic and UTE scans, respectively. T1 and T2* maps were calculated from the multi-echo UTE and variable flip angle UTE images using mono-exponential T1 and T2* relaxation, respectively. The contrast of the growth plate was further enhanced by taking a ratio of T1 over T2* maps in each voxel.Results
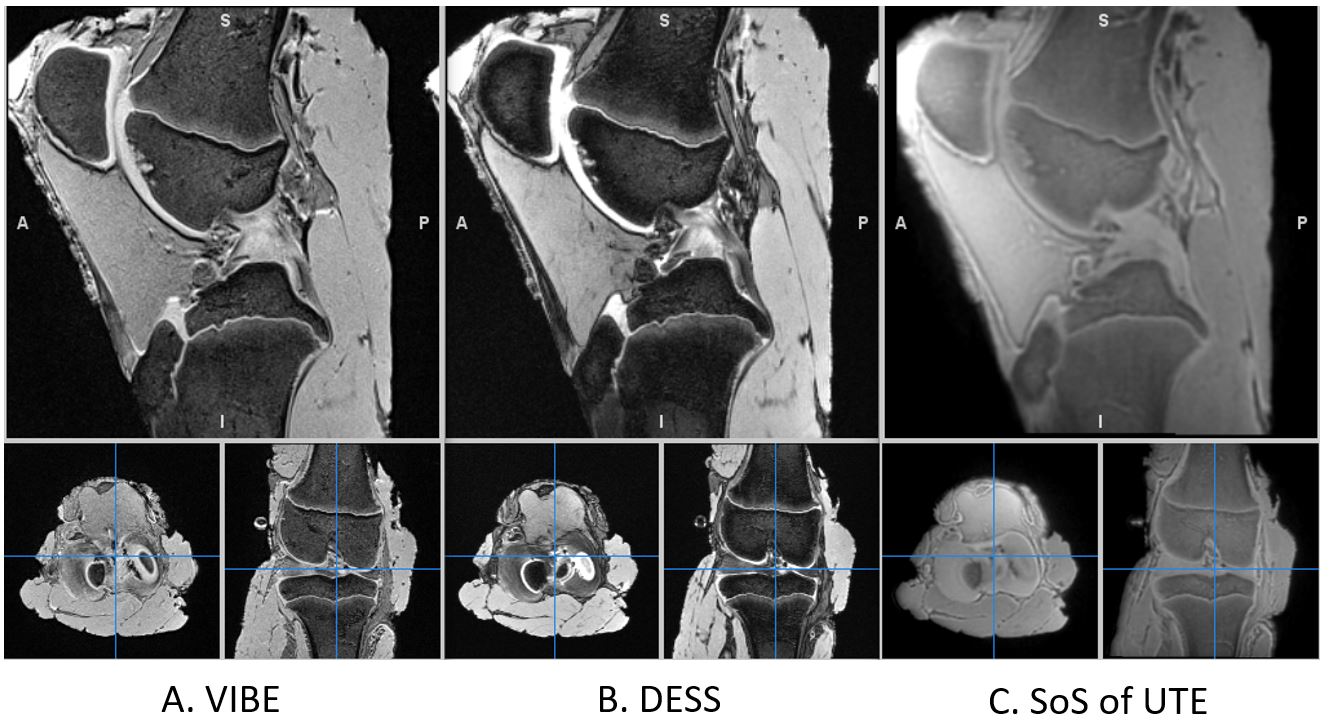
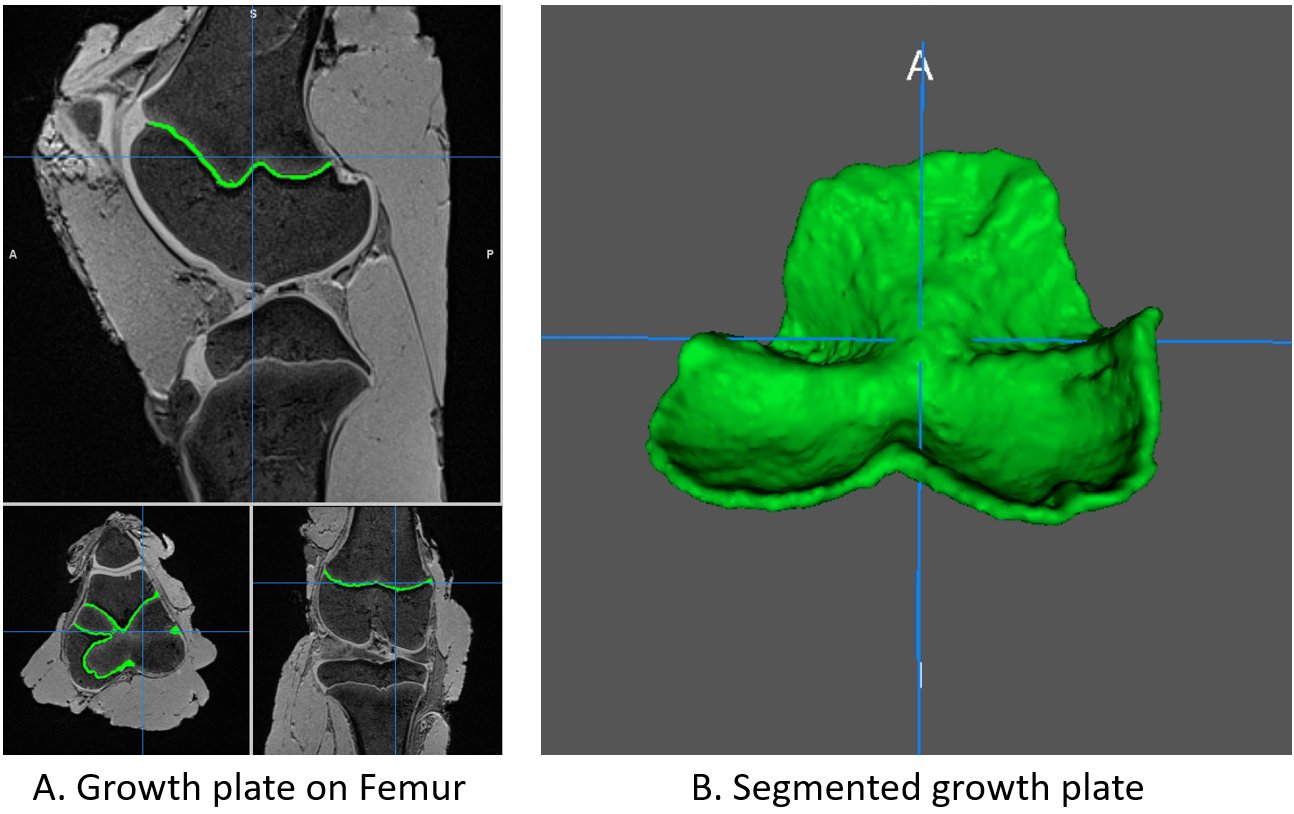
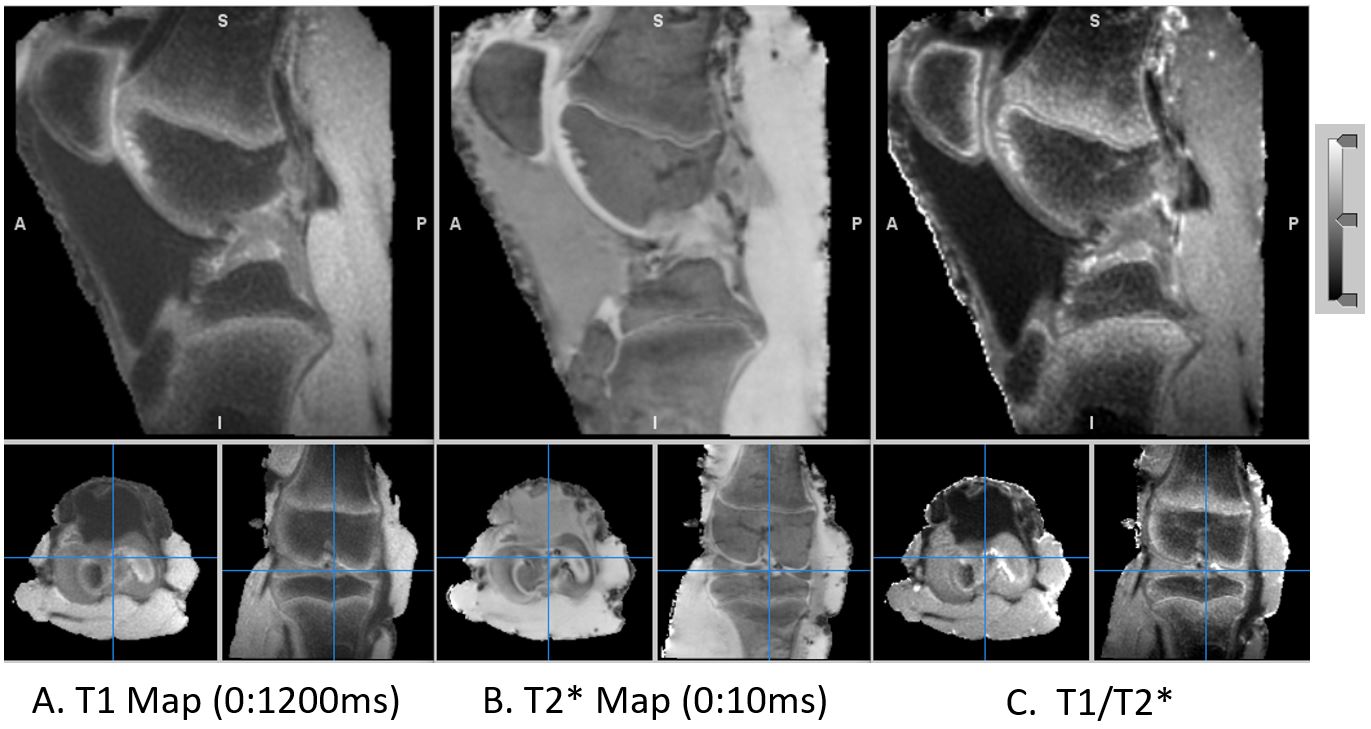
Qualitative representative sections of VIBE, DESS, and UTE images are shown in Figure 3. As expected, VIBE and DESS sequences captured cartilaginous growth plate with high contrast. Sum-of-squares map of the UTE signal was sensitive to tissues with short T2, e.g. cruciate ligaments and bone. The cartilage of the growth plate could be segmented well due to the high contrast of cartilage in morphologic imaging (Figure 4). Figure 5 shows T1 and T2* relaxation times maps at the knee joint. At and near the grow plate T1 and T2* relaxation times are higher compared to the metaphyseal region of the bone. Map of T1/T2* enhances the detection of growth plate interface as it transtisions between cartilage and metaphyseal bone.Discussion
Despite advances in MR detection of both cartilage and bone, conventional MR imaging sequences do not capture complexity of the growth plate and its mineralizing cartilaginous transition into the metaphysis. DESS is an ideal sequence for morphological assessment of growth plate cartilage that can be applied for clinical evaluation of bridging in pediatric population.9 However, similar to other conventional sequences for morphological assessment of cartilage, DESS signal is not sensitive to mineral components of the growth plate and captures regions with high proteoglycan and water content.10 Here, we showed UTE is a promising tool to capture the transitional zones of active growth in the deep layers of the growth plate. UTE-derived relaxation maps confirm the sensitivity of UTE to capture higher local T1 and T2* relaxation time at cartilaginous and osteochondral junction of the growth plate (UTE T1 and T2*) (Figure 5, A, B, C). Local changes in T1 and T2* are indicative of higher proteoglycan and collagen at and near growth plate. These findings show the potential utility of UTE to non-invasively detect regional changes in morphology and composition of the growth plate. In future, we will evaluate correlation UTE MR relaxation times and changes growth plate composition (i.e., proteoglycan and collagen content), following mechanically-induced damage to explore utility of UTE MR as an early biomarker of growth plate injury.Conclusion
Relaxometry MRI using UTE and T1/T2* relaxation maps are promising quantitative measures to capture the totality of the growth plate transition into metaphyseal bone in adolescents. We showed UTE is a promising tool to capture the transitional zones of active growth in the deep layers of the growth plate.Acknowledgements
The authors would like to thank Meat Science Laboratory at University of Illinois at Urbana-Champaign for porcine sample preparation.References
1. Eckstein F, Burstein D, Link TM. 2006. Quantitative MRI of cartilage and bone: degenerative changes in osteoarthritis. NMR in Biomedicine 19(7):822–854.
2. Chang G, Boone S, Martel D, et al. 2017. MRI Assessment of Bone Structure and Microarchitecture. J Magn Reson Imaging 46(2):323–337.
3. Crema MD, Roemer FW, Marra MD, et al. 2011. Articular cartilage in the knee: current MR imaging techniques and applications in clinical practice and research. Radiographics 31(1):37–61.
4. Kvist O, Damberg P, Dou Z, et al. 2023. Magnetic resonance and diffusion tensor imaging of the adolescent rabbit growth plate of the knee. Magnetic Resonance in Medicine 89(1):331–342.
5. Du J, Bydder GM. 2013. Qualitative and quantitative ultrashort-TE MRI of cortical bone. NMR Biomed 26(5):489–506.
6. Ma Y-J, Jerban S, Jang H, et al. 2020. Quantitative Ultrashort Echo Time (UTE) Magnetic Resonance Imaging of Bone: An Update. Frontiers in Endocrinology 11 [cited 2022 Sep 26] Available from: https://www.frontiersin.org/articles/10.3389/fendo.2020.567417.
7. Cone SG, Warren PB, Fisher MB. 2017. Rise of the Pigs: Utilization of the Porcine Model to Study Musculoskeletal Biomechanics and Tissue Engineering During Skeletal Growth. Tissue Eng Part C Methods 23(11):763–780.
8. Jung KJ, Sutton B. 2021. Three-dimensional sodium MRI using a rotation of spiral disc (RSD) trajectory.
9. Jaramillo D, Duong P, Nguyen JC, et al. 2022. Diffusion Tensor Imaging of the Knee to Predict Childhood Growth. Radiology 303(3):655–663.
10. Choi J-A, Gold G. 2011. MR Imaging of Articular Cartilage Physiology. Magn Reson Imaging Clin N Am 19(2):249–282.
Figures