2151
T2 mapping of patellar cartilage after single and first-time traumatic lateral patellar dislocation episode1Radiodiagnosis, Clinical and Research Institute of Emergency Pediatric Surgery and Trauma, Moscow, Russian Federation, 2Institute of Biochemical Physics, Russian Academy of Sciences, Moscow, Russian Federation, 3Institute of Biochemical Physics, Russian Academy of Sciences, Moscow, Moscow, Russian Federation, 4LLC Philips, Moscow, Russian Federation, 5Moscow State University, Moscow, Russian Federation
Synopsis
Keywords: MSK, Cartilage
The purpose of the study was to examine short-term consequences of the single and first-time lateral patellar displacement on patellar cartilage quality in teenagers using T2 mapping. The research showed a principal difference in T2 changes between medial and lateral cartilage facet. The medial part usually suffering first after LPD, the absence of T2 changes for the mild group may indicate completed reparative processes, while the decrease in T2 denotes that the reparation is still ongoing. T2 increase in lateral patellar regardless chondromalacia severity indicates secondary damage.Introduction
Chondromalacia is a pathology of the patella cartilage that is often initiated by patellar dislocation and has the highest prevalence in adolescent population. Patellar dislocations tend to occur in a lateral direction (lateral patellar dislocation, LPD). To diagnose a cartilage condition, magnetic resonance tomography is a preferred method as it has good visualization of soft tissues. However, the usual clinical protocol may not be sufficient for an accurate diagnostic. So new quantitative MRI (qMRI) methods could be effective alternatives. T2 mapping is a proven technique for quantifying the water content and collagen component of the cartilage extracellular matrix through the assessment of the changes in the interactions between water and collagen1-3. Most of the studies on the knee T2 mapping has been devoted to the evaluation of cartilage in osteoarthritis (OA)2,4,5. Compared with OA assessments, the robustness of T2 mapping in chondromalacia assessments has been found to be substantially lower1,6,7. The purpose of the present study is to examine short-term consequences of the first-time LPD on patellar cartilage quality in teenagers using T2 mapping.Methods
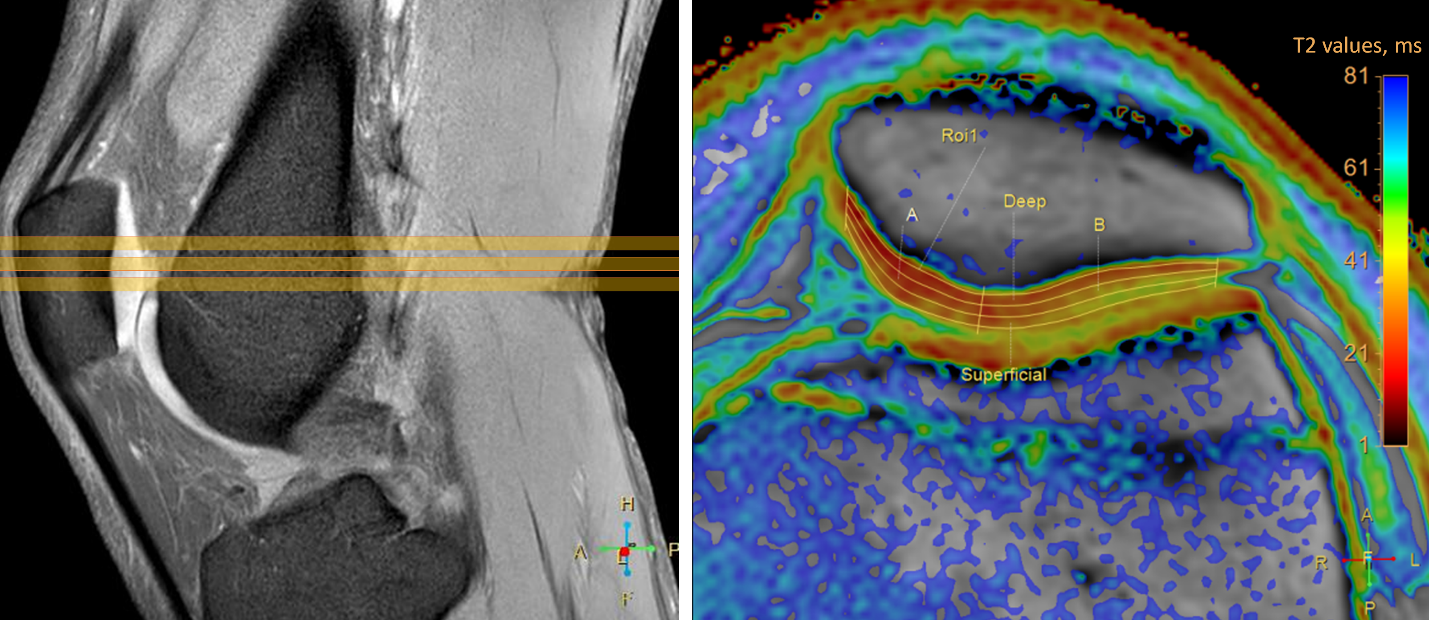
The study includes 77 patients (15.1 ± 1.8 years) with different stages of chondromalacia caused by first time LPD and 48 healthy volunteers (14.7 ± 2.2 years). All research participants underwent knee joint MRI (2-4 months after injury for patients) with Philips Achieva dStream 3T scanner (Philips Healthcare, Best, The Netherlands) and 16-chanel dStream transmit-receive knee coil. The MRI protocol included routine and scientific images. Chondromalacia grades were determined by two radiologists according to a modified Outerbridge scale using PDw SPAIR images from the routine part of protocol. The condition of patients with chondromalacia grades 1 and 2 was classified as mild, and those with grades 3 and 4 as severe. The scientific protocol part included T2 mapping (TSE, 6 TE from 13 to 78 ms, TR: 2000 ms, voxel size: 0.4×0.4×3 mm). T2 values were calculated in manually segmented cartilage area via averaging over three middle level slices in 6 cartilage regions: deep, intermediate, superficial layers and medial, lateral parts (Fig.1). To identify the difference between control, mild, and severe groups, a one-way repeated measure analysis of variance (ANOVA) was used. Tukey’s multiple comparison test was performed when statistical significance was determined through the ANOVA. The threshold of significance was set at p < 0.05. A multiclass classification models was created using One-vs-Rest (OVR) logistic regression and random forest algorithms using the scikit-learn library (0.24.2) in python.Results
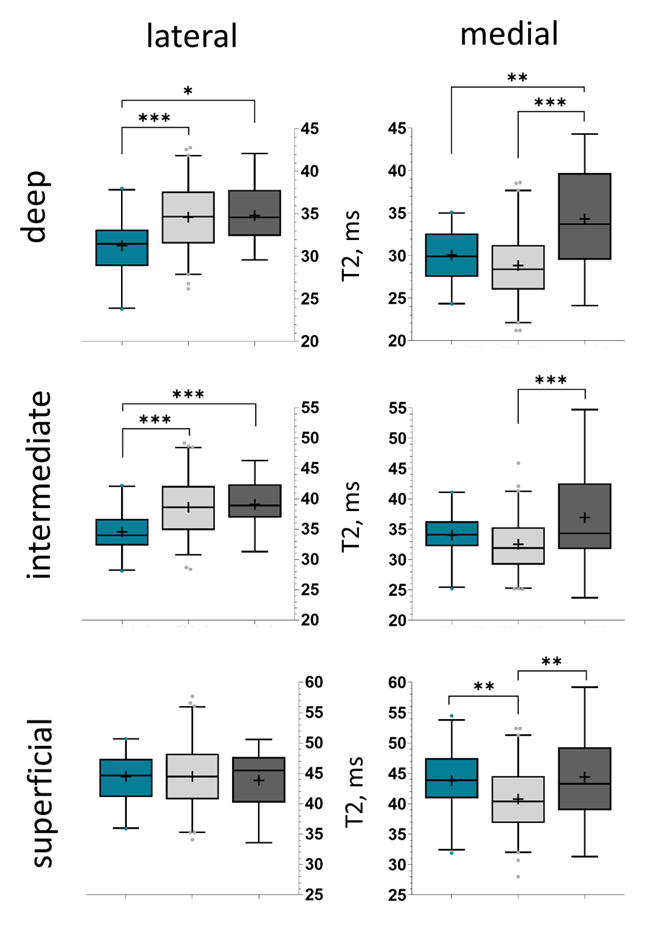
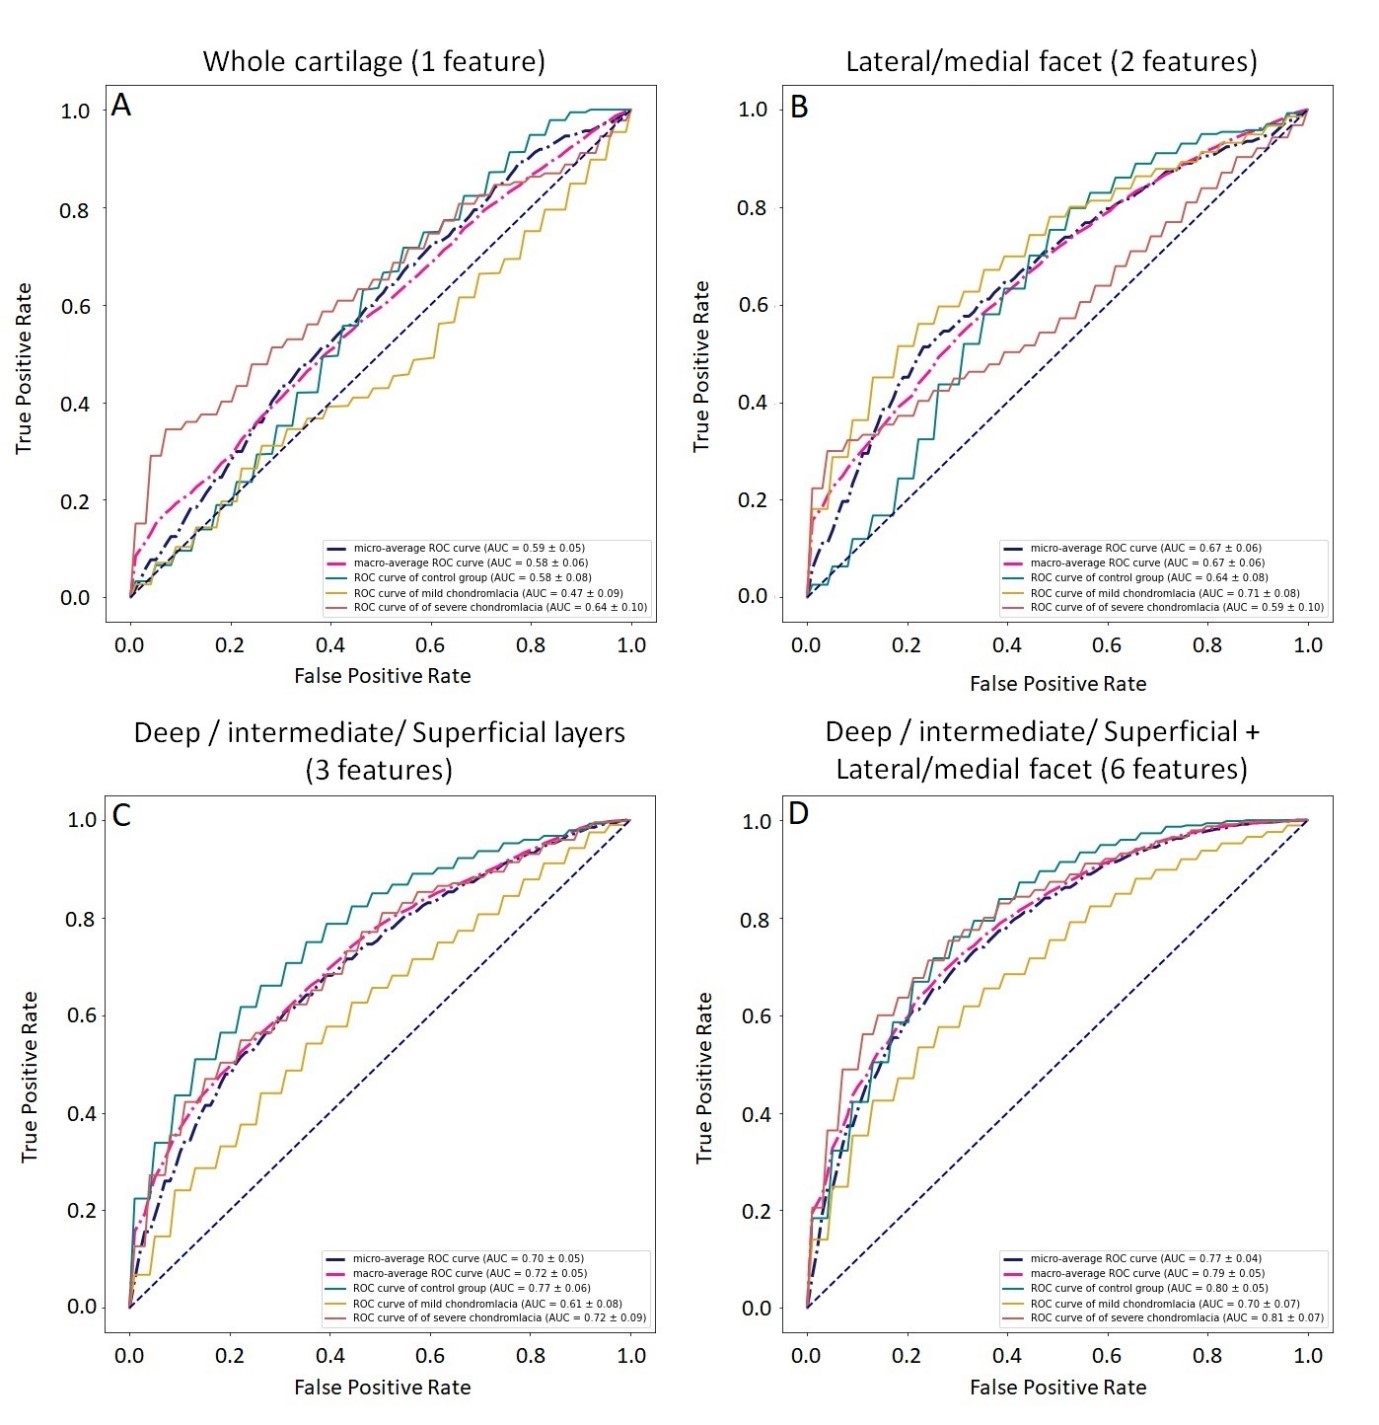
In the lateral part of the cartilage, an increase in T2 values was found for both the mild and severe chondromalacia group in the deep and intermediate layers compared to the control group. No differences were revealed for the comparison of T2 values between groups in the lateral superficial layer. In the medial part, an increase in T2 values compared to the control group is observed only for the severe group in the deep layer, while T2 in the mild chondromalacia group either doesn’t change (deep and intermediate layers) or decreases (superficial layer) (Fig.2). One vs Rest Logistic Regression showed slightly better performance as compared to Random Forest classification based on the macro-average metrics. The best classification model is the one that uses T2 from all six regions as input features compared to models that included less input features (Fig.3).Discussion
In the current study, chondromalacia patella was investigated after a single and first-time traumatic LPD episode. Our new findings showed a principal difference in T2 changes between medial and lateral cartilage facet. While T2 values rise with increasing damage in the deep and intermediate layers of lateral part for mild and severe groups, they tend to decrease in the medial part for mild chondromalacia. The increase in T2 is likely associated with matrix damage. The loss of collagen integrity leads to heightened matrix permeability, an increase in the content and motion of water, and, therefore, to prolonged T2 times8. Mechanics of the LPD is characterized by contusion of the medial patella at the lateral femoral condyle, thus the medial part usually suffers first after LPD whereas lateral compartment lesions appear at later stages. So elevated T2 values are most likely an indirect consequence of the injury through the metabolic problems and additional loading due to medial patellofemoral ligament injury. Unchanged or reduced T2 may indicate the presence of processes that compensate for the increase in relaxation time. The possible processes are altered biomechanics, dehydration and loss of capacity to retain water. In addition, reparative processes can lead to T2 decrease9. Thus, the absence of T2 changes for the mild group in medial facet may indicate completed reparative processes, while the decreased T2 indicates that the reparation is still ongoing. Interpretation of severe consequences of LPD in the medial deep and intermediate zones is less clear. The wide intragroup variation indicates that manifestation of the processes may vary greatly in time of onset after injury.Conclusion
Principal difference in T2 changes between medial and lateral patellar cartilage areas revealed in our study is a result of the LPD traumatic mechanism – primary medial patella contusion with the signs of recovery processes and secondary damage of lateral facet.Acknowledgements
This work is supported by RSF 21-75-00068 grantReferences
1. van Eck CF, Kingston RS, Crues J V, Kharrazi FD. Magnetic Resonance Imaging for Patellofemoral Chondromalacia: Is There a Role for T2 Mapping? Orthop. J. Sport. Med. 2017;5(11):325967117740554
2. Soellner ST, Goldmann A, Muelheims D, et al. Intraoperative validation of quantitative T2 mapping in patients with articular cartilage lesions of the knee. Osteoarthr. Cartil. 2017;25(11):1841–1849.
3. Waldenmeier L, Evers C, Uder M, et al. Using Cartilage MRI T2-Mapping to Analyze Early Cartilage Degeneration in the Knee Joint of Young Professional Soccer Players. Cartilage. 2019;10(3):288–298.
4. Dunn TC, Lu Y, Jin H, et al. T2 relaxation time of cartilage at MR imaging: comparison with severity of knee osteoarthritis. Radiology. 2004;232(2):592–598.
5. Alsayyad MAI, Ali Shehata KA, Khattab RT. Role of adding T2 mapping sequence to the routine MR imaging protocol in the assessment of articular knee cartilage in osteoarthritis. Egypt. J. Radiol. Nucl. Med. 2021;52(1):1–9.
6. Ruiz Santiago F, Pozuelo Calvo R, Almansa López J, Guzmán Álvarez L, Castellano García MDM. T2 mapping in patellar chondromalacia. Eur. J. Radiol. 2014;83(6):984–988.
7. Rehnitz C, Kupfer J, Streich NA, Burkholder I, Schmitt B, Lauer L, et al. Comparison of biochemical cartilage imaging techniques at 3 T MRI. Osteoarthr. Cartil. 2014;22(10):1732–1742.
8. Mosher T, Dardzinski B. Cartilage MRI T2 relaxation time mapping: overview and applications. Semin. Musculoskelet. Radiol. 2004;8(4):355–368.
9. Welsch GH, Mamisch TC, Weber M, Horger W, Bohndorf K, Trattnig S. High-resolution morphological and biochemical imaging of articular cartilage of the ankle joint at 3.0 T using a new dedicated phased array coil: in vivo reproducibility study. Skeletal Radiol. 2008;37:519–526
Figures