2150
Magnetic resonance and diffusion tensor imaging of the adolescent rabbit growth plate of the knee1Karolinska Institute, Stockholm, Sweden, 2Blekinge Institute of Technology, Stockholm, Sweden, 3Lunds University, Malmö, Sweden, 4Örebro University, Örebro, Sweden
Synopsis
Keywords: Cartilage, Diffusion Tensor Imaging
The hindlimbs of female rabbits aged 16, 20, and 24 weeks were studied in a 9.4T MRI scanner to assess the ability of MRI-DTI to evaluate growth plate morphology and activity compared with that of histomorphometry and micro-computed tomography (μCT) in rabbits. The MRI sequences included a multi-gradient echo 3D sequence and DTI in 14 directions (b-value= 984 s/mm2). The growth plate height and volume were similar for all modalities at each time point and age. Tract number and volume declined with age; however, tract length did not show any changes. MRI-DTI may be useful for evaluating the growth plates.Introduction:
Longitudinal growth occurs at the growth plate, a cartilaginous structure located between the metaphysis and epiphysis of long bones. As a final step in the senescence process, the growth plate undergoes epiphyseal fusion 1. In humans and some mammals, including rabbits, epiphyseal fusion occurs during sexual maturation 2,3. The purpose of the study was to use MRI settings that can be clinically applied to validate MRI findings in the growth plate of rabbits of different ages compared to histomorphometry and μCT. A secondary aim was to link MRI-DTI findings with histology, thereby proving that DTI depicted the activity of the growth plate.Methods:
The hindlimbs of female rabbits aged 16, 20, and 24 weeks (n=4 per age group) were studied using a 9.4T MRI scanner with a multi-gradient echo 3D sequence and DTI in 14 directions (b-value= 984 s/mm2). After MRI, the right and left hindlimb were processed for histological analysis and μCT, respectively. The Wilcoxon signed-rank test was used to evaluate the height and volume of the growth plate. Intraclass correlation and Pearson’s correlation coefficient were used to evaluate the association between DTI metrics and age.Results:
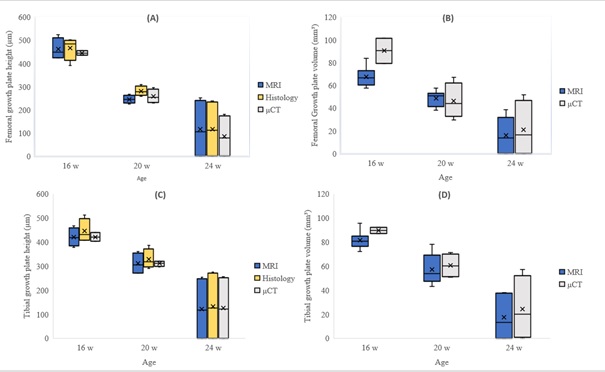
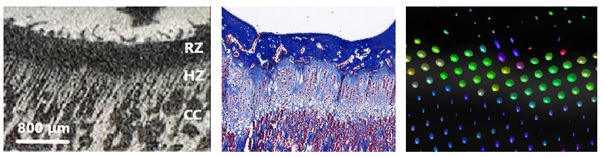
The growth plate height and volume were similar for all modalities at each time point and age (Figure 1). Age was correlated with all tractography and DTI metrics in both the femur and tibia. A correlation was also observed between all the metrics at both sites. Tract number and volume declined with age; however, tract length did not show any changes. The FA color map showed lateral diffusion centrally in the growth plate and perpendicular diffusion in the hypertrophic zone, as verified by histology and μCT (Figure 2).Discussion:
Discussion: This is the first paper to demonstrate the assessment of a growth plate stratified by age using MRI-DTI, μCT, and histology. Correlations between the different modalities were significant, and DTI provided additional information about the growth potential of the physes. We used a multi-gradient echo 3D sequence to assess growth plate height and volume and found that it performed equal to the other modalities. Our study supports the findings of Wada et al., who used Japanese white rabbits to evaluate the tibial growth plate after physeal injuries using PD-weighted sequences 4. Additionally, we observed a correlation of height measurements between MRI using multi-gradient echo 3D sequence and histomorphometry. The brush-like appearance of the transitional zone between the growth plate and the metaphysis seen on μCT raises the questions if this is what we see on tractography (Figure 2). The histological samples verified that the brush-like structure was a hypertrophic zone caused by the process of osteogenesis with columnar hypertrophic chondrocytes 5. Previous studies have demonstrated that the height of the hypertrophic and proliferative zones increases during periods of increased growth velocity and that linear growth can be expressed as Growth= N * hmax 6 (Growth is the 24 h growth in μm; N is the number of chondrocytes created each day in the proliferative zone; hmax is the average height of fully mature chondrocytes (μm) in the hypertrophic zone). Similar patterns in the articular and physeal cartilage have been described in experimental DTI studies in rats7,8 as well in human cartilage 9. Tractography and DTI metrics showed the same trends in both the femoral and tibial growth plates regarding tract number, volume, MD, AD, and RD. The tibial FA value increased over time, while the femoral FA value reached a plateau. We believe that this finding is a result of earlier closure of the femoral growth plate compared to that of the tibial plate. The MD, AD, and RD values decreased with age and had strong (P<0.001) correlations with each other, indicating that they were interchangeable. Diffusion tractography is sensitive to the b-value, but it has been demonstrated that both DTI metrics and tractography seem to reach a plateau when the b-value is higher than 750 s/mm² 7. Therefore, we considered the b-value in our study to be adequate.Conclusion:
To the best of our knowledge, this is the first study to visualize the growth plate using μCT, MRI-DTI, and histology at different ages. This study validates the use of MRI as a non-ionizing and non-invasive diagnostic tool to evaluate the growth plate in clinical settings, with no significant difference compared with histomorphometry and μCT. MRI-DTI can be used as a tool to indirectly visualize the activity and growth potential of the growth plate, although this method is still under development. Furthermore, we believe that the combination of μCT and histomorphometry confirms that DTI depicts the area of the growth plate involved in osteogenesis, that is, growth velocity. However, further studies in both humans and animals are required to validate these results.Acknowledgements
MRI experiments were performed at the Karolinska Experimental Research and Imaging Centre.
μCT data acquisition was supported by a grant from the Stockholm University Brain Imaging Centre (SU FV-5.1.2-1035-15).
References
1. Nilsson O, Baron J. Fundamental limits on longitudinal bone growth: growth plate senescence and epiphyseal fusion. Trends Endocrinol Metab. 2004;15(8):370-374.
2. Nilsson O, Weise M, Landman EB, Meyers JL, Barnes KM, Baron J. Evidence that estrogen hastens epiphyseal fusion and cessation of longitudinal bone growth by irreversibly depleting the number of resting zone progenitor cells in female rabbits. Endocrinology. 2014;155(8):2892-2899.
3. Stevenson P. Age order of epiphyseal union in man. Am J Phys Anthropol. 1924(7):53–93.
4. Wada H, Ikoma K, Oka Y, et al. Status of growth plates can be monitored by MRI. Journal of magnetic resonance imaging : JMRI. 2020;51(1):133-143.
5. Butler TA, Yingling VR. The effects of delayed puberty on the growth plate. J Pediatr Orthop. 2013;33(1):99-105.
6. Stokes IA, Clark KC, Farnum CE, Aronsson DD. Alterations in the growth plate associated with growth modulation by sustained compression or distraction. Bone. 2007;41(2):197-205.
7. Wang N, Mirando AJ, Cofer G, Qi Y, Hilton MJ, Johnson GA. Diffusion tractography of the rat knee at microscopic resolution. Magn Reson Med. 2019;81(6):3775-3786.
8. 1Zhao Q, Ridout RP, Shen J, Wang N. Effects of Angular Resolution and b Value on Diffusion Tensor Imaging in Knee Joint. Cartilage. 2021;13(2_suppl):295S-303S.
9. Pierce DM, Trobin W, Raya JG, et al. DT-MRI based computation of collagen fiber deformation in human articular cartilage: a feasibility study. Ann Biomed Eng. 2010;38(7):2447-2463.
Figures