2140
Using MR Elastography in the Assessment of Low-Grade Fibrosis of Pediatric Kidney Transplant Recipients.
Suraj D Serai1,2, Hansel J Otero1,2, Tatiana Morales-Tisnes1, Mohamed M Elsingergy1, Tricia Bhatti1, and Bernarda Viteri1
1Children's Hospital of Philadelphia, Philadelphia, PA, United States, 2Radiology, University of Pennsylvania, Philadelphia, PA, United States
1Children's Hospital of Philadelphia, Philadelphia, PA, United States, 2Radiology, University of Pennsylvania, Philadelphia, PA, United States
Synopsis
Keywords: Kidney, Elastography, transplant
MRE can propagate shear waves which can provide better estimates of stiffness of smaller and deeper structures. Here, we found a positive correlation between kidney elasticity and the presence of histological fibrosis where stiffness values tended to be higher in fibrosed allografts than stable or native kidneys. If clinically approved, elastography would not only be useful for early detection of interstitial fibrosis and tubular atrophy in renal transplants, which would individualize the need for immunosuppression therapy, but could also be used as a screening tool to evaluate fibrosis in potential donors to identify best candidates prior to the transplantation procedure.Purpose
Non-invasive imaging markers of kidney allograft fibrosis remain understudied in the pediatric population. One of the major determinants for kidney allograft failure is the development of interstitial fibrosis and tubular atrophy (IFTA). This study investigates MR elastography as a quantitative MRI marker for the evaluation of early fibrosis (IFTA) in pediatric patients with transplanted kidneys.Methods
A prospective study of pediatric kidney transplant recipient patients undergoing clinically indicated biopsy and healthy controls, was performed. Eligible patients underwent kidney MR elastography (MRE) (Figures 1 and 2). MRE was performed on a 3 Tesla MR scanner (Siemens Healthineers, Malvern, PA) equipped with MRE hardware consisting of an active-passive driver system. Shear wave images were generated by obtaining multiple slices through the kidney(s). A 2D spin-echo planar MRE (SE-EPI) sequence was used to acquire coronal wave images with the following parameters: repetition time (TR)/echo time (TE), 1000 ms/30 ms; continuous sinusoidal vibration, 60 Hz; field of view, 32–42 cm; matrix size, 100 × 100; flip angle, 30°; section thickness, 6 mm; 4 evenly spaced phase offsets; acceleration factor of 2; and 4 pairs of 60-Hz trapezoidal motion encoding gradients with zeroth and first moment nulling along the through-plane direction. All processing steps were applied automatically without manual intervention to yield quantitative images of tissue shear stiffness in kilopascals. Stiffness maps (elastograms) were produced automatically by the scanner software, including 95% confidence maps indicating areas of good wave propagation. On each section of the image on MRE, regions of interest (ROIs) were manually drawn on the elastograms within regions bound by the confidence maps, which included the maximal amount of renal parenchyma in each slice, while avoiding the edges and large vessels. The mean measurements of 4 slices was used. The mean stiffness (in kPa) and area (in cm2) of each slice were calculated and recorded. Overall mean stiffness of the kidney was calculated as the average of stiffness measurements from each slice, weighted by the ROI area of each slice. Biopsy procedures were performed by the pediatric nephrology team. One to three cores of the lower pole were obtained using 16 or 18-gauge needles (Bard Magnum, Covington, GA, USA). Specimens were embedded in paraffin. Paraffin blocks were sliced in 3 μm samples and then stained with hematoxylin & eosin, periodic acid-Schiff (PAS), trichrome Masson stain, and methenamine silver stains. The severity of interstitial fibrosis and tubular atrophy (IFTA was graded according to Banff 2017); Grade 0 = 0 to 5% (also referred to as “stable allografts”), Grade 1 = 6-24%, Grade 2=25-49%, and Grade 3 = ≥50%. A comparative analysis among three groups of subjects: IFTA positive allografts, "stable" allografts, and healthy controls, using one-way ANOVA was performed.Results
10 transplant recipients (8 males and 2 females) and 8 controls (2 males and 6 females) were enrolled. Median age was 16 years, IQR (12.5-18) for transplant recipients and 16.5 years (13.5-19 years) for controls. 5 of the 10 transplant recipients (50%) received allografts from deceased donors. Three transplant recipients had “stable” allografts with no IFTA on pathology and 7 had Banff Grade 1 (G1) IFTA. Among these 7 IFTA allografts, one had acute antibody mediated rejection and one had borderline T-cell mediated rejection; the rest did not show evidence of rejection on histology. Time from transplantation to allograft biopsy ranged from 2 weeks to 6 years. No complication was reported following any of the biopsy procedures performed. Representative images of MRE stiffness maps with color coded spectrums are illustrated in Figure 1. We found that the mean stiffness of IFTA allografts (5.6 kPa) was significantly higher than stable allografts (4.4 kPa, p=0.040) and controls (3.6 kPa, p=0.010) (Figure 3). The mean stiffness of stable allografts was significantly higher than controls (p=0.024 for MRE). The ROC analysis for elastography modalities to predict the presence of fibrosis in transplanted kidneys yielded high AUC curves for MRE (AUC = 0.89; 95% CI 0.65 – 1) (Figure 4). The optimal stiffness cut-off value for MRE to predict kidney transplant fibrosis was 4.6 kPa.Conclusion
In this pilot study, our results show that MRE has the potential to be utilized as non-invasive tools for quantitative measurement of the degree of fibrosis in renal allografts with a strong correlation with histopathology. MRE showed significant difference among the groups when evaluating IFTA. Ongoing investigation using larger sample sizes and modified imaging protocols may still be needed to ultimately ascertain if these new imaging biomarkers can be clinically validated as screening tools for early detection of renal pathology post-transplantation.Acknowledgements
No acknowledgement found.References
No reference found.Figures
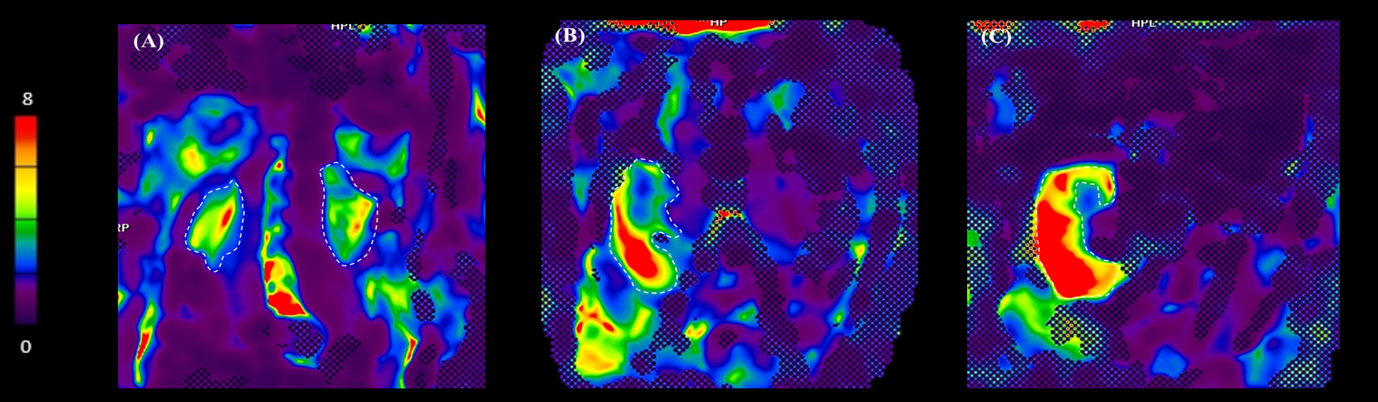
Representative MRE renal stiffness maps
shown for (A) a 9-year-old
female healthy control participant, (B) a 12-year-old female patient with stable allograft, and (C) a
12-year-old male patient with Grade 1
IFTA allograft.
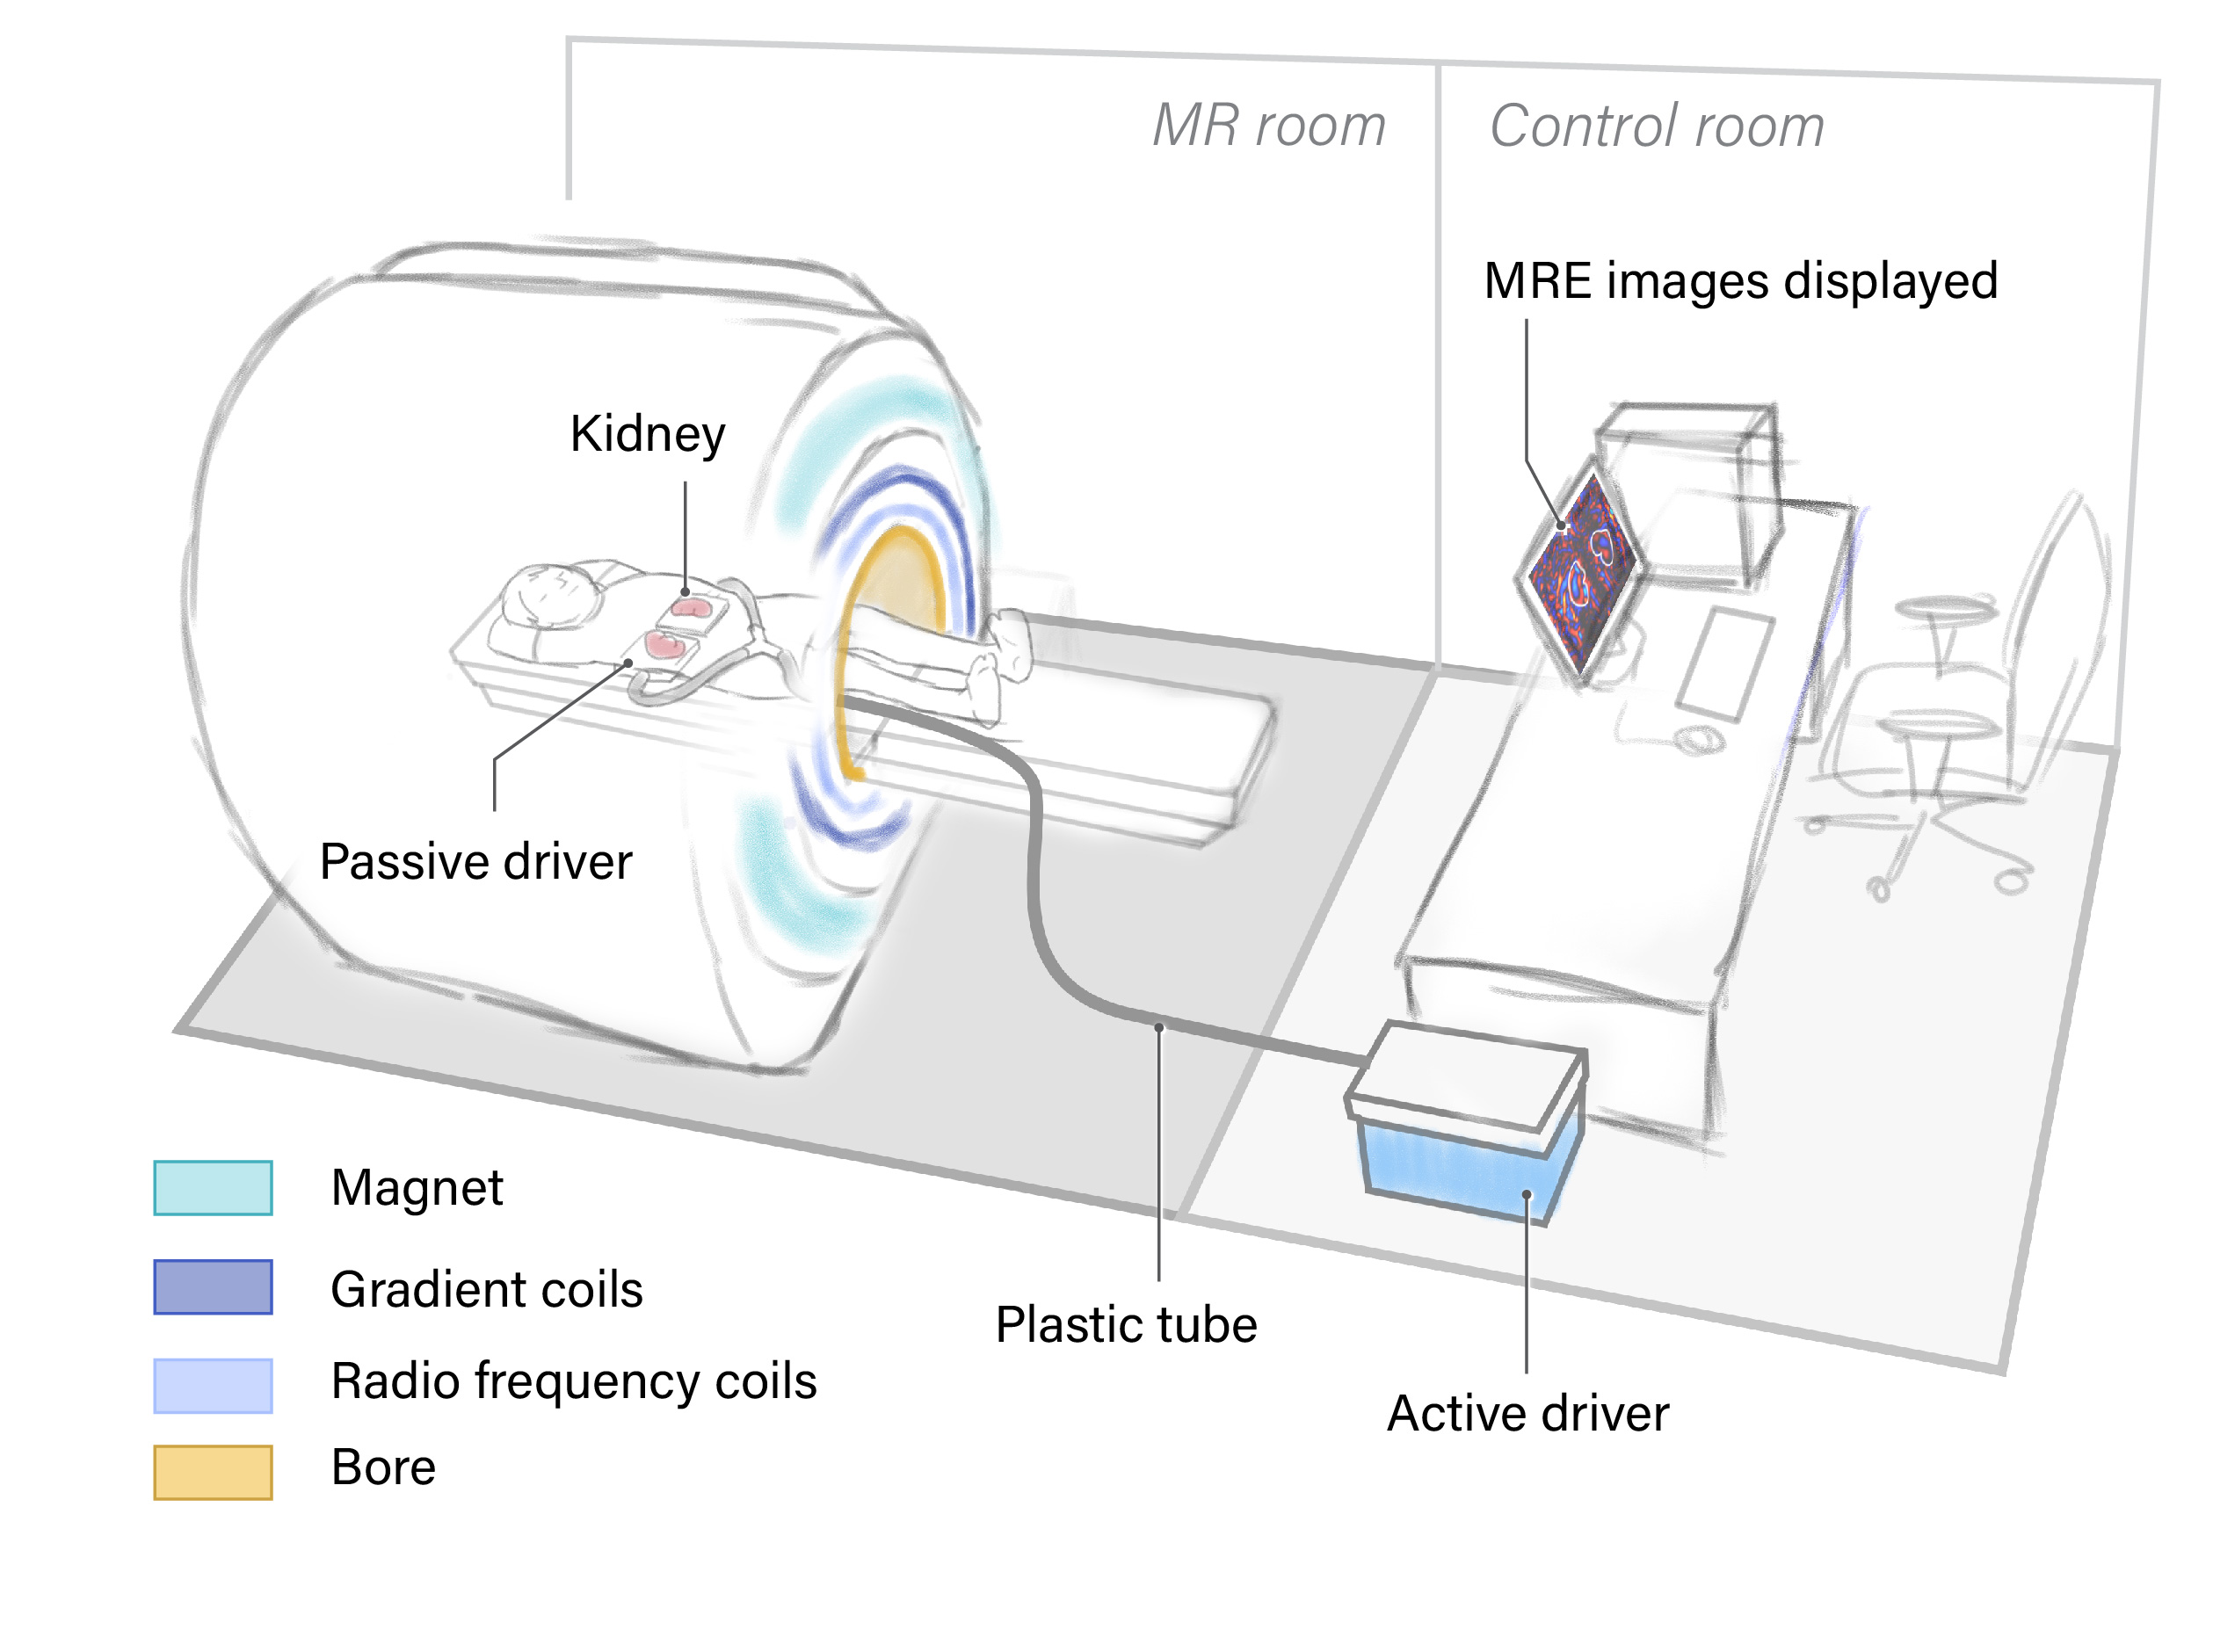
Schematic of kidney MRE paddle positioning. The passive driver is
positioned posteriorly to be relatively closer to the kidney from the dorsal
side. A Y-shaped splitter is used to position 2 paddles in parallel under both
kidneys. For patients with single allograft kidney, the Y-shaped paddle is
replaced with a single conventional paddle.
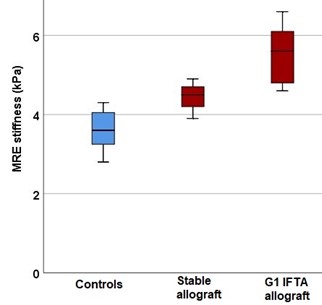
Box and whisker plot
showing mean of MRE stiffness values (in kPa) for healthy controls, stable
allografts, and Grade 1 IFTA allografts.
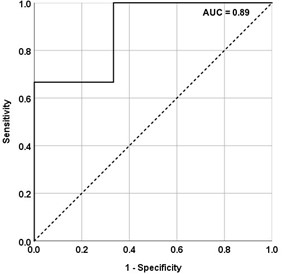
ROC curve showing sensitivity and specificity of
MRE stiffness values in differentiating stable from fibrosed allografts among transplant
recipients. Cut-off values: MRE 4.6 kPa
DOI: https://doi.org/10.58530/2023/2140