2132
Autopsy-based radio-pathomic maps of tumor probability delineate tumor presence within radiological segmentations1Radiology, Medical College of Wisconsin, Milwaukee, WI, United States, 2Biophysics, Medical College of Wisconsin, Milwaukee, WI, United States, 3Neurology, Medical College of Wisconsin, Milwaukee, WI, United States, 4Pathology, Medical College of Wisconsin, Milwaukee, WI, United States, 5Neurosurgery, Medical College of Wisconsin, Milwaukee, WI, United States, 6Biostatistics, Medical College of Wisconsin, Milwaukee, WI, United States, 7Biomedical Engineering, Medical College of Wisconsin, Milwaukee, WI, United States
Synopsis
Keywords: Tumors, Cancer, Machine learning, glioblastoma, radio-pathomics
This study applied autopsy-based radio-pathomic maps to the pre-surgical PENN-GBM dataset to test the hypothesis that the predicted tumor composition of the contrast-enhancing and FLAIR-hyperintense regions identify distinct pathological features of glioblastoma. We find that greater predicted tumor within the contrast-enhancing region is indicative of IDH1-wildtype mutation status, and show that larger tumors tend to have less predicted tumor within contrast-enhancement and more tumor within non-enhancing FLAIR hyperintensity. This technique could be used to non-invasively identify more aggressive tumors.Introduction
Multi-parametric MRI is currently used to monitor glioblastoma in the clinical setting. Post-contrast T1-weighted imaging is used to identify the primary tumor mass, with T2-weighted fluid attenuated inversion recovery (FLAIR) hyperintensity thought to contain a non-specific mixture of active tumor and edema. Our previous work developed radio-pathomic maps of tumor probability using autopsy tissue samples as ground truth, which allows for non-invasive visualization of tumor outside the contrast-enhancing region1,2. This study applied our radio-pathomic maps to a large, radiologically-annotated dataset (PENN-GBM) to test the hypothesis that the predicted tumor composition of the contrast-enhancing and FLAIR-hyperintense regions identifies distinct pathological features of glioblastoma.Methods
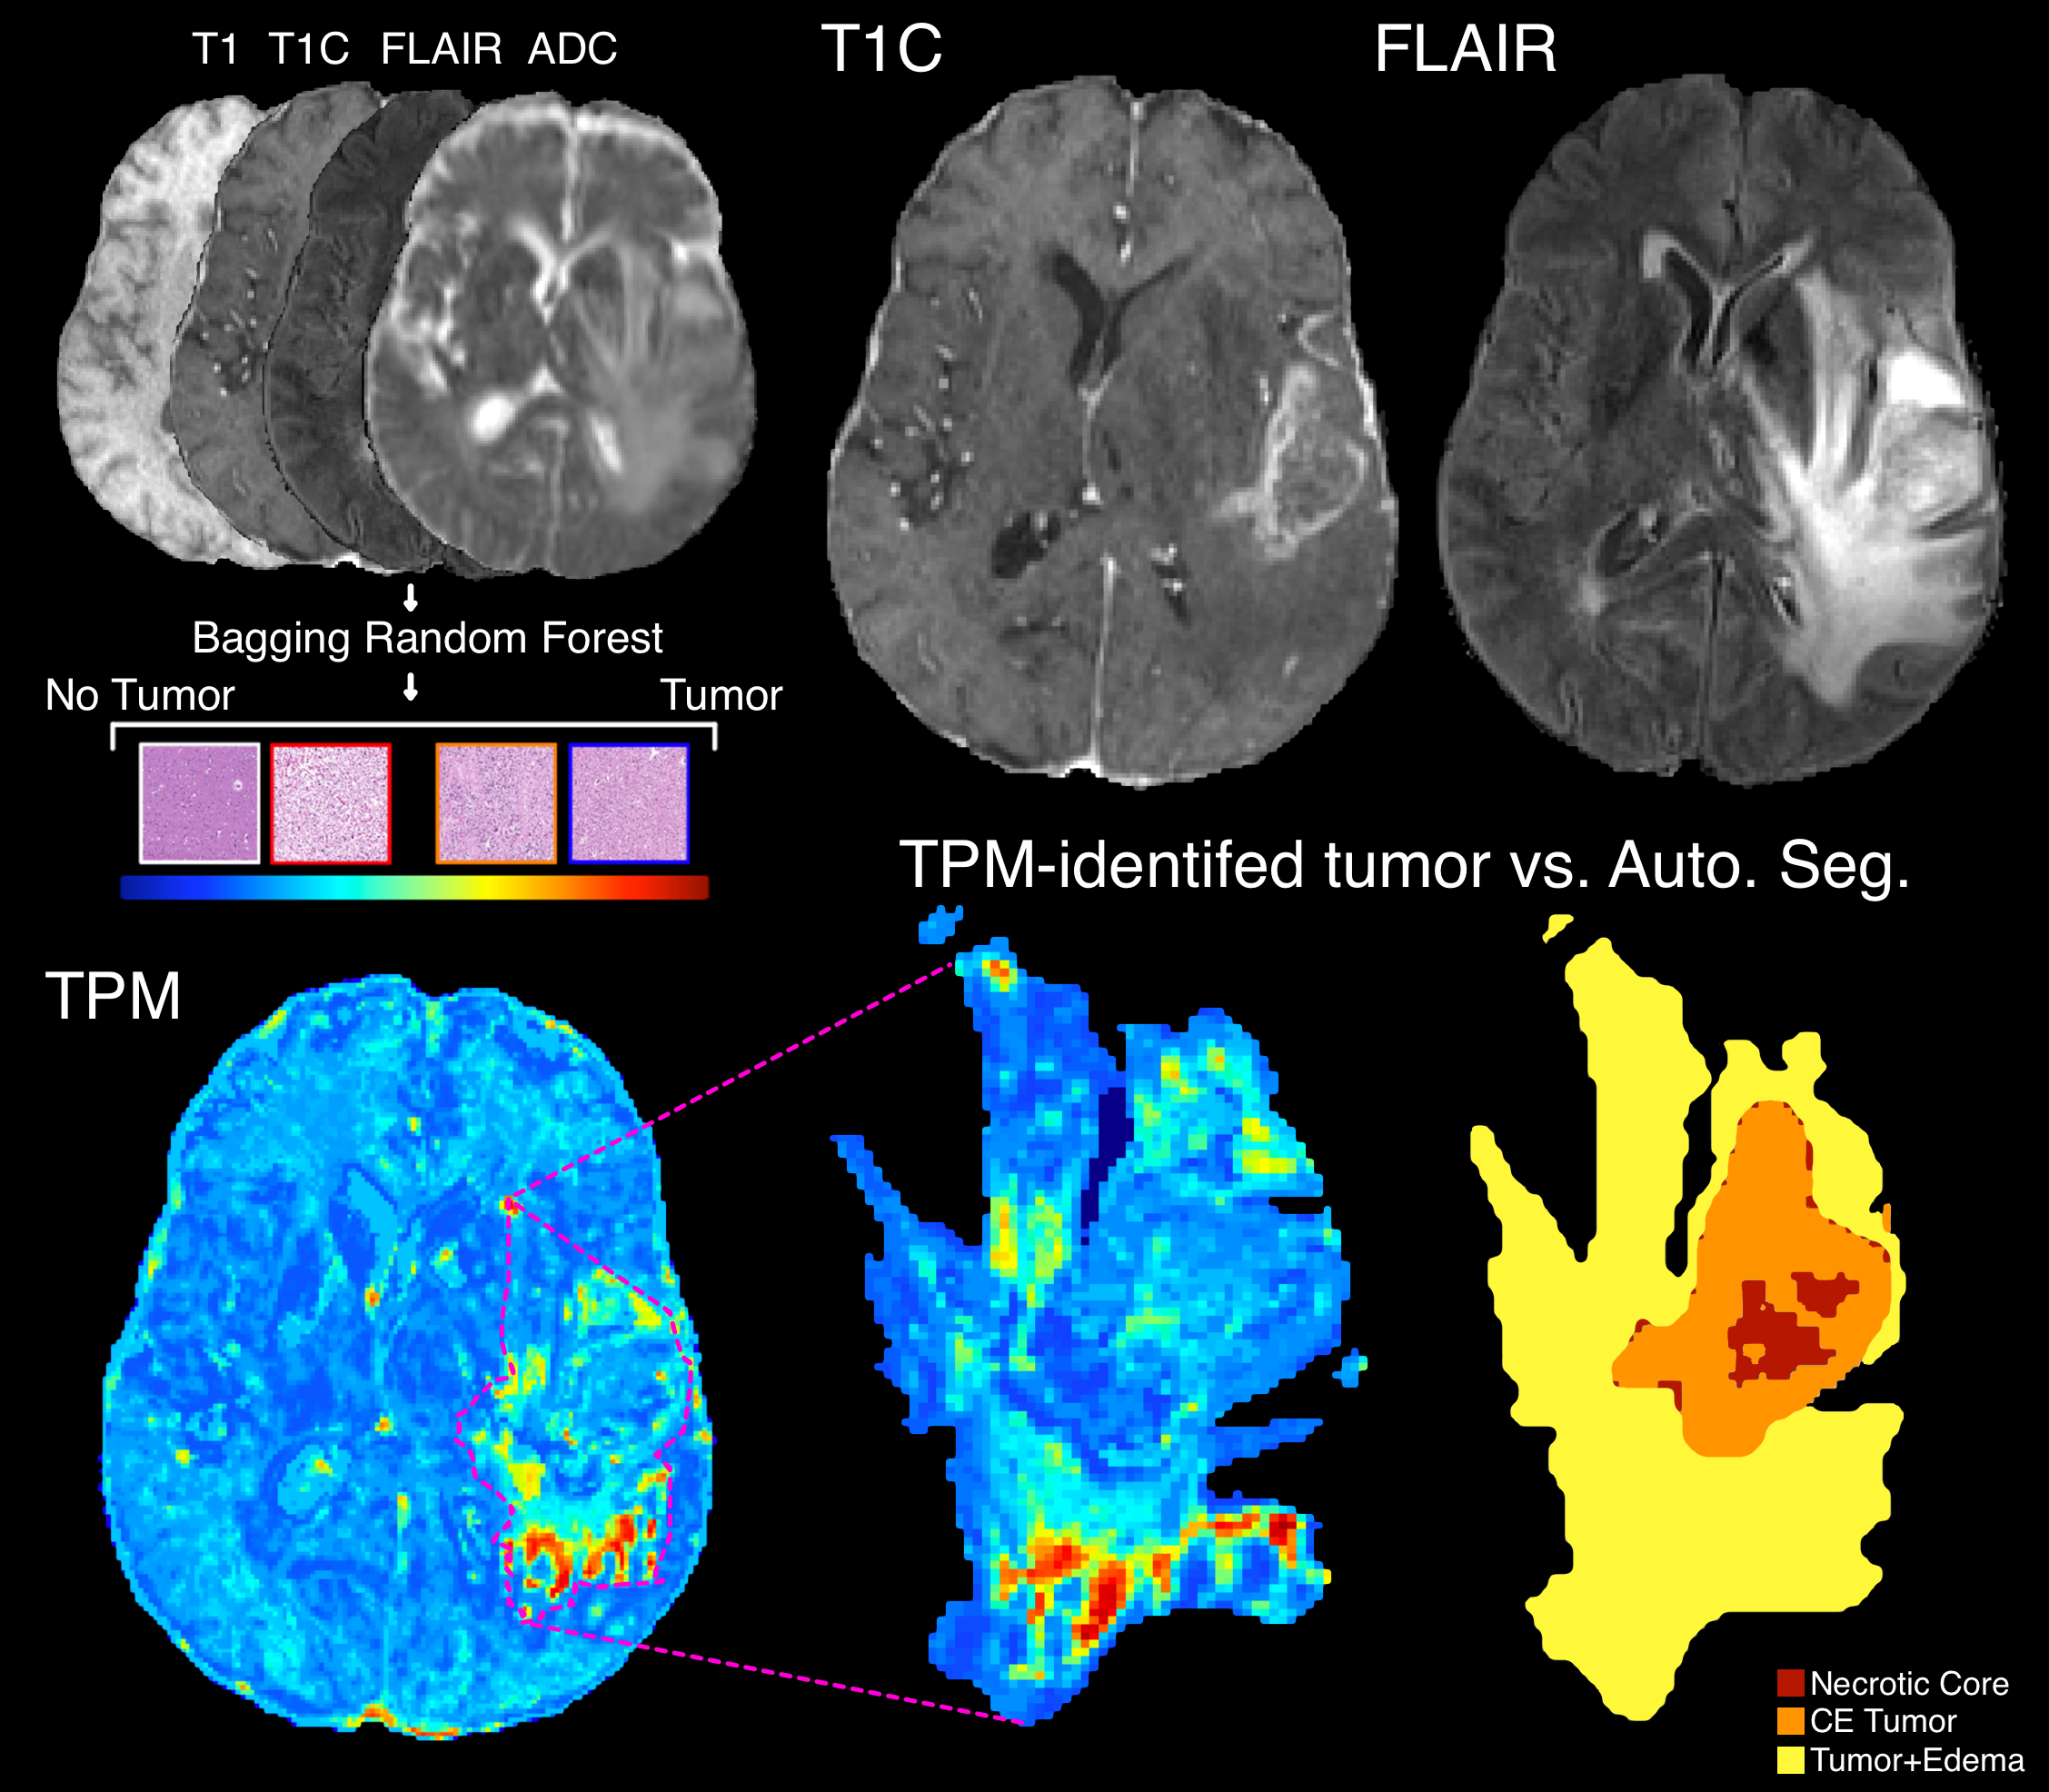
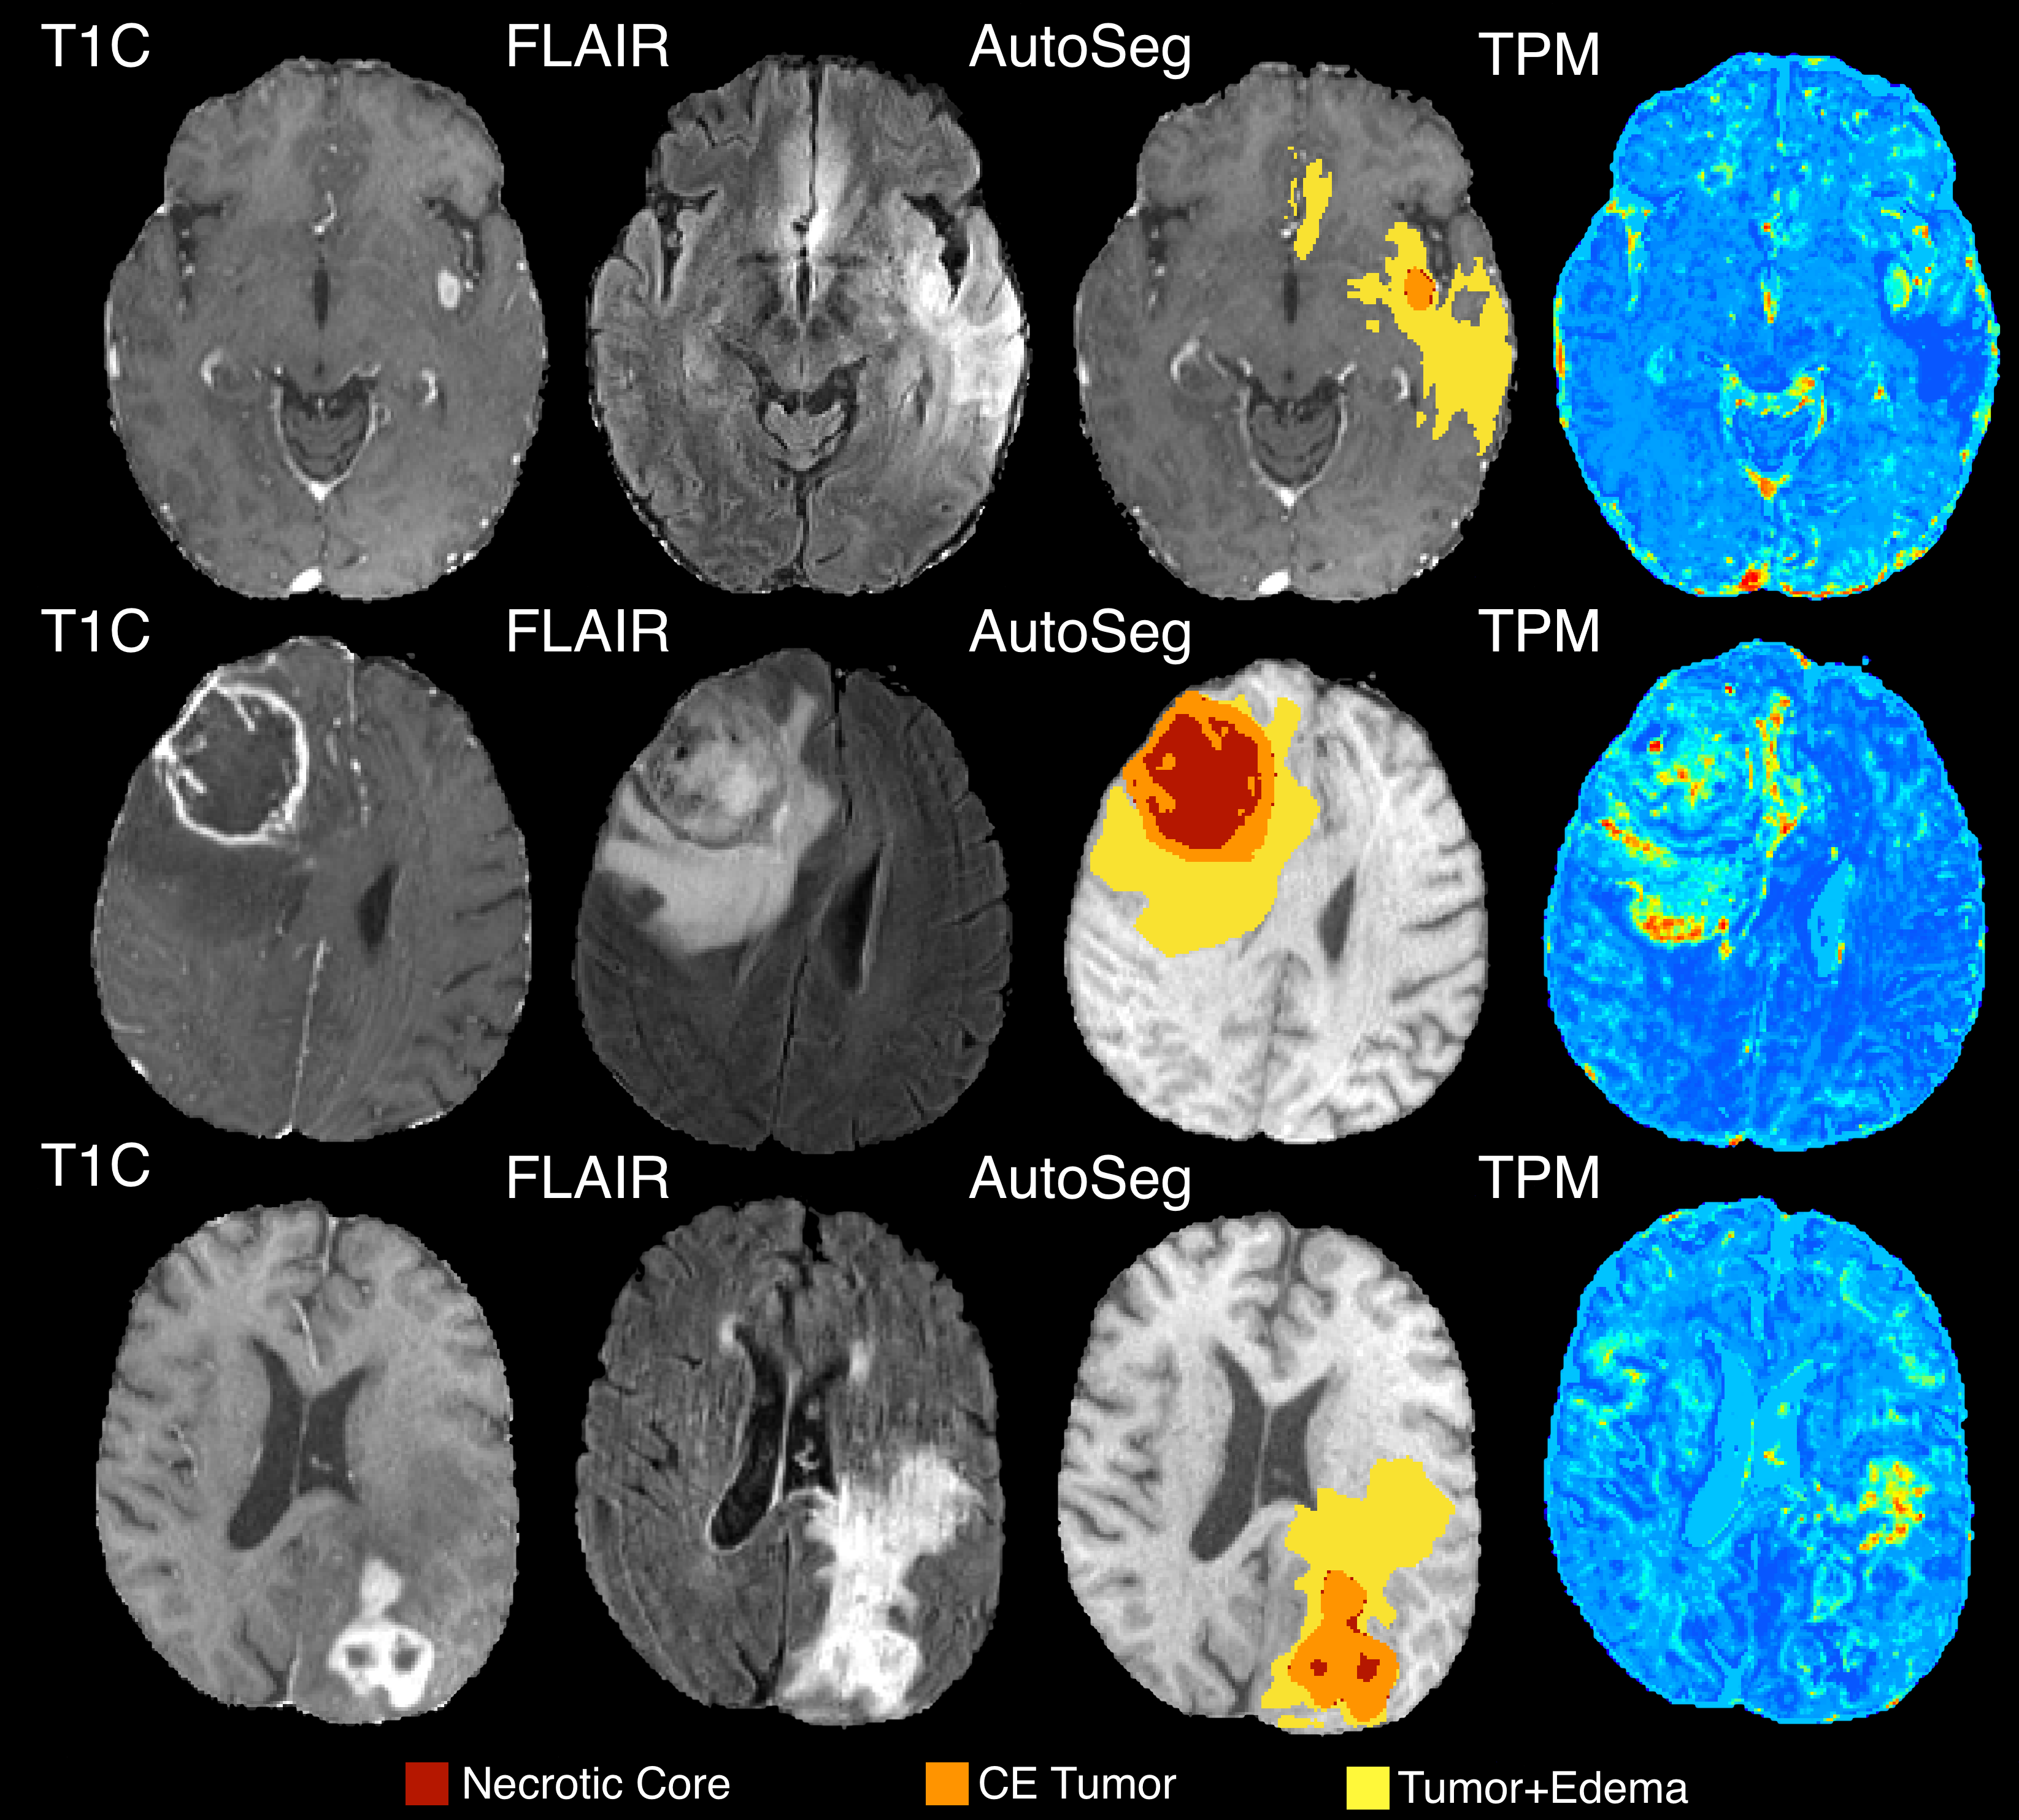
The methodology used to generate the radio-pathomic models included in this study has been previously published1,2. Briefly, pre- and post-contrast T1-weighted images (T1, T1C), T2-weighted FLAIR images, and apparent diffusion coefficient (ADC) images were used as input to predict cellularity, extracellular fluid density, cytoplasm density, and tumor probability using tissue samples aligned to the last clinical imaging prior to death as ground truth. A training dataset of 43 patients was used to train a bagging regression ensemble using 5 by 5 voxel tiles from the MRI as input and voxel-wise pathological characteristics as labels, with a held-out test set of 22 subjects used for model validation. These models reliably identify pathologically confirmed tumor beyond the contrast enhancing region, making them particularly valuable for probing the tumor composition of the FLAIR hyperintense region. Tumor probability maps (TPM) were then generated for 362 patients from the publicly available PENN-GBM dataset3, which includes standard imaging acquisitions coupled with automated segmentations for the necrotic core (NC), contrast-enhancing lesion (CE tumor), and FLAIR hyperintense region of mixed tumor and edema (tumor+edema). These annotations simulate regions drawn by a radiologist and were used in this study to delineate the compartments of radiologically visible tumor. A latent space cutoff (0.7) was used to threshold tumor probability maps to generate TPM-identified tumor regions of interest, and the proportion of TPM-identified tumor within the tumor+edema and CE tumor annotations were computed for each subject (Figure 1). Proportion of tumor within each annotation class was then compared to IDH1 mutation status, a genetic signature associated with longer overall survival, using a two-sample t-test. Additionally, Pearson correlations were computed to assess the association between the CE tumor volume and the proportion of tumor within each annotation.Results
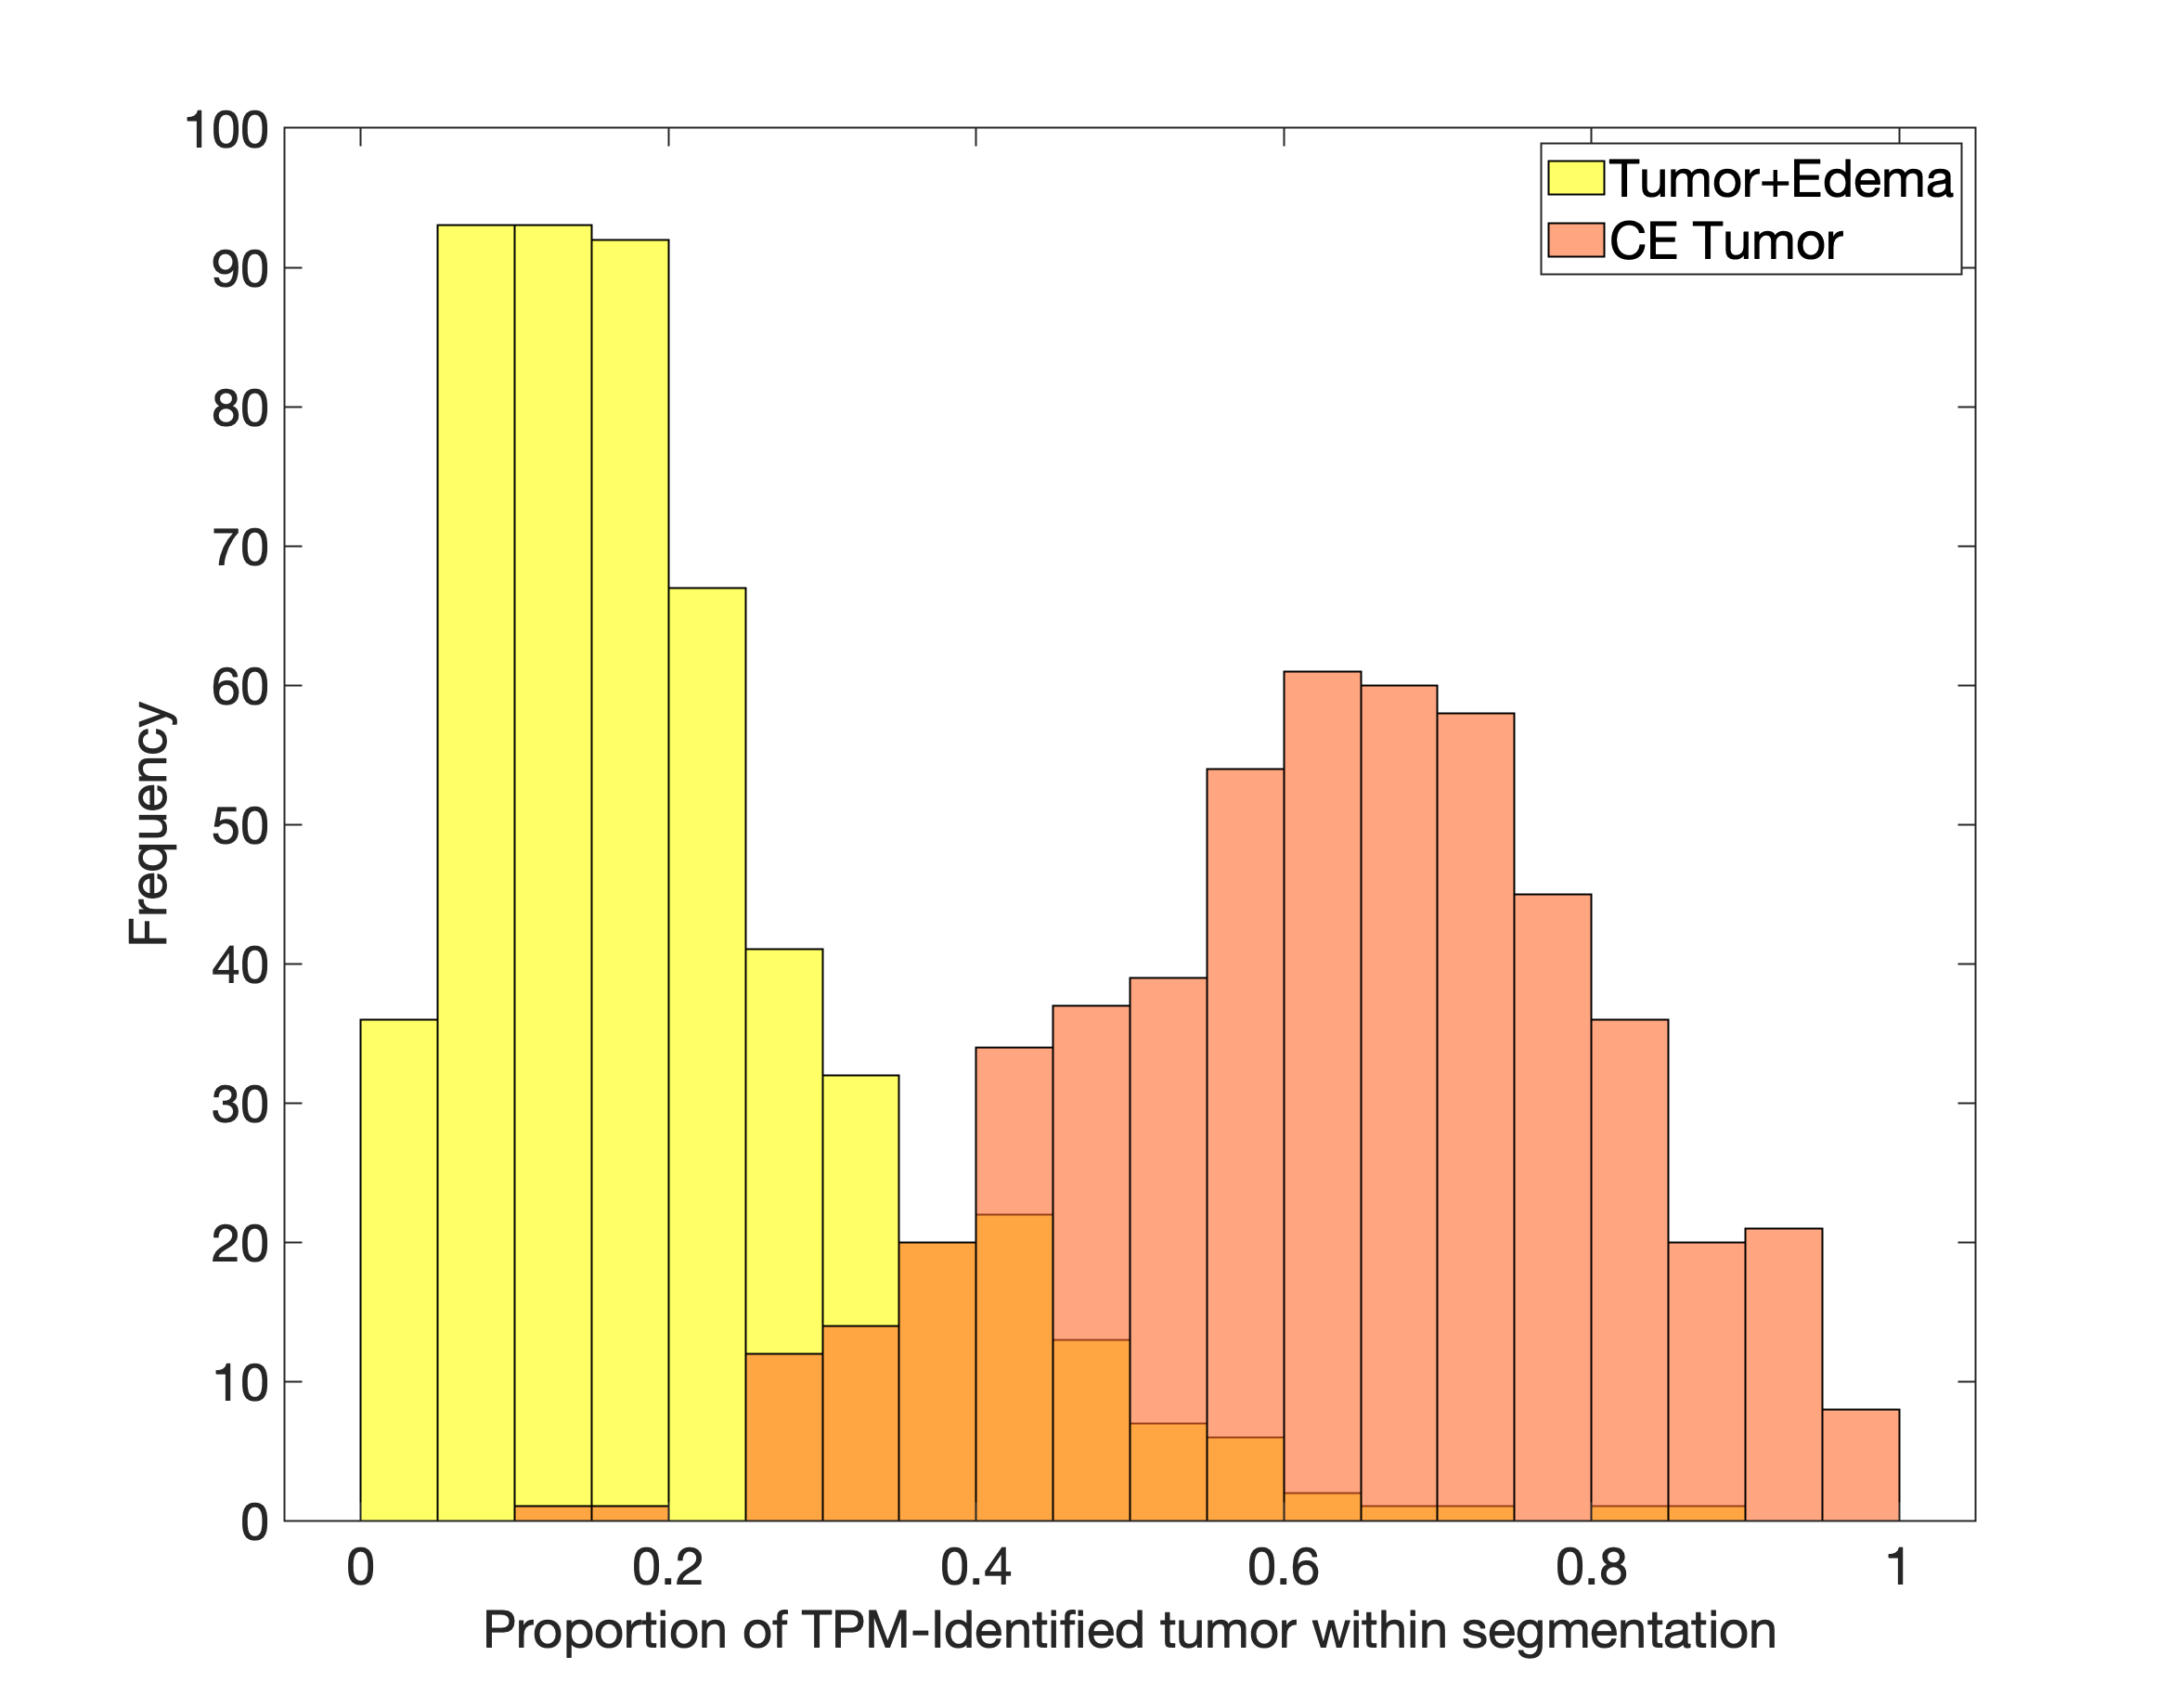
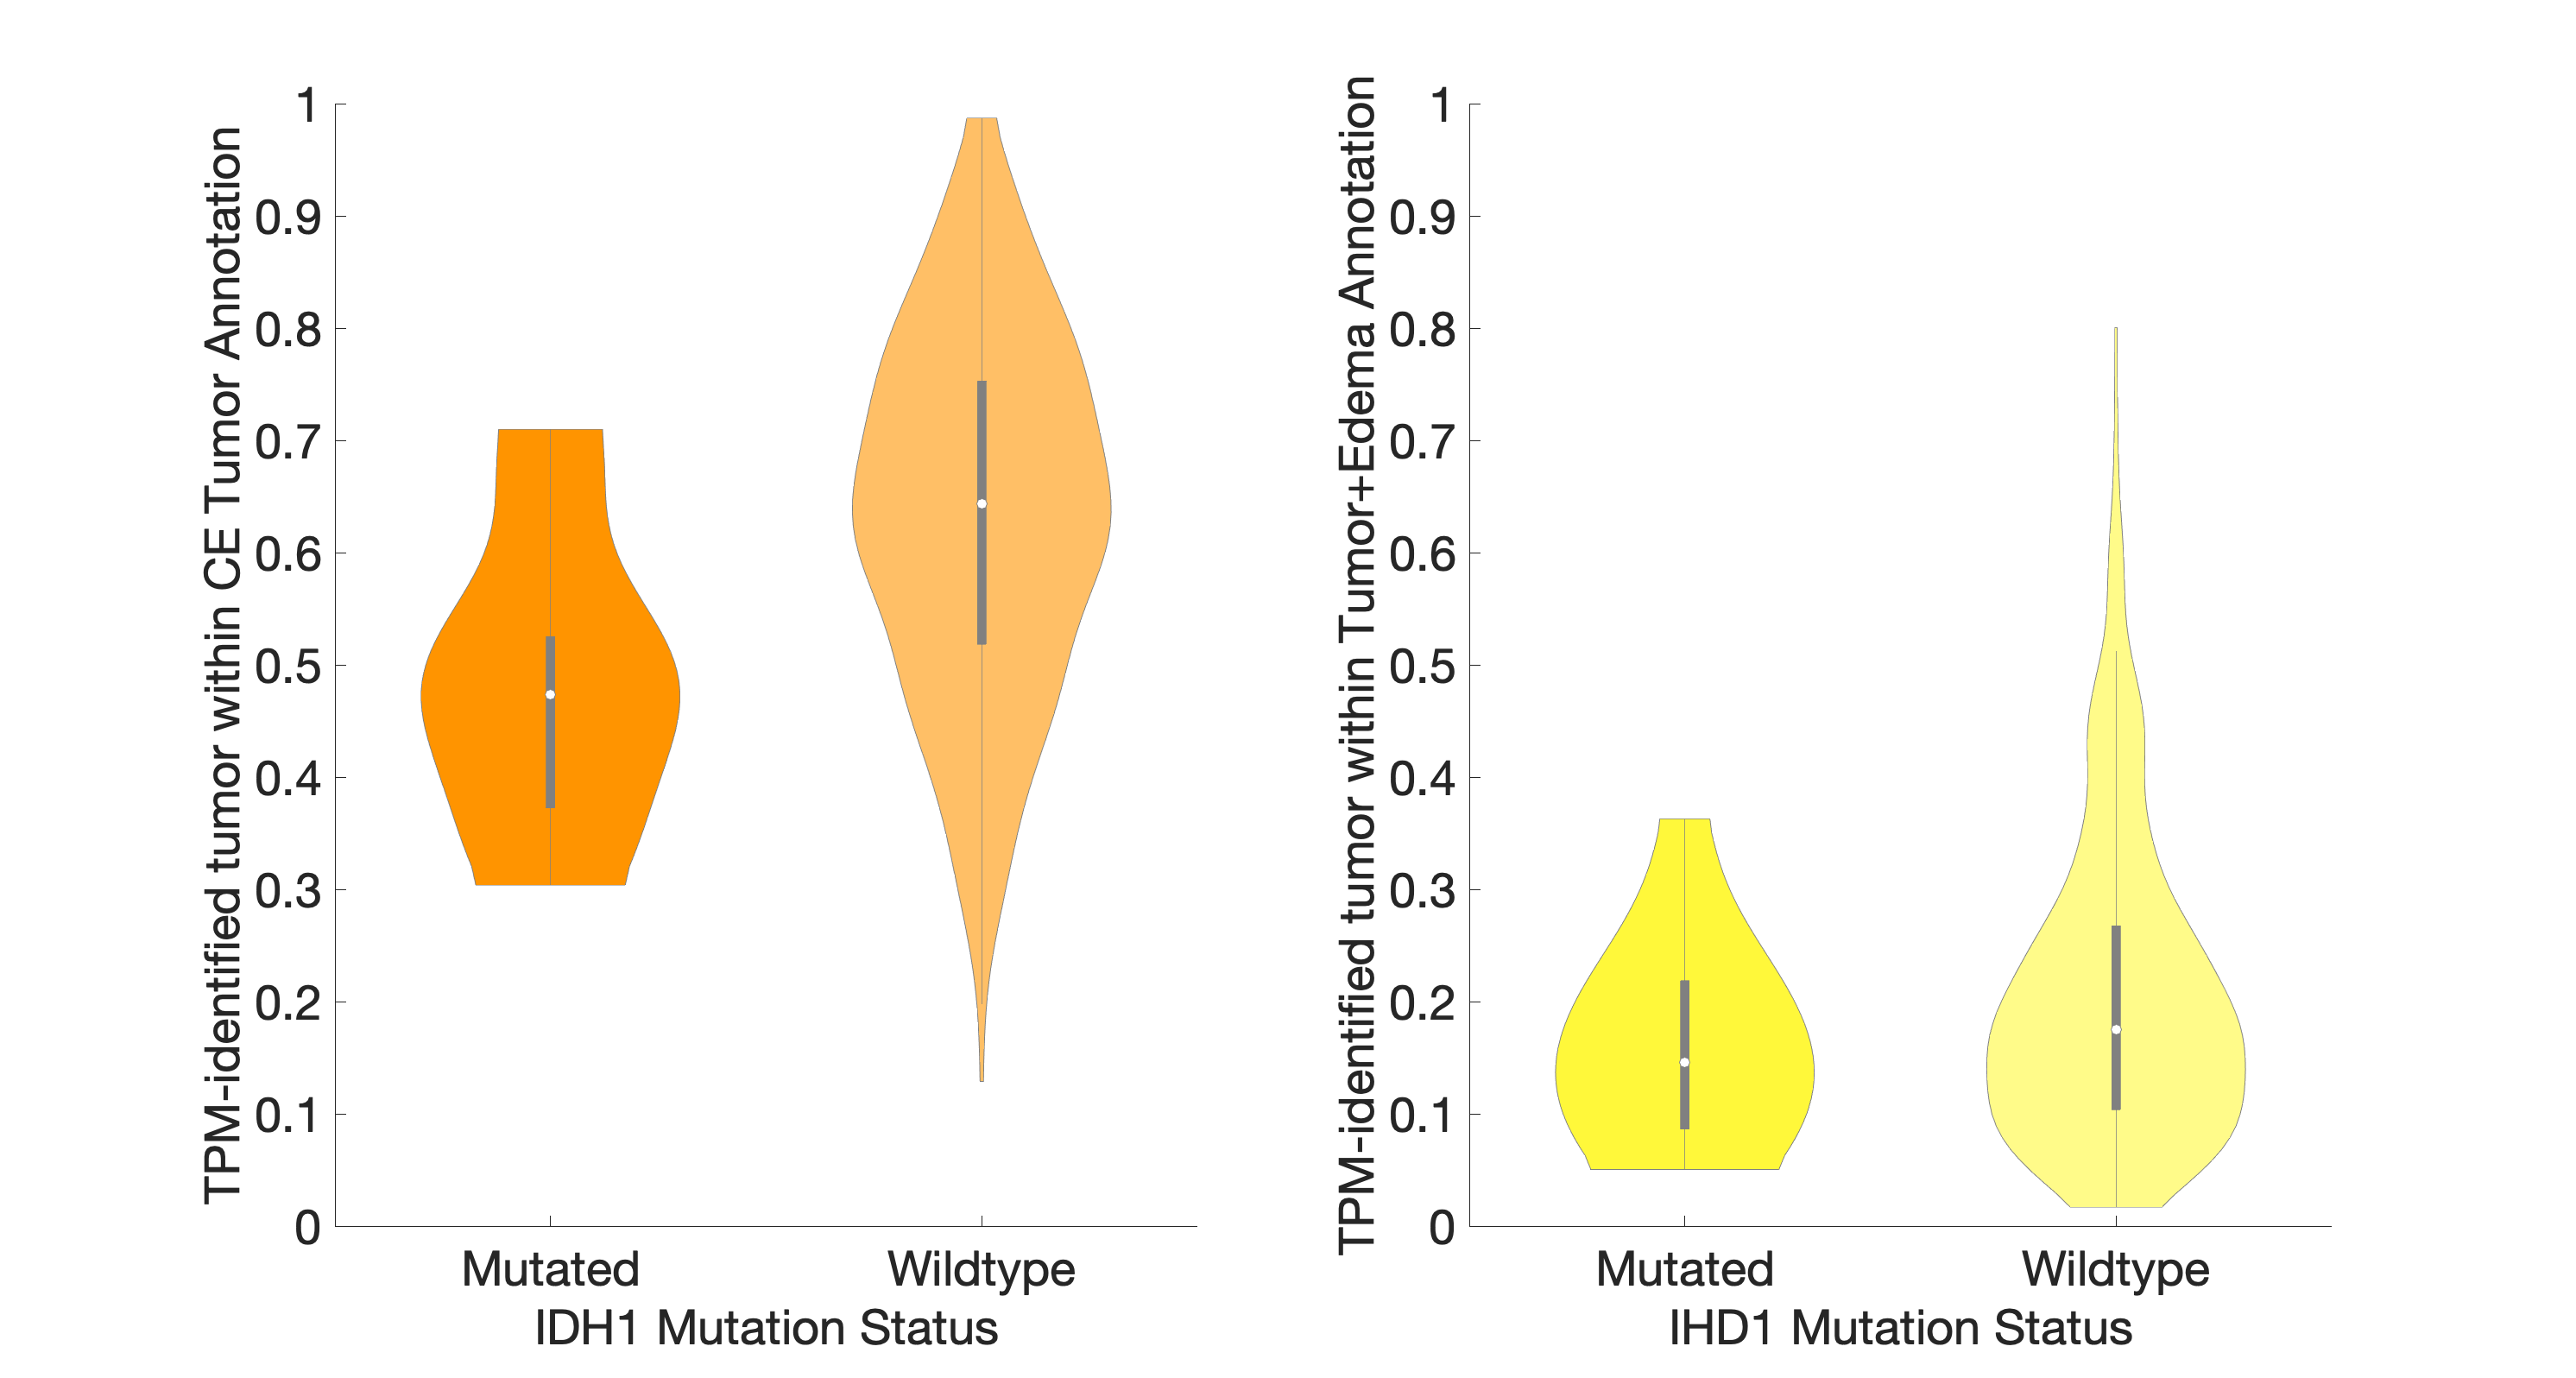
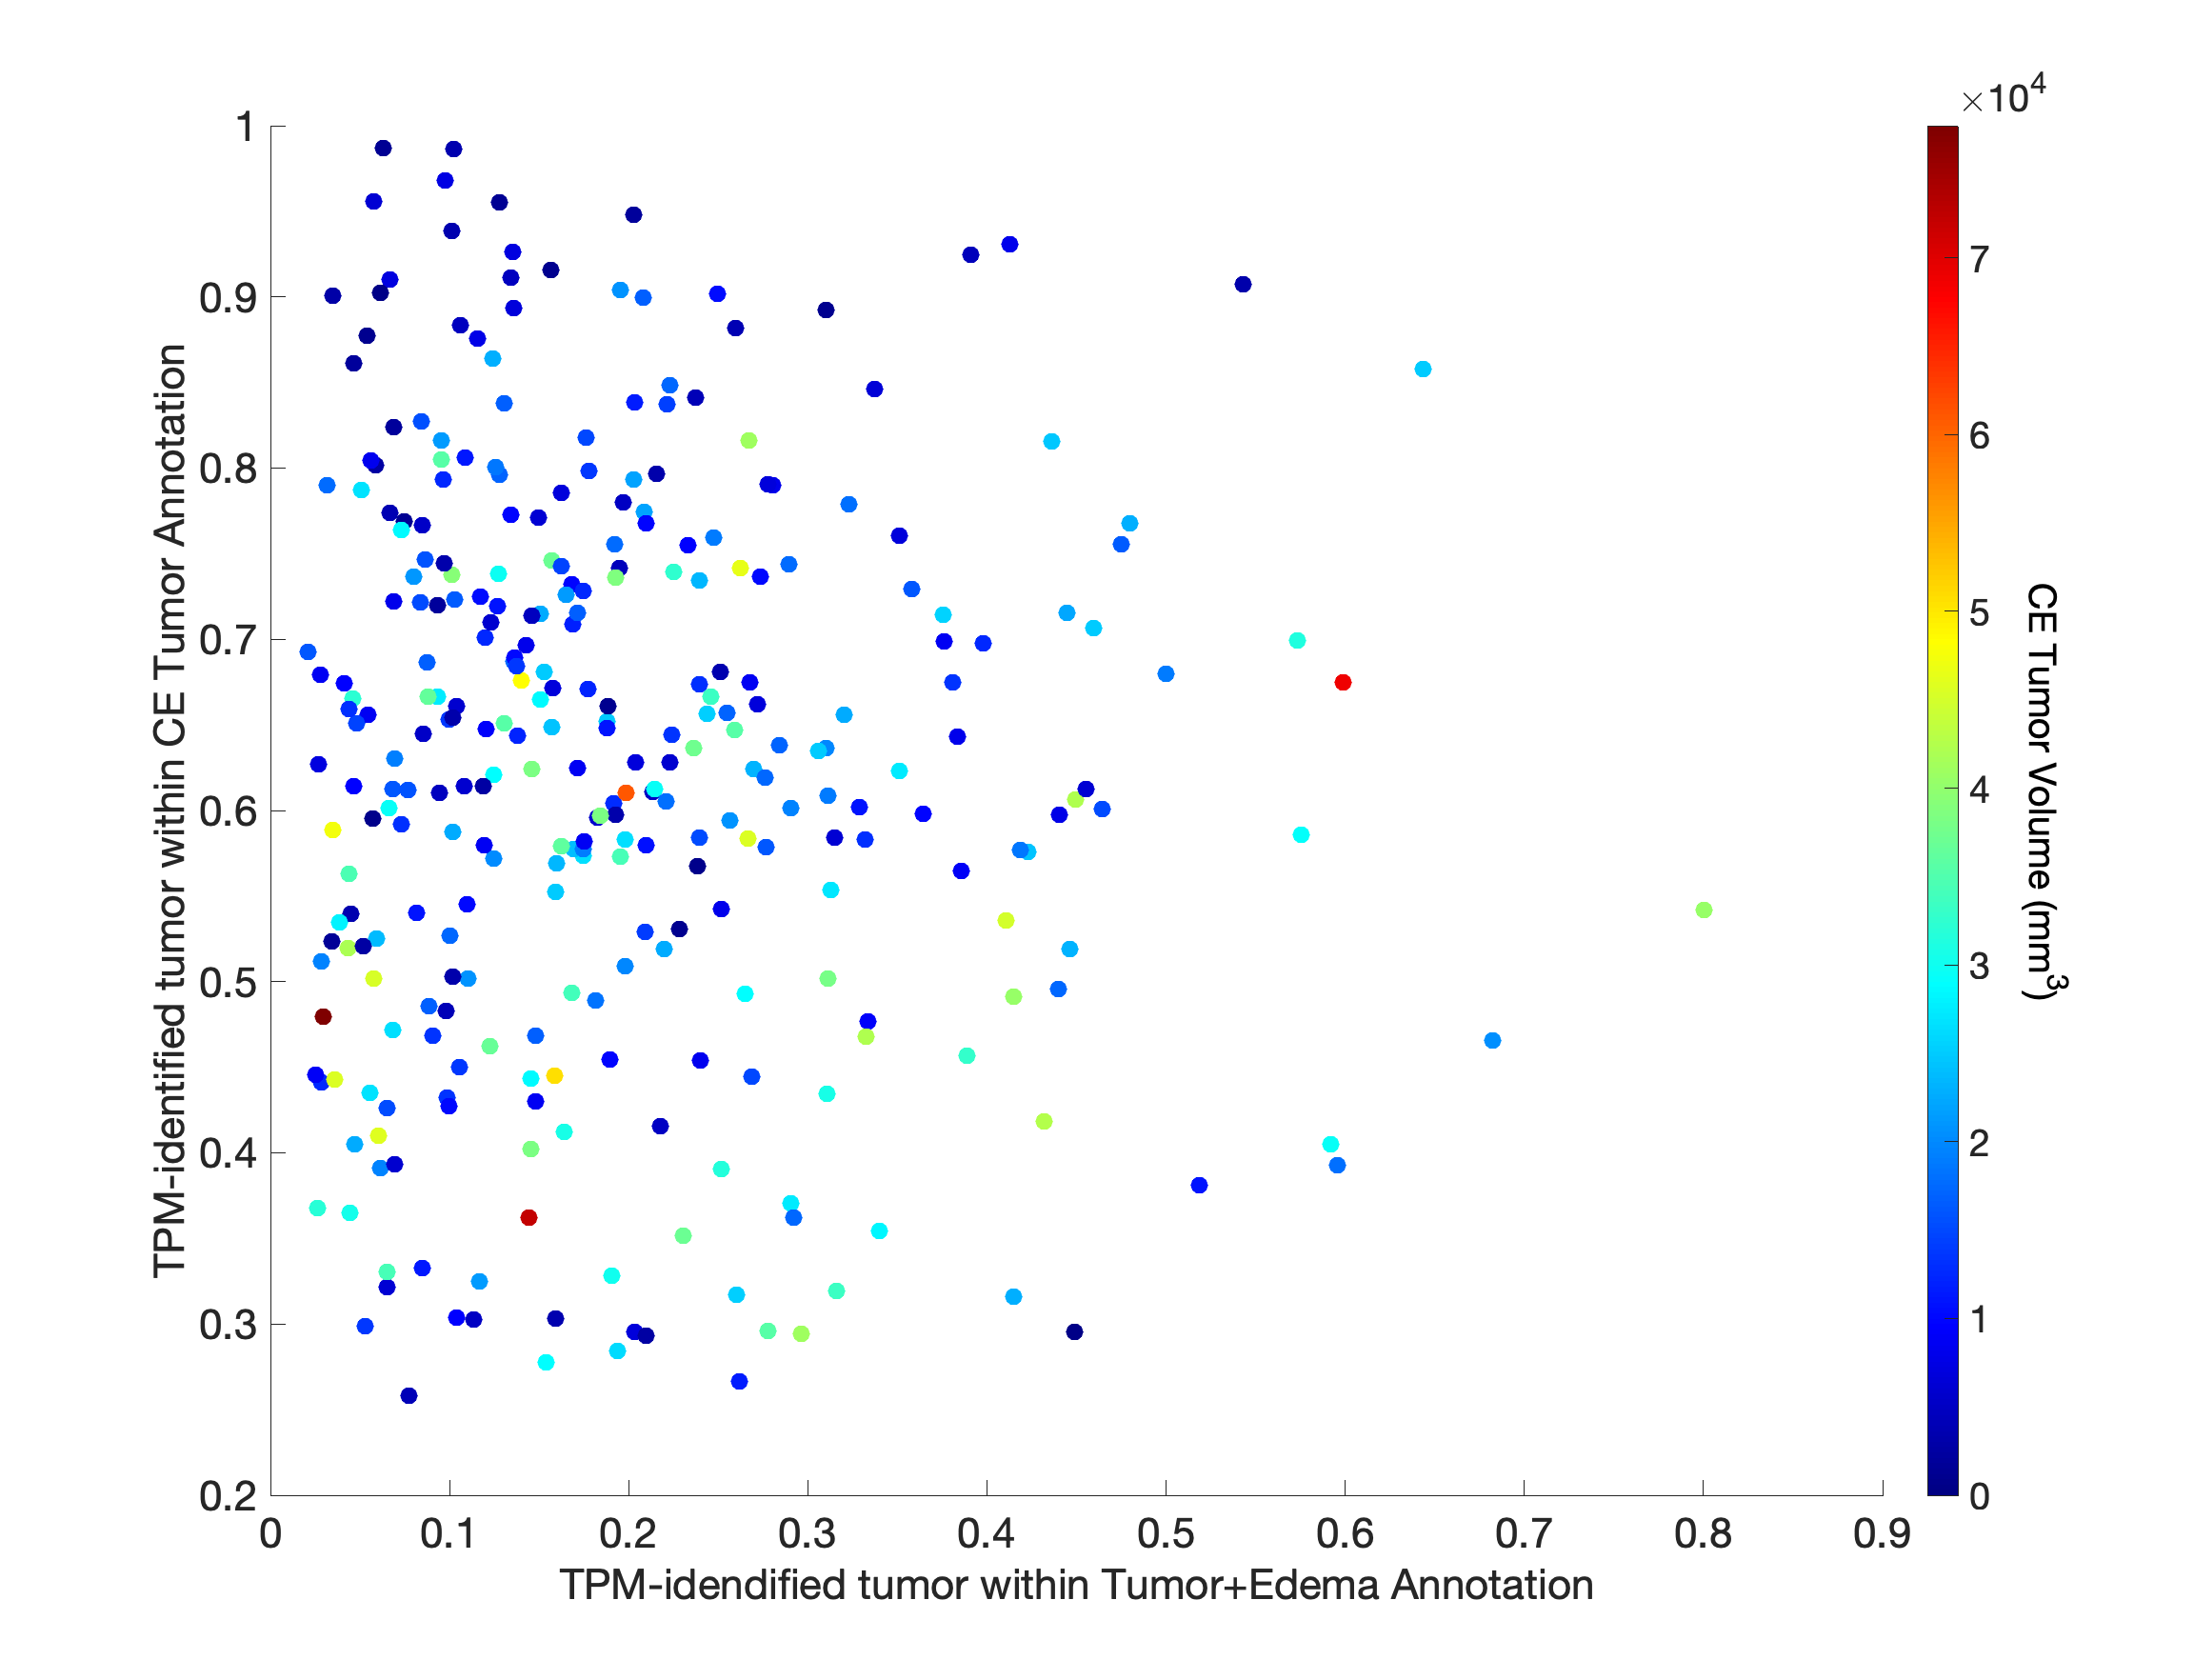
Figure 2 shows the histogram of the TPM-identified tumor proportion for each annotation class. CE showed high concentrations of tumor across most subjects (mean = 0.626, std. dev.= 0.166), with FLAIR hyperintense tumor+edema regions showing modest tumor presence across subjects (mean = 0.197, std. dev. = 0.135). Higher proportion of tumor within the CE tumor annotation was associated with IDH1-wildtype status (Figure 3, t = 2.87, p = 0.004), with no difference in tumor proportion observed for tumor+edema (t = 1.22, p = 0.22). Larger enhancing tumors were associated with both reduced tumor presence in the CE region (Figure 4, r = -0.298, p < 0.001), as well as increased tumor presence in the tumor+edema region (r = 0.163, p = 0.004). Examples of this relationship are presented in Figure 5, where larger tumors see less predicted tumor within contrast enhancement and greater infiltration into the FLAIR hyperintense region.Discussion
This study examined the characteristics of TPM-identified tumor proportions within radiologically-identifiable segmentations of glioblastoma. The distributions of TPM-identified tumor within each annotation confirmed conventional imaging interpretations, where most subjects have a majority of tumor within CE, with mild-to-moderate invasion into the FLAIR hyperintense region. We found that IDH1-mutant tumors demonstrated less tumor coverage within the contrast enhancing region than IDH1-wildtype tumors, suggesting that the less aggressive tumors may be identifiable pre-surgery using patterns observed on tumor probability maps. Additionally, larger tumors were found to have reduced presence within contrast enhancement and increased presence in the FLAIR hyperintense region, suggesting that more aggressive tumors may be more likely to extend beyond the treated margin. Future research is required to pathologically confirm these pre-surgical TPM-identified areas of tumor using biopsy tissue data, specifically when collected from non-enhancing areas. Additionally, this study did not address areas of TPM-identified tumor existing beyond the FLAIR hyperintense region, which were visually observed on a subset of cases and may indicate a more severe prognosis. Therefore, additional research contrasting conventional imaging signatures with data-driven maps of tumor characteristics is warranted.Acknowledgements
No acknowledgement found.References
1. S.A. Bobholz, A.K. Lowman, M. Brehler, F. Kyereme, S.R. Duenweg, J. Sherman, S.D. McGarry, E.J. Cochran, J. Connelly, W.M. Mueller, M. Agarwal, A. Banerjee, P.S. LaViolette, Radio-Pathomic Maps of Cell Density Identify Brain Tumor Invasion beyond Traditional MRI-Defined Margins, American Journal of Neuroradiology Apr 2022, DOI: 10.3174/ajnr.A7477
2.
Bobholz, S. A., Lowman, A. K., Connelly, J. M.,
Duenweg, S. R., Winiarz, A., Brehler, M., … LaViolette, P. S. (2022).
Non-invasive tumor probability maps developed using autopsy tissue identify
novel areas of tumor beyond the imaging-defined margin. MedRxiv,
2022.08.17.22278910. https://doi.org/10.1101/2022.08.17.22278910
3. Bakas, S., Sako, C., Akbari, H. et al. The University of Pennsylvania glioblastoma (UPenn-GBM) cohort: advanced MRI, clinical, genomics, & radiomics. Sci Data 9, 453 (2022). https://doi.org/10.1038/s41597-022-01560-7
Figures