2126
Histogram model of MRI arteriolar blood volume in detecting subclinical recurrence of high-grade glioma after chemoradiotherapy1Department of Medical Imaging, Nanfang Hospital, Southern Medical University, Guangzhou, China, 2Department of Neurosurgery, Nanfang Hospital, Southern Medical University, Guangzhou, China
Synopsis
Keywords: Tumors, Perfusion, Inflow-based vascular space occupancy (iVASO)
Early detection of disease progression is of important relevance for the management of high-grade glioma (HGG) patients. Related studies showed that perfusion-weighted MR imaging (PWI) has power to detect early recurrence of glioblastoma. Inflow-based vascular space occupancy (iVASO) is a noninvasive perfusion technology that can provide absolute blood volume of precapillary arterioles (arteriolar blood volume, BVa). In this preliminary study, the potential value of BVa in detecting subclinical recurrence of HGG was investigated. The results showed that the histogram features of BVa might have the potential to detect subclinical recurrence.Introduction
Early detection of disease progression is of potential clinical significance for the management of high-grade glioma (HGG) patients. Follow-up is usually recommended for newly developed enhancing diseases 1. A few studies attempted to predict disease progression via perfusion-weighted MR imaging (PWI) and showed promising results 2, 3. Of note, enhancing non-measurable diseases (NMD), i.e, those with a diameter of less than 10 mm, were not analyzed in these studies. However, enhancing NMD might be an early stage of glioma progression. Therefore, accurate identification of progression at the stage of NMD (subclinical recurrence) would provide earlier evidence for individualized clinical decision-making 4. Inflow-based vascular-space-occupancy (iVASO) is a novel perfusion technique which can quantify arteriolar blood volume (BVa) of brain tumor and shows potential value in monitoring treatment response for cerebral gioma 5-7. This study aimed to investigate the potential value of iVASO-based BVa in detecting subclinical recurrence of HGG after chemoradiotherapy.Materials and Methods
A total of 50 HGG patients (mean age ± standard deviation, 47.1 years ± 12.4; 39 men) who underwent temozolomide-based chemoradiation after surgery from January 2016 to May 2020 were enrolled retrospectively. MRI data were acquired on a 3.0 T scanner (Achieva, Philips Healthcare, Best, The Netherlands) with an 8-channel head coil. Fourteen CBVa histogram features were extracted and binary logistic regression was used to construct histogram models to detect subclinical recurrence. Receiver operating characteristic curves (ROC) were used to evaluate diagnostic performance.Results
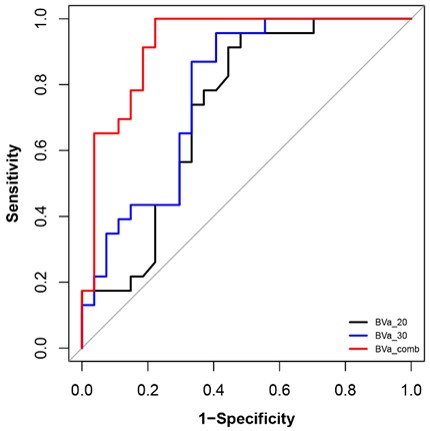
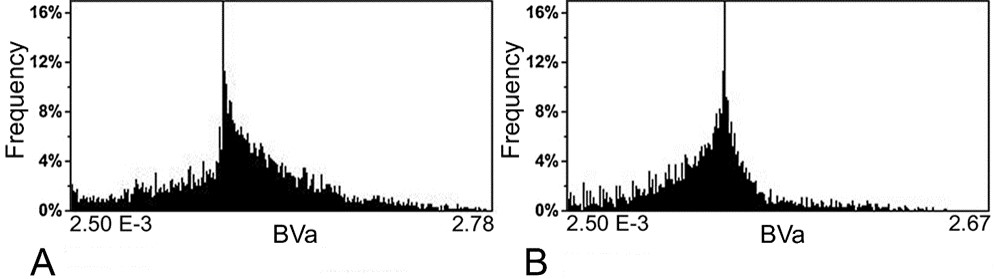
The 50 patients were divided into the progression group (n =23) and non-progression group (n =27). A total of 10 histogram parameters of BVa showed significant difference between the two groups (Table 1). All these 10 parameters were higher in the progression group. The areas under ROC curve were 0.73 for BVa_20 and 0.78 for BVa_30. When combined, the area under ROC curve is 0.92 (Table 2 and Figure 1). Figure 2 shows the representative histogram of each group.Discussion
Our results demonstrated that the histogram model based on BVa alone could accurately detect subclinical recurrence of high-grade glioma (HGG) after chemoradiotherapy.Given the high frequency of recurrence in HGG and the poor survival rate thereafter, early detection of recurrence is key to facilitating timely medical treatment and prolonging survival 4. However, newly developed enhancing lesions in HGG after surgery and chemoradiotherapy pose a huge challenge in clinical daily practice 8. Previous studies have used commonly available PWI methods, such as dynamic susceptibility contrast (DSC) and dynamic contrast-enhanced (DCE) MRI, to predict progression or differentiate true progression from pseudoprogression 3. The study by Yoo et al discussed the potential value of DCE-MRI in predicting the development of measurable disease (MD) in glioblastoma patients, which demonstrated elevated Mean of volume transfer constant (Ktrans) and extravascular volume (Ve)and 5th percentile of Ktrans in the progression group 9. Similarly, another DCE-MRI study by Yun et al demonstrated elevated Mean and 10th percentile of Ktrans and Mean and 5th percentile of Ve in true progression 10. Also, Thomas et al found that true progression had a higher Mean and 90th percentile of both Ktrans and fractional plasma volume 11. In contrast to these studies, enhancing NMD was investigated in the present study, and, for the first time, we found that most histogram features of BVa of enhancing NMD, such as 20th percentile and 30th percentile, were higher in the progression group. Our results were basically consistent with above-stated previous studies. Also, our present study showed that the histogram model consisted of 20th percentile and 30th percentile of BVa could detect subclinical recurrence of HGG with a considerable high accuracy. However, in this preliminary study, we did not compare the diagnostic performance of iVASO with DSC- or DCE-MRI.
Conclusion
The histogram model based on BVa alone might accurately detect subclinical recurrence of high grade glioma after chemoradiotherapy, which seems to be useful for individualized follow-up management.Acknowledgements
References
1. Wen PY, Chang SM, Van den Bent MJ, et al. Response assessment in neuro-oncology clinical trials. J Clin Oncol, 2017; 35(21): 2439-2449.
2. Khalifa J, Tensaouti F, Chaltiel L, et al. Identification of a candidate biomarker from perfusion MRI to anticipate glioblastoma progression after chemoradiation. Eur Radiol, 2016;26(11):4194-4203.
3. Shin K E, Ahn K J, Choi H S, et al. DCE and DSC MR perfusion imaging in the differentiation of recurrent tumour from treatment-related changes in patients with glioma. Clinical Radiology, 2014;69(6): e264-e272.
4. Y Jin, J.W Randall, H Elhalawani, et al. Detection of Glioblastoma Subclinical Recurrence Using Serial Diffusion Tensor Imaging. Cancers (Basel), 2020; 12(3): 568.
5. Hua J, Qin Q, Pekar JJ, et al. Measurement of absolute arterial cerebral blood volume in human brain without using a contrast agent. NMR in Biomedicine, 2011; 24(10):1313-1325.
6. Wu Y, Agarwal S, Jones CK, et al. Measurement of arteriolar blood volume in brain tumors using MRI without exogenous contrast agent administration at 7T. J Magn Reson Imaging, 2016; 44(5):1244-1255.
7. He W, Li X, Hua J, Liao S, Guo L, Xiao X, Liu X, Zhou J, Wang W, Xu Y, Wu Y*. Noninvasive assessment of O(6)-methylguanine-DNA methyltransferase promoter methylation status in World Health Organization Grade II–IV glioma using histogram analysis of inflow-based vascular-space-occupancy combined with structural magnetic resonance imaging. Journal of Magnetic Resonance Imaging, 2021; https://doi:10.1002/jmri.27514
8. J.Y Kim, J.E Park, Y Jo, et al. Incorporating diffusion- and perfusion-weighted MRI into a radiomics model improves diagnostic performance for pseudoprogression in glioblastoma patients. Neuro Oncol, 2019; 21(3): 404–414.
9. Yoo R, Choi S H, Kim T M, et al. Dynamic contrast-enhanced MR imaging in predicting progression of enhancing lesions persisting after standard treatment in glioblastoma patients: a prospective study. European Radiology, 2017;27(8):3156-3166.
10. Yun T J, Park C K, Kim T M, et al. Glioblastoma treated with concurrent radiation therapy and temozolomide chemotherapy: differentiation of true progression from pseudoprogression with quantitative dynamic contrast-enhanced MR imaging. Radiology, 2015;274(3):830-840.
11. Thomas AA, Arevalo-Perez J, Kaley T, et al. Dynamic contrast enhanced T1 MRI perfusion differentiates pseudoprogression from recurrent glioblastoma. J Neuro-Oncol, 2015; 125(1): 183-190.
Figures
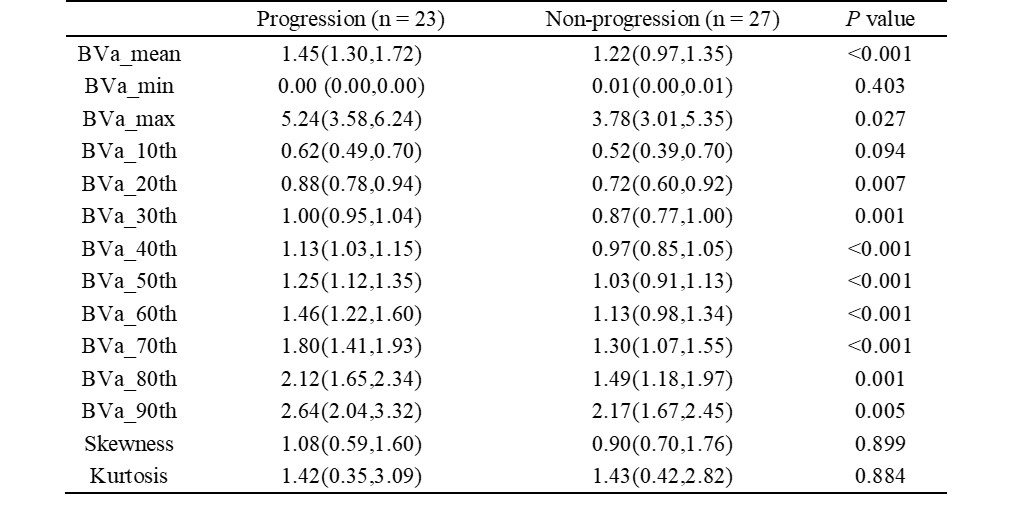
Table 1. Difference of histogram parameters between progression and non-progression groups.
Note: Except for P value, data are presented as median (interquartile ranges). Values are expressed in units of ml/100 ml for all BVa histogram parameters except for skewness and kurtosis. BVa, arteriolar blood volume; BVa_n, the nth percentile value of cumulative BVa histogram.
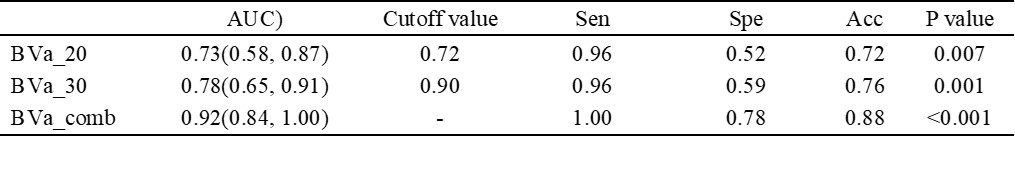
Table 2. Diagnostic performance of histogram parameters for differentiating progression and non-progression in high-grade glioma.
Note: Data in parentheses are 95% confidence intervals. AUC, area under the receiver operating characteristic curve; Sen, sensitivity; Spe, specificity; Acc, accuracy; BVa, arteriolar blood volume; BVa_n, the nth percentile value of cumulative BVa histogram. Cutoff values are established by calculating the maximal Youden index, with its unit being ml/100 ml.