2125
Automatic Segmentation of Vasculature in DCE-MRI of Brain Tumors and its Influence in Grading1Centre for Biomedical Engineering, Indian Institute of Technology Delhi, New Delhi, India, 2Department of Radiology, Fortis Memorial Research Institute, Gurugram, India, 3Department of Neurosurgery, Fortis Memorial Research Institute, Gurugram, India, 4SRL Diagnostics, Fortis Memorial Research Institute, Gurugram, India, 5Yardi School for Artificial Intelligence, Indian Institute of Technology Delhi, New Delhi, India, 6Department of Biomedical Engineering, All India Institute of Medical Sciences, New Delhi, India
Synopsis
Keywords: Tumors, Brain
Quantitative DCE-MRI parameters are sensitive to tumor microvasculature and have shown potential in tumor grading. Generally, value of some of these parameters increases with tumor grades. During analysis of tumor region, large-blood-vessels (LBV) can influence the actual changes due to tumor microvasculature and hence provide erroneous results. Objectives of this study were to develop an automatic framework for segmentation of the LBV present within and outside of the tumor region and to reduce errors in tumor grading. The statistical analysis of parameters in tumor region showed significant differences between with and without LBV. Moreover, LBV removal improved tumor classification accuracy.Introduction
Quantitative DCE-MRI provides multiple parameters such as CBV and CBF using first-pass analysis; Ktrans, Vp, and Ve using tracer kinetic analysis; wash-in (Slope-1) and wash-out (Slope-2) slope using a piecewise linear model. These parameters are quite useful in the detection and grading of tumors. Large blood vessels (LBV) show a high contrast value on some quantitative maps like CBV1,2, CBF3,4, Slope-25. Such LBVs are also present inside or around the tumor lesion. In that case, tumor tissue analysis corresponding to quantitative parameters such as CBV, CBF, and Vp can lead to incorrect characterization or grading of the tumor. Therefore, such LBV should be excluded from the tumor lesion analysis. In literature, various techniques have been used to remove LBV4–8. Earlier, the LBV segmentation was done using CBV maps but the drawback is both, the tumor and blood vessels were having approximately same intensity thus, making the blood vessel segmentation much difficult. Whereas the Slope-2 maps has a large gap in the intensity values (higher tumor intensities and lower LBV intensities) but in some patients because of the intensity values the fully automatic segmentation got hampered. Thus, considering the drawbacks the combination of both the CBV and Slope-2 map is used for the LBV segmentation. Hence, the objective of the current study was to automatically segment LBV and tumor lesions followed by the evaluation of quantitative DCE-MRI parameters in the grading of tumors without the influence of LBV.Materials and Methods
This retrospective analysis included the MRI data of 64 patients with brain tumor (32 low-grade glioma (LGG) and 32 high-grade glioma (HGG) classified using WHO 20219). All MRI tests were conducted on a 3T whole-body MRI system (Ingenia, Philips Healthcare, The Netherlands). The structural (T1, T2, PD weighted), DCE-MRI (or T1-Perfusion), SWI, and FLAIR images were used in the MRI protocol for this study. DCE-MRI data (TR/TE=6.3/3.1ms, FOV=230×230 mm2, matrix=256×256, 20 slices with thickness 6mm, 32 dynamics with 3.8s temporal resolution, contrast dose (Gd-DT) 0.1mmol/kg body weight, 3.5ml/sec injection rate) were processed using the in-house developed DCE-MRI analysis tool on MATLAB-2021a. Preprocessing of data included skull-stripping, registration, and noise filtering. DCE-MRI analysis included piecewise-linear (PL) model fitting for computing maps of alpha, beta, Slope-1, Slope-2; first pass analysis for CBV, CBF; and generalized-tracer-kinetic model fitting for Ktrans, Vp, Ve10.Tumor lesions were segmented on FLAIR images using in-house developed AI tool11 followed by editing of mask if required. Normal appearing contralateral white-matter (WM) and gray-matter (GM) tissues were also segmented. For automatic segmentation of BV, a combined map of CBV and Slope2 (CBV/Slope-2) was generated. This combined map increased the contrast between LBV and the rest of the tissues and enabled automatic segmentation of LBV. The k-means clustering (k=4) and morphological operations were applied to this combined map for the final LBV segmentation. Masks (tumor and vasculature) were validated and verified by a Radiologist having more than 40 years of experience in MR imaging. Then, tumor mask and LBV mask were multiplied for the analysis of tumor mask without LBV. In all the dataset, before and after removal of blood vessels statistical features (minimum, maximum, mean, standard deviation, 5th percentile and 95th percentile values) were calculated for different quantitative parameters (CBV, CBF, Slope-2, Ktrans, Ve and Vp).
Results
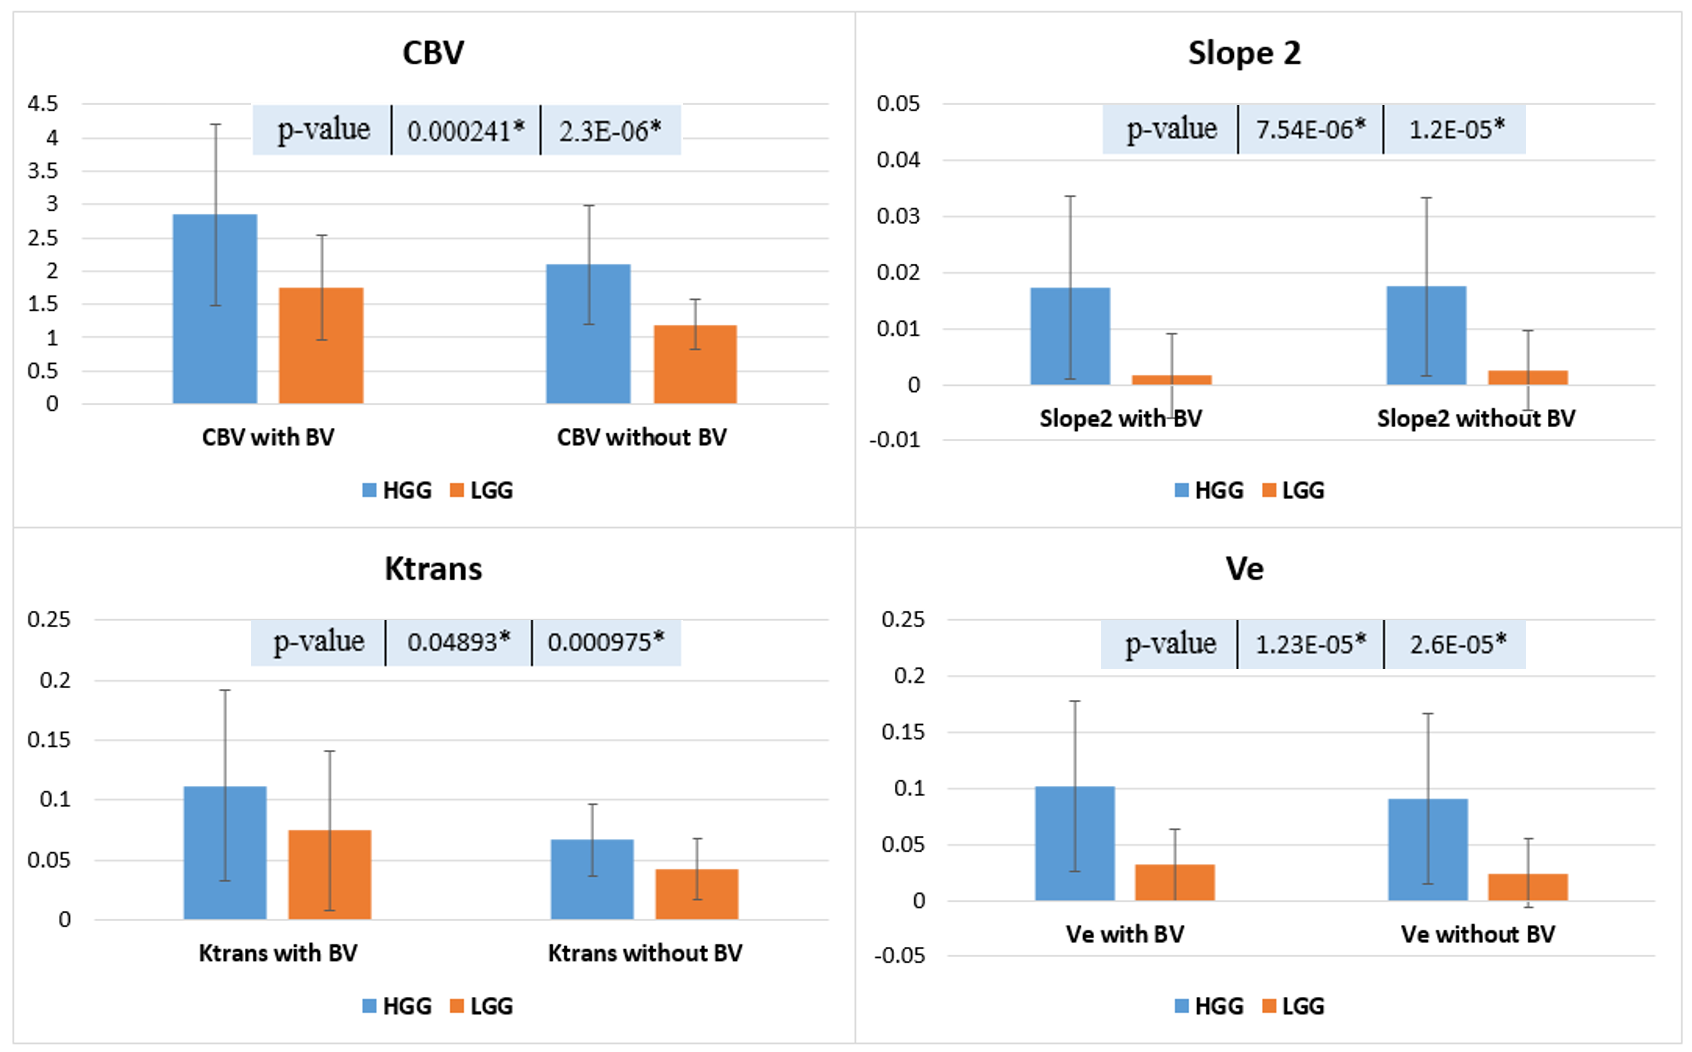
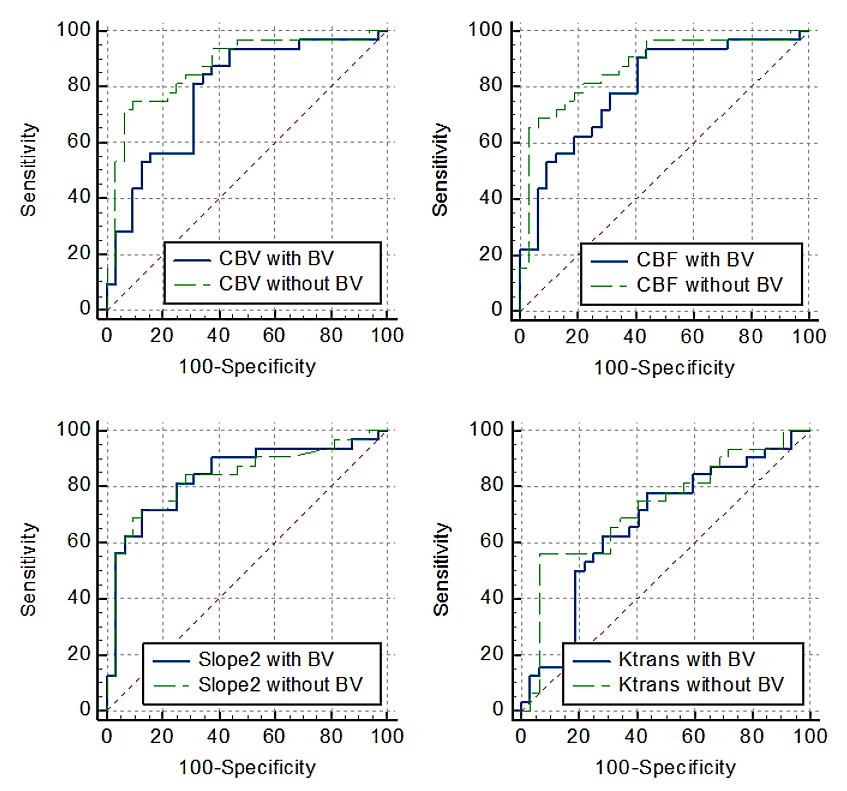
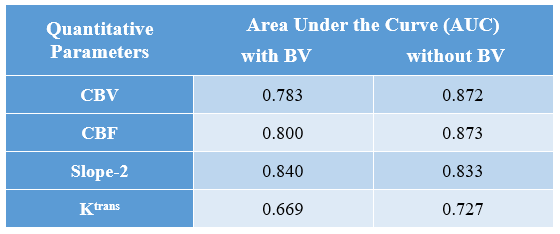
A comparison of quantitative parameters was performed before and after LBV removal for different grades of brain tumor. Fig.2 contains a single slice of a HGG and LGG patient each showing images of CBV and Slope-2 maps before and after the removal of the vasculature. Bar plot of the 95th percentile in Fig.3 brought the conclusion that CBV, Ktrans, Ve and other parameters showed a significant difference in HGG and LGG dataset and would increase the significant difference or reduce the p-values after removal of LBV. However, in Slope-2, the 95th percentile values before LBV removal were 0.0174±0.0163 (HGG) and 0.0016±0.0075 (LGG) respectively whereas after applying the removal of LBV the values remain approximately same i.e. 0.0175±0.0159 (HGG) and 0.0025±0.0071 (LGG). Thus, removal of LBV improved the accuracy of grading for most of the parameters except for Slope-2. Table 1 summarized the AUC of some quantitative parameters which resulted in generating higher AUC after vessel removal.Conclusion and Discussion
Proposed method based on the combination of Slope-2 and CBV enhanced the blood vessels and made it easy to separate using the proposed algorithm. Statistically significant differences in the values were observed between with and without LBV maps. In the current study, the comparative study performed between the two tumor grades showed a significant difference (p-value<0.05), as well as the difference increased after the blood vessel removal. The validation of the segmented blood vessel mask was done with the SWI images because in SWI images arteries and veins contrast is high. Tumor grading using Slope-2 parameter showed different trend compared to other parameters after LBV removal. In Fig.3 no significant difference was observed in Slope-2 because unlike other parameters, in Slope-2 maps, vasculature has lower intensity and tumor has higher intensity values. Thus, BV doesn’t contribute to the 95th percentile value and hence, leading to no significant difference after the removal of the vasculature.Acknowledgements
Authors acknowledge the funding support of SERB, DST (project number: CRG/2019/005032). Authors acknowledge data acquisition support of Mr. Rakesh Kumar Singh.References
1. Saini J, Gupta RK, Kumar M, et al. Comparative evaluation of cerebral gliomas using rCBV measurements during sequential acquisition of T1-perfusion and T2-perfusion MRI. PLoS One. 2019;14(4):1-14. doi:10.1371/journal.pone.0215400
2. Law M, Yang S, Babb JS, et al. Comparison of cerebral blood volume and vascular permeability from dynamic susceptibility contrast-enhanced perfusion MR imaging with glioma grade. Am J Neuroradiol. 2004;25(5):746-755.
3. Bailey P, Cushing H. P. Bailey and H. Cushing 1926.pdf. 1926.
4. Sengupta A, Ramaniharan AK, Gupta RK, Agarwal S, Singh A. Glioma grading using a machine-learning framework based on optimized features obtained from T1 perfusion MRI and volumes of tumor components. J Magn Reson Imaging. 2019;50(4):1295-1306. doi:10.1002/jmri.26704
5. Jung BC, Arevalo-Perez J, Lyo JK, et al. Comparison of Glioblastomas and Brain Metastases using Dynamic Contrast-Enhanced Perfusion MRI. J Neuroimaging. 2016;26(2):240-246. doi:10.1111/jon.12281
6. Li X, Zhu Y, Kang H, et al. Glioma grading by microvascular permeability parameters derived from dynamic contrast-enhanced MRI and intratumoral susceptibility signal on susceptibility weighted imaging Head & neck imaging. Cancer Imaging. 2015;15(1):1-9. doi:10.1186/s40644-015-0039-z
7. Bhattacharjee R, Gupta RK, Patir R, Vaishya S, Ahlawat S, Singh A. Quantitative vs. semiquantitative assessment of intratumoral susceptibility signals in patients with different grades of glioma. J Magn Reson Imaging. 2020;51(1):225-233. doi:10.1002/jmri.26786
8. Emblem KE, Due-Tonnessen P, Hald JK, Bjornerud A. Automatic vessel removal in gliomas from dynamic susceptibility contrast imaging. Magn Reson Med. 2009;61(5):1210-1217. doi:10.1002/mrm.21944
9. DN L, A P, P W, et al. The 2021 WHO Classification of Tumors of the Central Nervous System: a summary. Neuro Oncol. 2021;23(8):1231-1251. doi:10.1093/NEUONC/NOAB106
10. Singh A, Haris M, Rathore D, et al. Quantification of physiological and hemodynamic indices using T1 dynamic contrast-enhanced MRI in intracranial mass lesions. J Magn Reson Imaging. 2007;26(4):871-880. doi:10.1002/jmri.21080
11. Maurya, S., Kumar Yadav, V., Agarwal, S., & Singh, A. (2022). Brain Tumor Segmentation in mpMRI Scans (BraTS-2021) Using Models Based on U-Net Architecture. In International MICCAI Brainlesion Workshop (pp. 312-323). Springer, Cham.
Figures
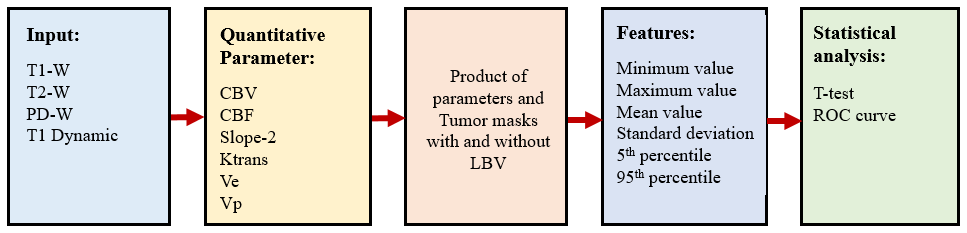
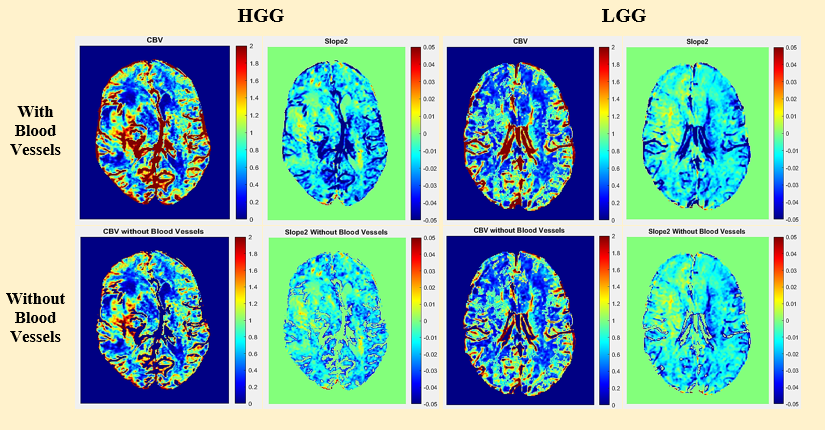
Fig.2: Quantitative maps of a representative case of high-grade-glioma (HGG) and low-grade-glioma (LGG) before and after large-blood-vessel removal.