2122
Nosological images of brain tumor MV-MRS 3T data based on classifiers trained with SV-MRS 1.5T data, a proof-of-concept
Gulnur Semahat Ungan1,2, Albert Pons-Escoda3, Daniel Ulinic2, Carles Arus1,2, Alfredo Vellido1,4, and Margarida Julia-Sape1,2
1Centro de Investigacion Biomedica en Red (CIBER), Cerdanyola del Valles, Spain, 2Universitat Autonoma de Barcelona, Cerdanyola del Valles, Spain, 3Hospital de Bellvitge, L'Hospitalet del Llobregat, Spain, 4Universitat Politecnica de Catalunya, Barcelona, Spain
1Centro de Investigacion Biomedica en Red (CIBER), Cerdanyola del Valles, Spain, 2Universitat Autonoma de Barcelona, Cerdanyola del Valles, Spain, 3Hospital de Bellvitge, L'Hospitalet del Llobregat, Spain, 4Universitat Politecnica de Catalunya, Barcelona, Spain
Synopsis
Keywords: Tumors, Spectroscopy, visualization, data analysis, MRS, brain tumours
We used SV-MRS 1.5T data of patients with brain tumors to create colored-classification images of MV-MRS 3T grids of an independent cohort of patients. In 10 out of 15 MV cases the solid tumor region corresponded to the correct class. In the remaining 5 cases, the reasons for (partial) misclassification included heterogeneity and bad spectral quality.Introduction
This abstract presents a proof-of-concept that aims to show that it is possible to obtain clinically informative and predictive color images of multivoxel (MV) grids, acquired with 3T preoperative scans from brain tumor patients, by training a classification model with preexisting SV retrospective multicenter data. The (nosological) classification images for the MV data are overlaid to the corresponding reference MR images to assess whether the solid tumor region is correctly predicted and whether the segmentation separating solid tumor region, anatomically abnormal area and unaffected brain is correct. We focused on the most frequent brain tumor types, namely meningioma (mm), low-grade glioma (lgg), glioblastoma (gb), metastasis (me) and normal brain (no).Materials and methods:
Retrospective study, using two short TE datasets: 1st training dataset) multicenter multiformat SV INTERPRET short TE at 1.5T (1,2) . 2nd test dataset) multicenter multiformat MV eTumour short TE at 3T, fulfilling the following inclusion criteria: a) PRESS or Semi-LASER; b) short TE (30-32 ms); c) diagnosis of mm, gb, me, lgg (astrocytoma, oligodendroglioma or oligoastrocytoma of grade II) according to the WHO classification 2000; d) the MRI study had to contain the whole set of images; e) for multi-slice MV acquisitions, the number of MRS slices had to be the same as the available MRI slices; f) the data format should allow to extract the parameters for MV grid localization over the corresponding MRI slice. MRS processing: Both SV and MV were processed in the same way, using the INTERPRET parameters to ensure compatibility among different formats and manufacturers, and between SV and MV data. Essentially, 512-point-spectra in the [-2.7, 7.1] ppm interval, normalized to unit length (UL2), and with the [4.2, 5.1] ppm region zeroed. The reference images were processed with Gannet (3) to obtain one MRI patch per each MV slice to label the anatomical regions detected for further evaluation and to overlay the nosological images. The MV voxels were labelled by a radiologist with the class assignment based on the T2 images that were available in the eTumour database. Segmentation classes were: solid tumor region, abnormal tumor region (such as edema), normal tissue and ventricles. The voxels that were assigned as ventricle were excluded from the analysis. Quality control was performed using cNMF (4). We built 4-class classifiers to distinguish among mm, lgg, agg (me+gbm) and no. Feature selection and classification was performed over the SV data, using SpectraClassifier (5), using, in turn, sequential forward feature selection and linear discriminant analysis (LDA). Classification was repeated 1000 times by bootstrapping on the training set data. The test set data were the MRSI from the solid tumor and the normal regions. The classifier was evaluated on the training and on the test set using the balanced error rate (BER) and area under the ROC curve (AUC) measures. Classification results on the test set were visualized using nosological maps (color maps coded as the different classes). The colors chosen for each of the classes were: blue for no, red for agg, green for the lgg and yellow for mm. An in-house tool was used to overlay the nosological maps over the MRI patches. The accuracy in the determination of the class of the solid tumor region was computed for the test set using AUC and with the following Solid Tumor Index (STI):STI = (number of correctly classified voxels)/(total number of voxels in the solid tumour region – excluded voxels by low quality)
Results and discussion:
Results and discussion: Figure 1 shows the number of patients, spectra per class, for training and test sets. For MV, there were 17 Siemens Semi-LASER cases fulfilling inclusion criteria, with 4 mm, 8 gb and 2 me (10 agg) and 1 lgg and 2 grade III glial tumors. The latter two were only used to show the nosological images as they belonged to a class not included in the training. According to STI, 66% of cases (10 out of 15 cases) belonging to the classifier classes had STI >0.5, and the remaining 3 cases, namely et3038 (gb) with STI 0.27 and 0.73 of the voxels classified as lgg. As gliomas are heterogeneous, despite the low STI, this case should also be considered as correctly classified gb, as a non-negligible part of the solid tumor region was classified as gb. There were two more cases, et3109, a gb, and et3043, a mm, that were classified both as low-grade glioma entirely. In these cases, the spectral quality was bad, with low signal-to-noise ratio. The two grade III glial tumors were classified as lgg. The features selected by SpectraClassifier are shown on Figure 2. The best performance in the LDA was obtained when 8 features were used. Classification results with respect to the number of features are shown in Figure 3, and three example cases are shown on Figure 4. For the gb cases that were classified correctly according to the STI, the surrounding abnormal area was classified as lgg, in accordance with the infiltrating nature of this type of tumor, whereas in the two metastasis the surrounding area was classified as normal brain tissue, in accordance to previous literature (6).Acknowledgements
H2020-EU.1.3. - EXCELLENT SCIENCE - Marie Skłodowska-Curie Actions, grant number H2020-MSCA-ITN-2018-813120. Proyectos de investigación en salud 2020, grant numbers PI20/00064 and PI20/00360. Spanish Ministerio de Economía y Competitividad SAF2014-52332-R. Centro de Investigación Biomédica en Red en Bioingeniería, Biomateriales y Nanomedicina (CIBER-BBN [http://www.ciber-bbn.es/en, accessed on 8 November 2022], CB06/01/0010), an initiative of the Instituto de Salud Carlos III (Spain) co-funded by EU Fondo Europeo de Desarrollo Regional (FEDER). Spanish AEI PID2019-104551RB-I00 grant. We also thank the INTERPRET (IST-1999-10310) and eTumour (FP6-2002-LIFESCIHEALTH-503094) consortia, in particular Prof. Arend Heerschap and Dr. Jannie Wijnen, as well as Prof. Bernardo Celda for granting access to access the eTumour multivoxel dataset used here.References
- Tate AR, Underwood J, Acosta DM, Julià-Sapé M, Majós C, Moreno-Torres À, et al. Development of a decision support system for diagnosis and grading of brain tumours using in vivo magnetic resonance single voxel spectra. NMR Biomed. 2006;19(4):411–34.
- Julià-Sapé M, Griffiths JR, Tate RA, Howe FA, Acosta D, Postma G, et al. Classification of brain tumours from MR spectra: The INTERPRET collaboration and its outcomes. NMR Biomed. 2015 Dec;28(12):1772–87.
- Edden RAE, Puts NAJ, Harris AD, Barker PB, Evans CJ. Gannet: A batch-processing tool for the quantitative analysis of gamma-aminobutyric acid–edited MR spectroscopy spectra. J Magn Reson Imaging. 2014;40(6):1445–52.
- Hernández-Villegas Y, Ortega-Martorell S, Arús C, Vellido A, Julià-Sapé M. Extraction of artefactual MRS patterns from a large database using non-negative matrix factorization. NMR Biomed. 2022;35(4):e4193.
- Ortega-Martorell S, Olier I, Julià-Sapé M, Arús C. SpectraClassifier 1.0: a user friendly, automated MRS-based classifier-development system. BMC Bioinformatics. 2010 Feb 24;11(1):106.
- Pirzkall A, Li X, Oh J, Chang S, Berger MS, Larson DA, et al. 3D MRSI for resected high-grade gliomas before RT: tumor extent according to metabolic activity in relation to MRI. Int J Radiat Oncol Biol Phys. 2004 May 1;59(1):126–37.
Figures
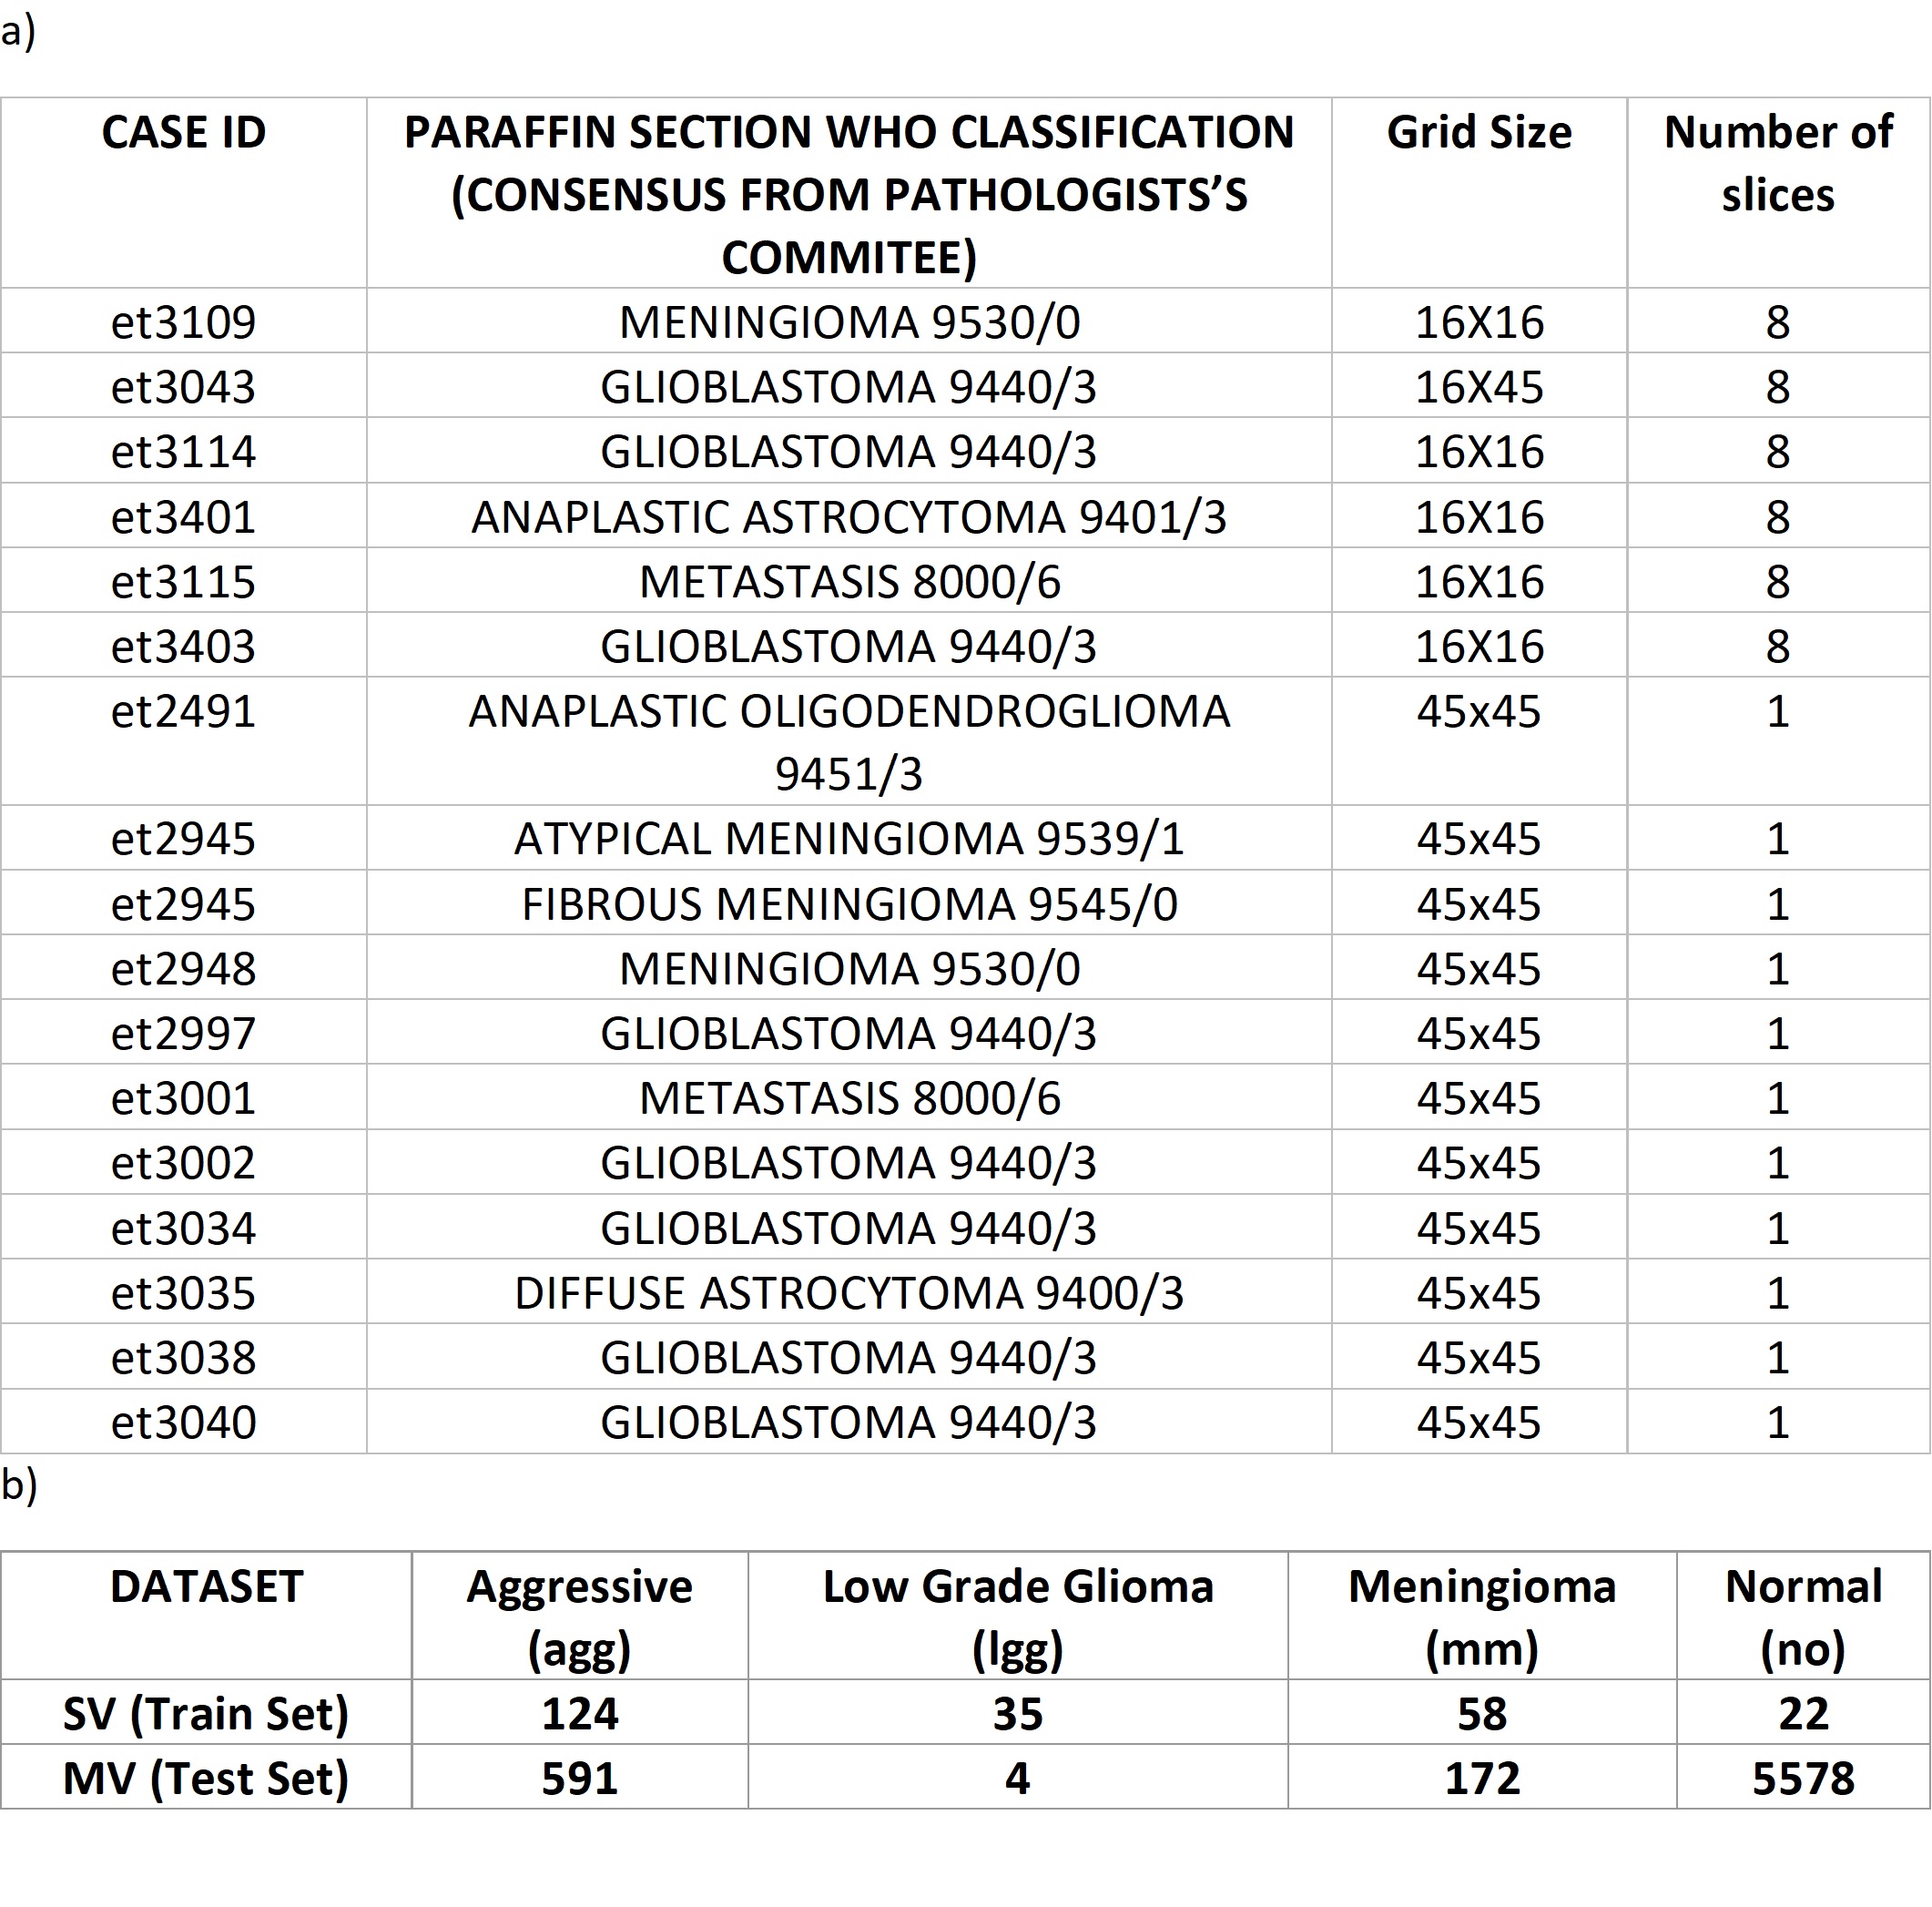
Figure 1:
a) cases from the eTumour database fulfilling the inclusion criteria. b) Number
of voxels for training and testing.
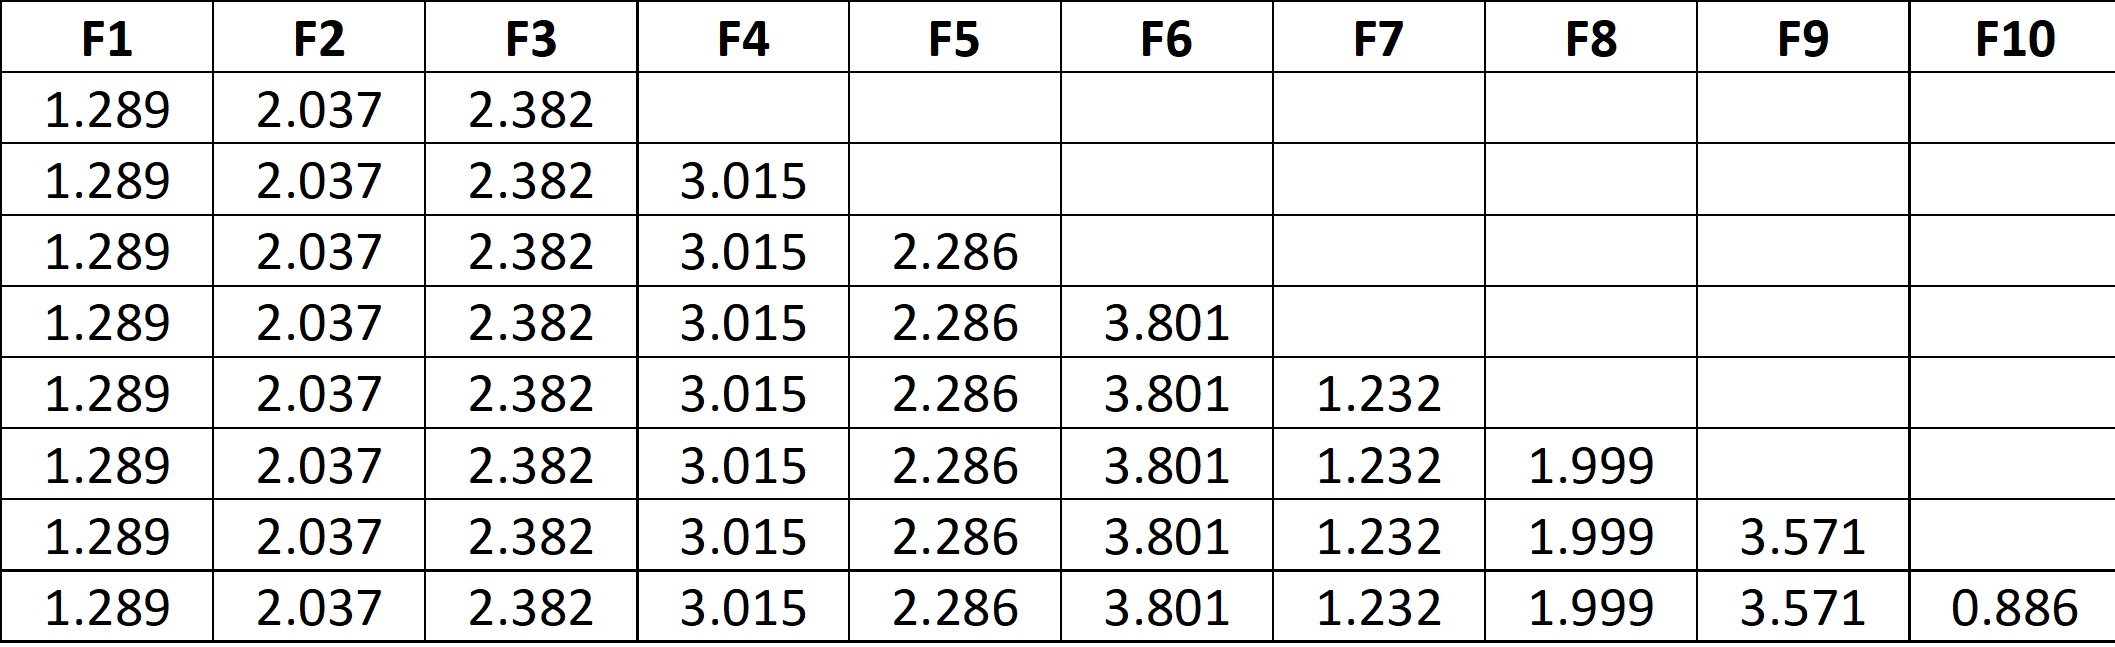
Figure 2.
Feature sets tested with features in ppm.
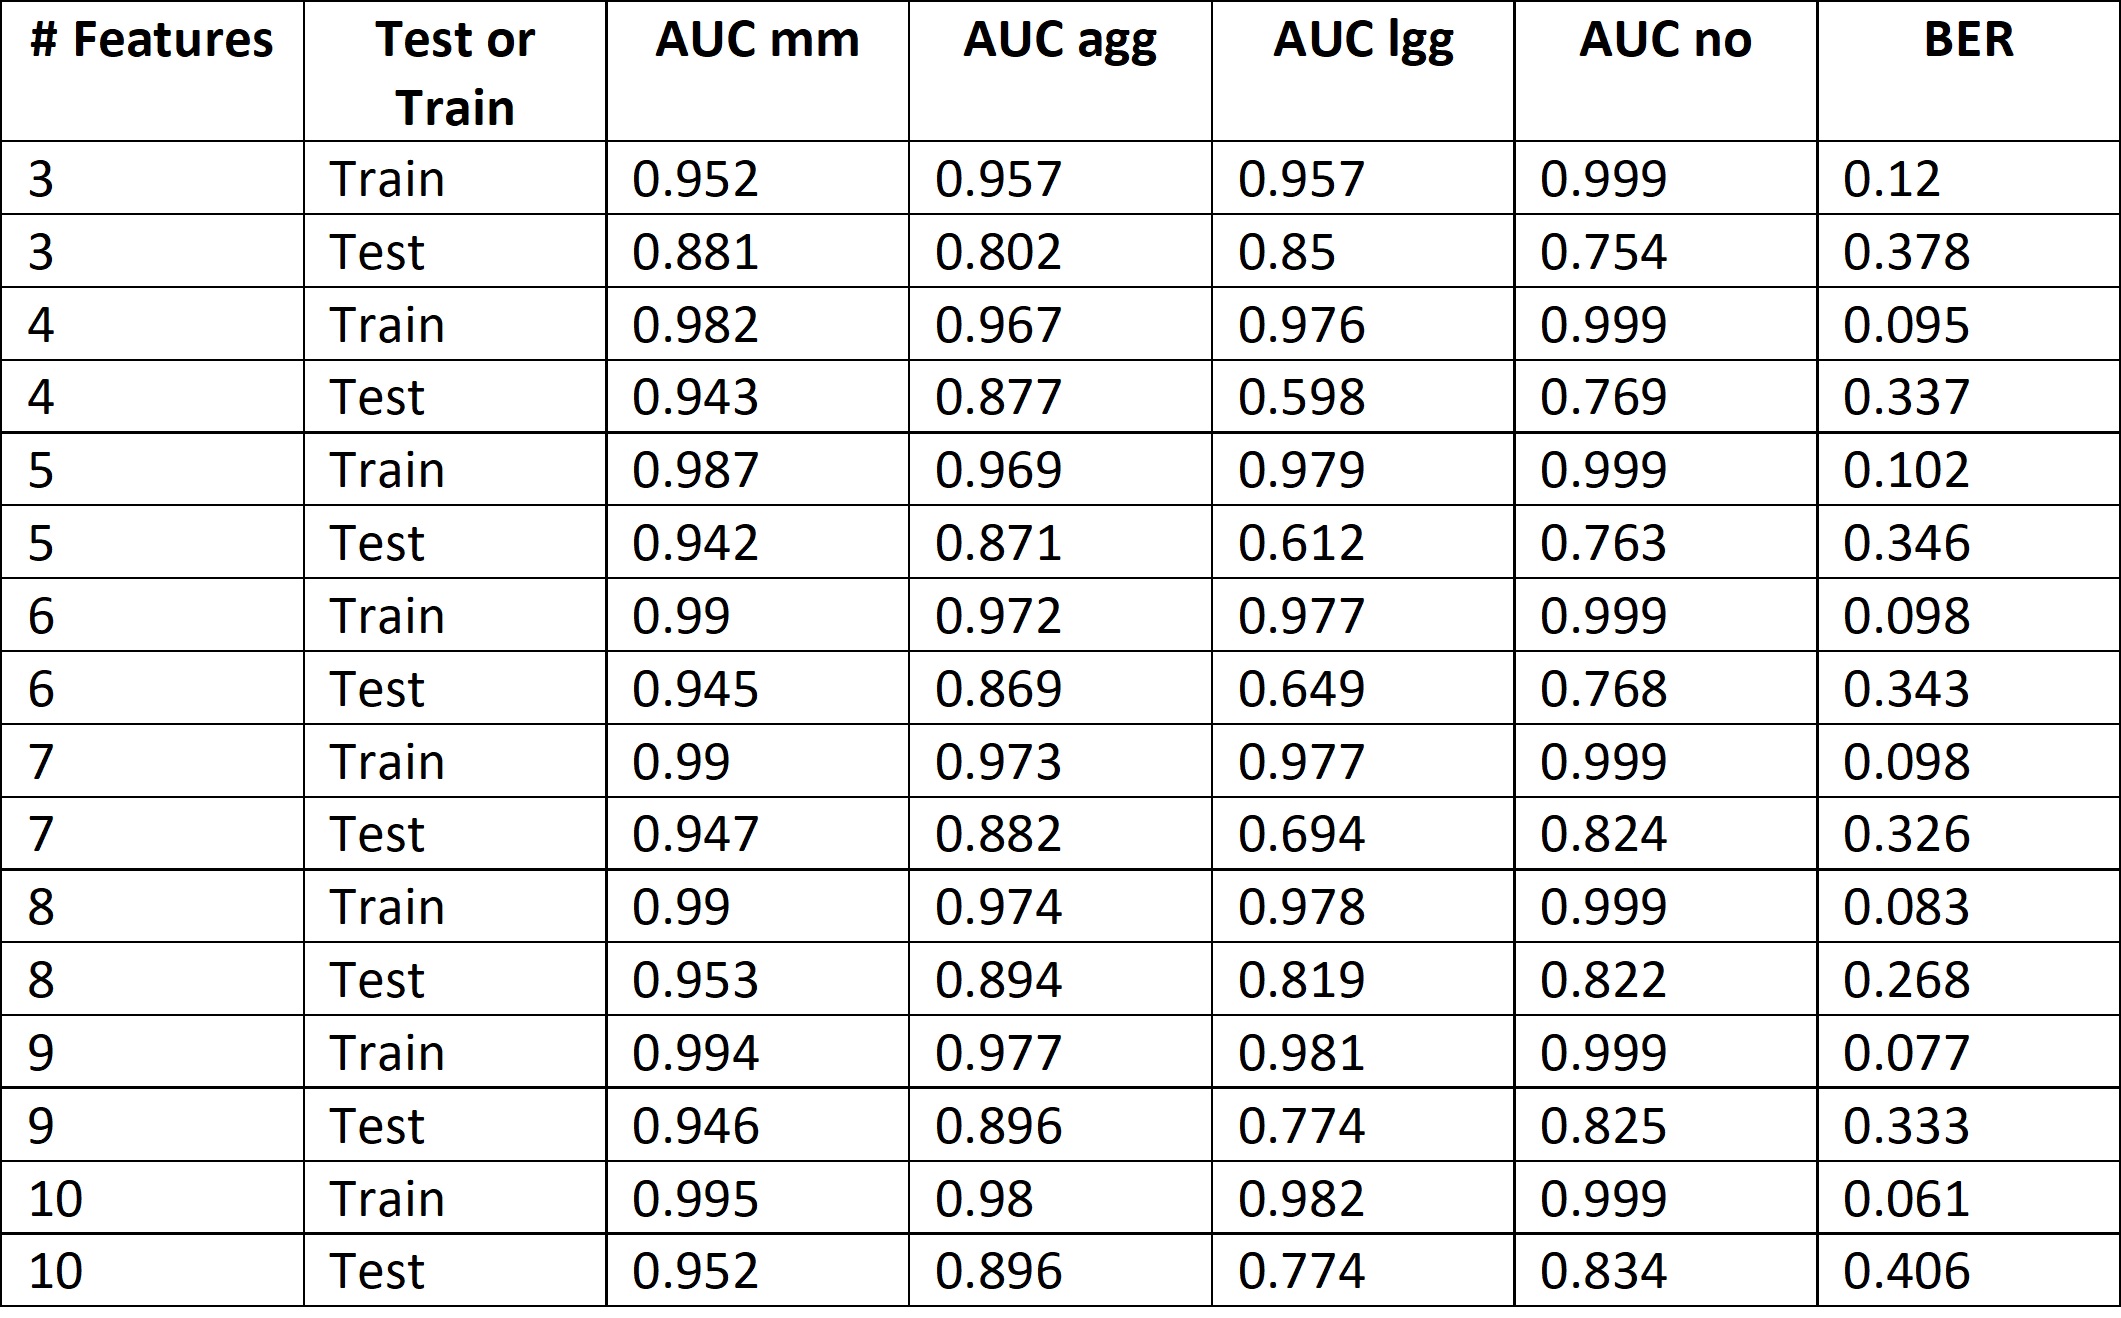
Figure 3.
Classifier performance: AUC and BER.
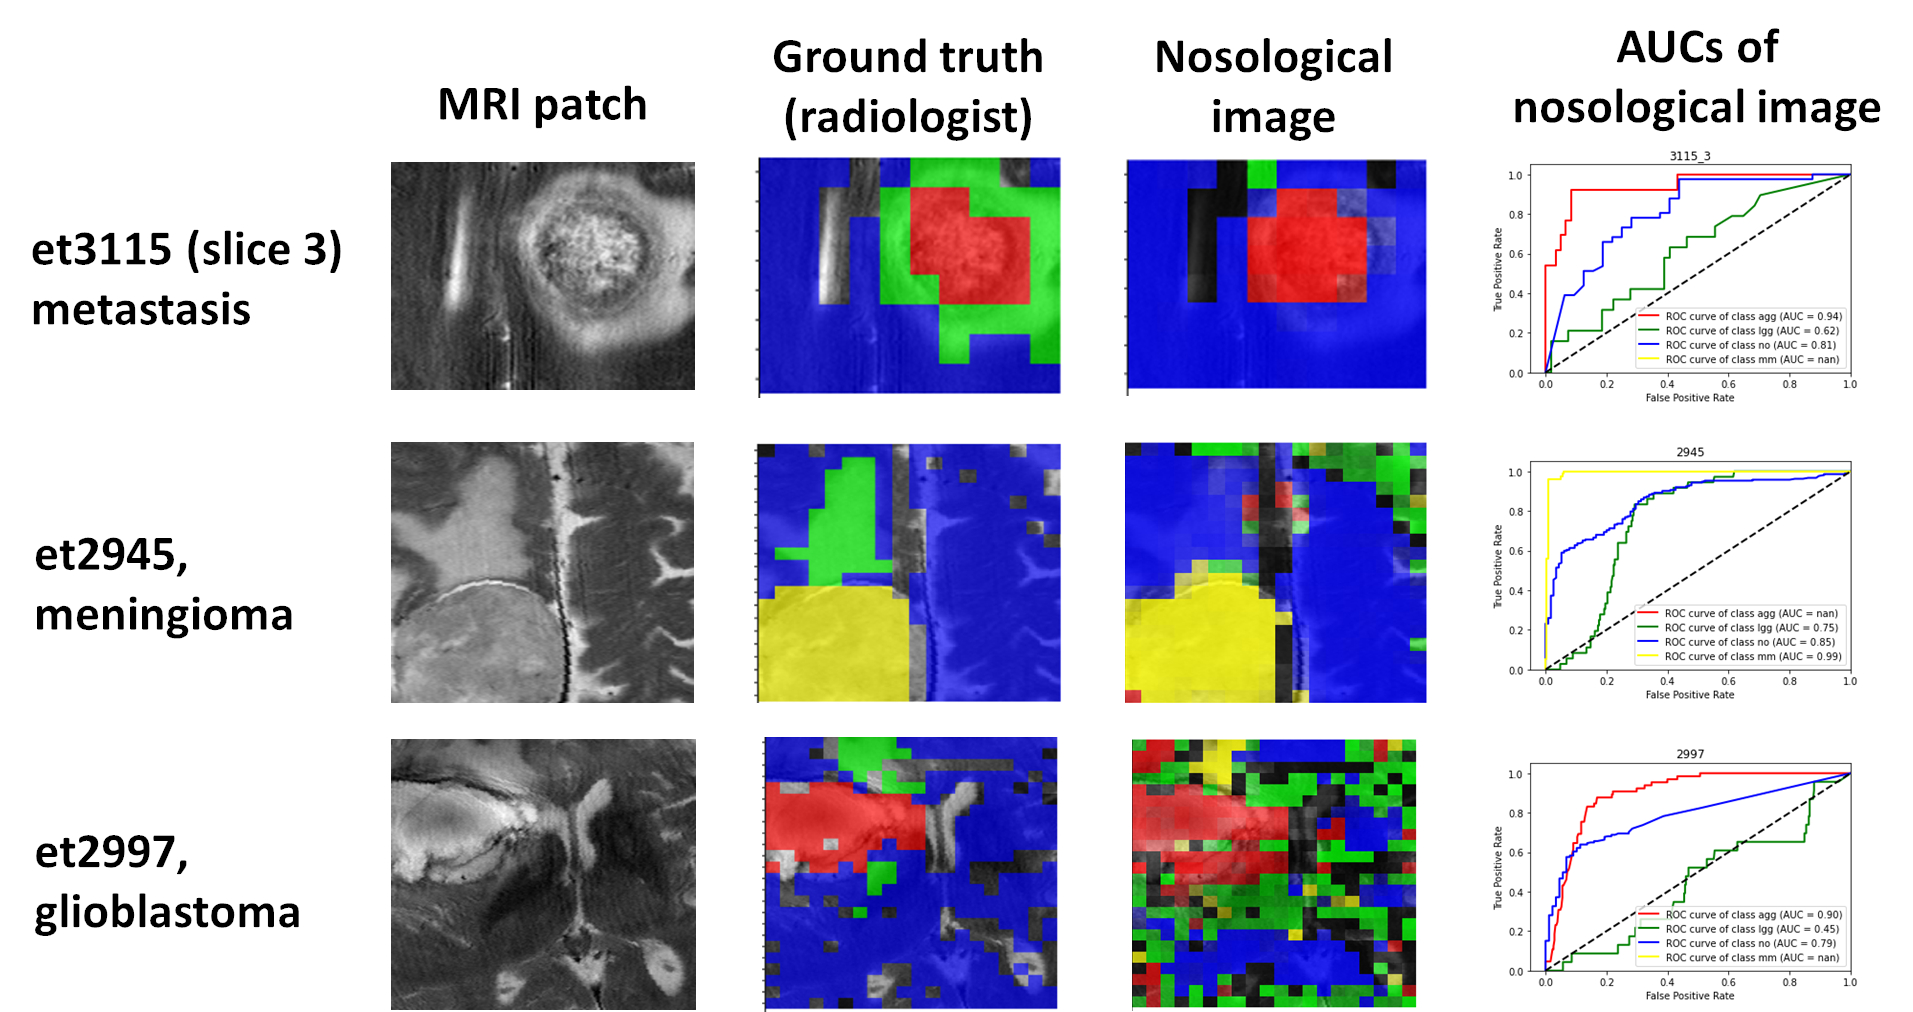
Figure
4. Nosological images of three illustrative test set cases.
DOI: https://doi.org/10.58530/2023/2122