2120
The Value of Multiparametric MRI-based Radiomics Features in Distinguishing Primary Central Nervous System Lymphoma from High-grade Glioma1Clinical medicine school of Ningxia Medical University, Yinchuan, China, 2Department of Radiology ,the First Hospital Affiliated to Hainan Medical College, Haikou, China, 3GE Healthcare, Beijing, China, 4Department of Radiology, General Hospital of Ningxia Medical University, Yinchuan, China
Synopsis
Keywords: Tumors, Brain
In this study, we aim to explore the radiomics model constructed by a single sequence or a combined sequences whether has the same or better performance, and to explore the effect of different choices of region of interest to the performance of radionmics model.Summary of Main Findings
Multiparametric MRI-based radiomics model has good diagnostic performance in differentiating PCNSL from high-grade glioma. Radiomics models has different performance which constructed by extracting features from different regions of interest.Synopsis
In this study, we aim to explore the radiomics model constructed by a single sequence or a combined sequences whether has the same or better performance, and to explore the effect of different choices of region of interest to the performance of radiomics model.Introduction
Radiomics as a new research field which transformed medical imaging from a simple diagnostic tool into a huge source of clinical data1, 2. In some atypical cases, high-grade gliomas may display minimal or absent necroses and PCNSL also may show central necroses or cystic degeneration3. Currently, the standard diagnostic methods for suspected PCNSL include stereotactic biopsy and histopathological analysis, but has highly complication rate overall4. Current guidelines suggest maximal surgical resection plus chemoradiation therapy for the treatment of glioma, however, the treatment of PCNSL is different from glioma5. Therefore, the correct and early diagnosis can avoid unnecessary surgical resection.The purpose of the study was to explore the value of multiparametric MRI-based radiomics model for noninvasively distinguishing PCNSL from high-grade glioma, and to expore the influence of region of interest to the performance of radiomics.Material and Methods
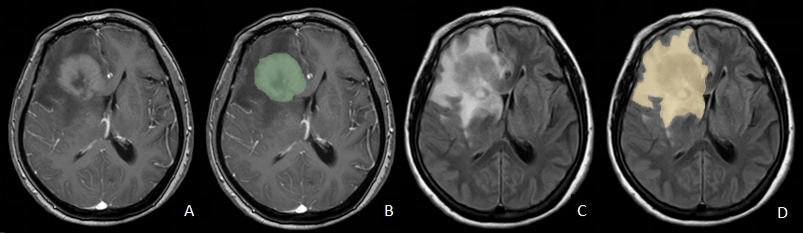
A total of 99 patients with high-grade gliomas(n=73) and PCNSLs(n=26) who underwent surgical resection or stereotactic biopsy in our hospital from January 2016 to July 2022. All patients underwent MR exams on a 3.0 T scanner (SIGNA™ Excite HD; GE Healthcare, Milwaukee, WI, USA) with an 8-channel brain coil before surgery, The parameters were as follows:T2fluid-attenuated inversion recovery(T2FLAIR), TR/TE 7800ms/140ms; contrast-enhanced T1-weighted (CE-T1W), TR/TE 2300ms/13ms; FOV=240mm×240mm, thickness/gap=6/1mm, A total volume of 0.1 mmol/kg of Gd-DTPA was injected intravenously for post-contrast T1W imaging and at a flow rate of 2.0 ml/s. All images of preoperative routine MRI sequences were collected included T2FLAIR and CE-T1WI. and all patients were randomly divided into training (n=69) and testing (n=30) sets at 7:3 ratios. 3D-SLICER software was used to delineate the region of interest (ROI), ROI1 included the core of tumor (necrotic plus enhancing) excluding peritumoral edema as well, ROI2 included tumor core and peritumoral edema. ROI1 was delineated on the axial CE-T1WI, and each ROI were delineated on the T2-FLAIR images (Figure 1). We used the SMOTE (Synthetic Minority Over-sampling Technique) method to solve the imbalance of the database. The radiomics features were extracted by the "pyradiomics" package in python software. Firstly, Independent Student’s t-test or Mann-Whitney U test was used to initially screen out the features with statistically significant differences (P < .05), and then the collinear features were removed by Pearson correlation analysis and the least absolute shrinkage and selection operator (LASSO), the feature set of minimum AIC were retained by multiple stepwise regression. The radiomics score (RADSCORE) of each patient was calculated. We used the logistic regression algorithm to construct models for CE-T1WI, T2FLAIR and a combined model as well. Evaluate classifier performance by calculating accuracy, sensitivity, specificity, and area under the ROC curve (AUC).Results
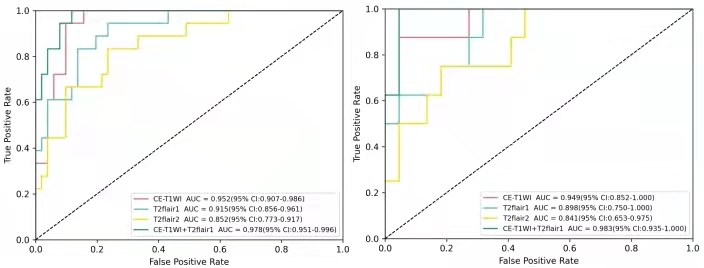
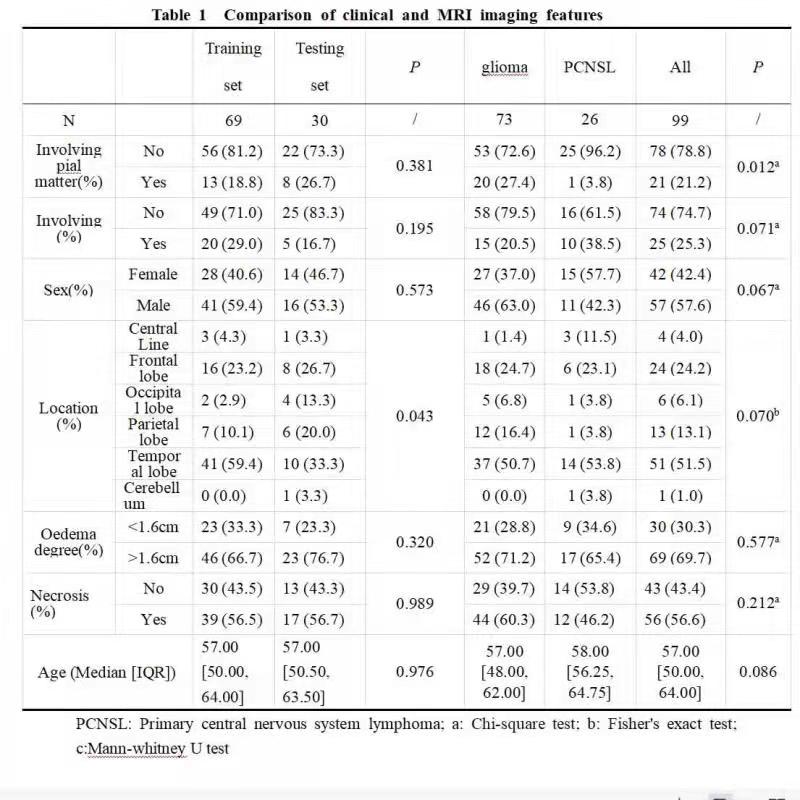
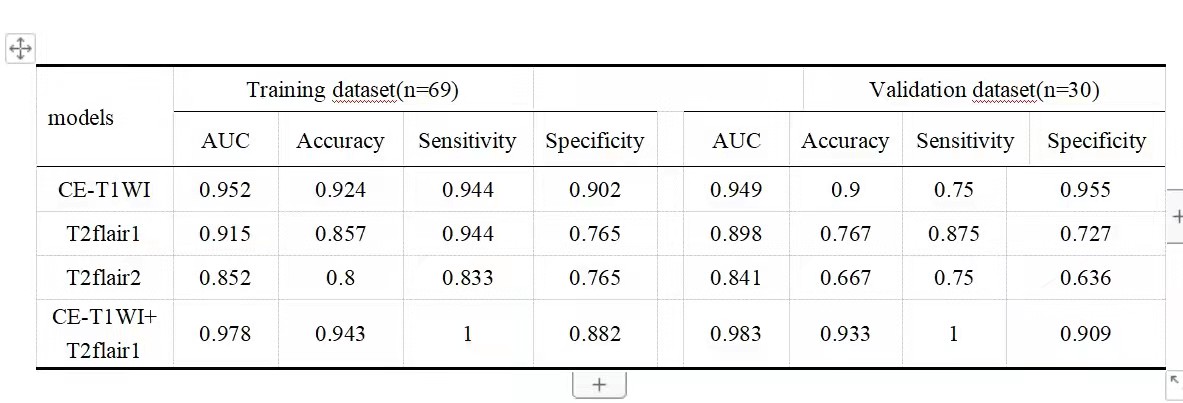
No statistically significant difference was found in the baseline characteristics between the glioma and PCNSL (p > .05), there was tiny statistically differences in location of tumor between training and testing groups, the rest of the characteristics which had none statistically differences between training and testing groups (Table 1). At last, each sequence can extract a number of 1037 radiomic features included first-order statistical features, shape features, gray level co-occurrence matrix, gray level dependence matrix, gray level run length matrix, gray level size zone matrix, neighboring gray tone dependence matrix and filtering features. After feature screening, there are 12, 11, 6, 15 features for CE-T1WI, T2FLAIR1, T2FLAIR2 and CE-T1WI+T2Flair1, respectively. Among single-sequence radiomics models, the CE-T1WI model had the best prediction performance, The T2FLAIR1 model had better performance than the T2FLAIR2, The AUC values of the combined model based on CT-T1WI+T2-FLAIR1 in the training and the testing groups were 0.978 and 0.983, respectively (Table2; Figure2).Discussion and Conclusion
Our study demonstrated that the radiomics model built by features from the core of tumor (necrotic puls enhancing) excluding peritumoral edema had better performance than the whole tumor including peritumoral edema. Among single-sequence radiomics models, the CE-T1WI model had the best prediction performance, because CE-T1WI contains information of regional angiogenesis and the destruction of the blood-brain barrier in the tumor. The combined model increases the accuracy of model, the reason may be that complementary information among multiparametric MRI could provide a more comprehensive understanding of tumor heterogeneity. Wei Xia et al6 established multiparametric MRI-based radiomics model to identify GBM and PCNSL, in the single-sequence radiomics models, the model based on CT-T1WI performed best, and the AUC was 0.897 based on FLAIR sequence, which is in accordance with our results. To conclude, Multi-parametric MRI-based radiomics model had good diagnostic performance in differentiating PCNSL from high-grade glioma, among single-sequence radiomics models, the CE-T1WI model had the best prediction performance, the combined model increased the accuracy of the model, the features of tumor core area are more related to tumor classification.Acknowledgements
Thank you very much for reading my contribution in your busy schedule. I wish you good health and all the best.References
1.Fatania K, Mohamud F, Clark A, et al. Intensity standardization of MRI prior to radiomic feature extraction for artificial intelligence research in glioma—a systematic review. European Radiology2022;32(10):7014-7025.
2.Priya S, Liu Y, Ward C, et al. Radiomic based machine learning peformance for a three class problem in neuro-oncology: time to test the waters?. Cancers2021;13(11):2568.
3.Tariciotti L, Caccavella V M, Fiore G, et al. A deep learning model for preoperative differentiation of glioblastoma, brain metastasis and primary central nervous system lymphoma: a pilot study. Frontiers in Oncology2022;12:816638.
4.Cassinelli Petersen G I, Shatalov J, Verma T, et al. Machine learning in differentiating gliomas from primary cns lymphomas: a Systematic review, reporting quality, and risk of bias assessment. American Journal of Neuroradiology2022;43(4):526-533.
5.Chen T, Liu Y, Wang Y, et al. Evidence-based expert consensus on the management of primary central nervous system lymphoma in China. Journal of Hematology & Oncology2022;15(1):136.
6.Xia W, Hu B, Li H, et al. Multiparametric-MRI-based radiomics model for differentiating primary central nervous system lymphoma from glioblastoma: development and cross-vendor validation. J Magn Reson Imaging2021;53(1):242-250.
Figures