2118
The application value of Radiomics combined with clinical features and genomics in predicting glioma survival1Department of Imaging Diagnosis, The Affiliated Hospital of Inner Mongolia Medical University, Hohhot, China, 2MR Scientific Marketing, Siemens Healthineers, Shanghai, China
Synopsis
Keywords: Tumors, Radiomics
This study aimed to explore the value of MR multi-sequence radiomics combined with clinical features and genomics in predicting the survival of patients with glioma. Results showed that the clinical and imaging characteristics, radiomics features, and genotype status were important risk factors for glioma survival. The combination of multiple factors can better predict and evaluate the prognosis of glioma. Multi sequence based radiomics combined with clinical and imaging features and genotype status can better reflect the heterogeneity and prognosis of glioma.Introduction
Glioma is the most common histological type of primary malignant tumors of the central nervous system, and it is also an invasive tumor of the central nervous system, showing different genetic heterogeneity, epigenetic characteristics and clinical prognosis. MRI is the main examination method to diagnose and evaluate the curative effect of glioma. The grade and prognosis of glioma can be preliminarily predicted by interpreting conventional MRI and functional MRI images. The aim of this study was to explore the value of MR multi-sequence radiomics combined with clinical features and genomics in predicting the survival of patients with glioma.Methods
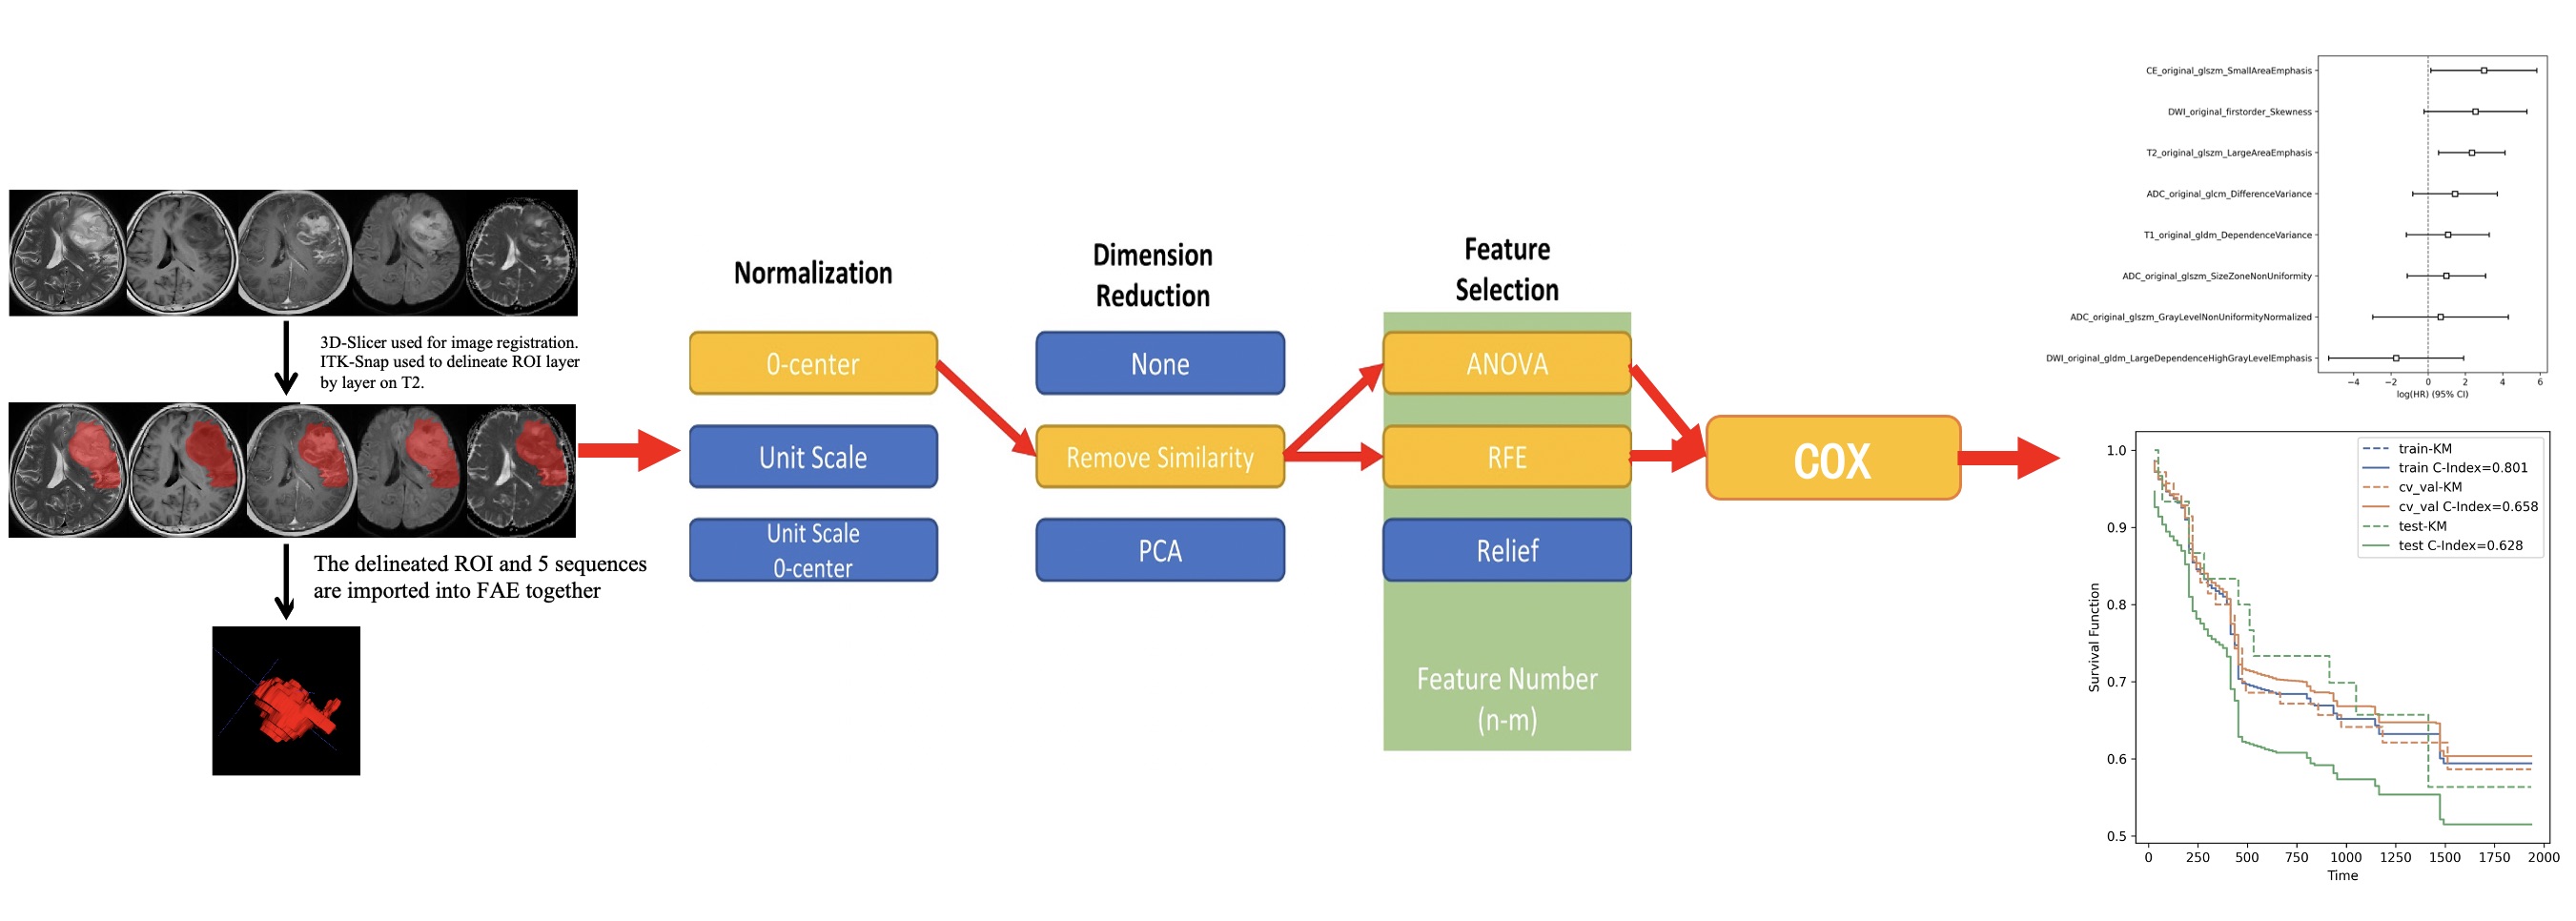
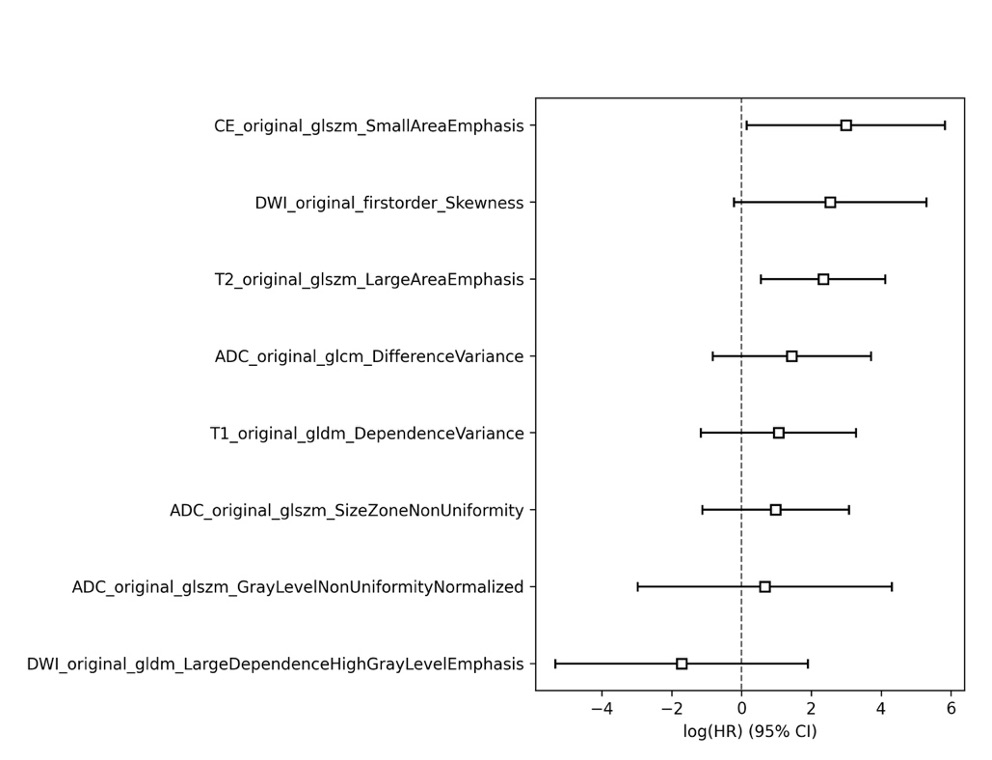
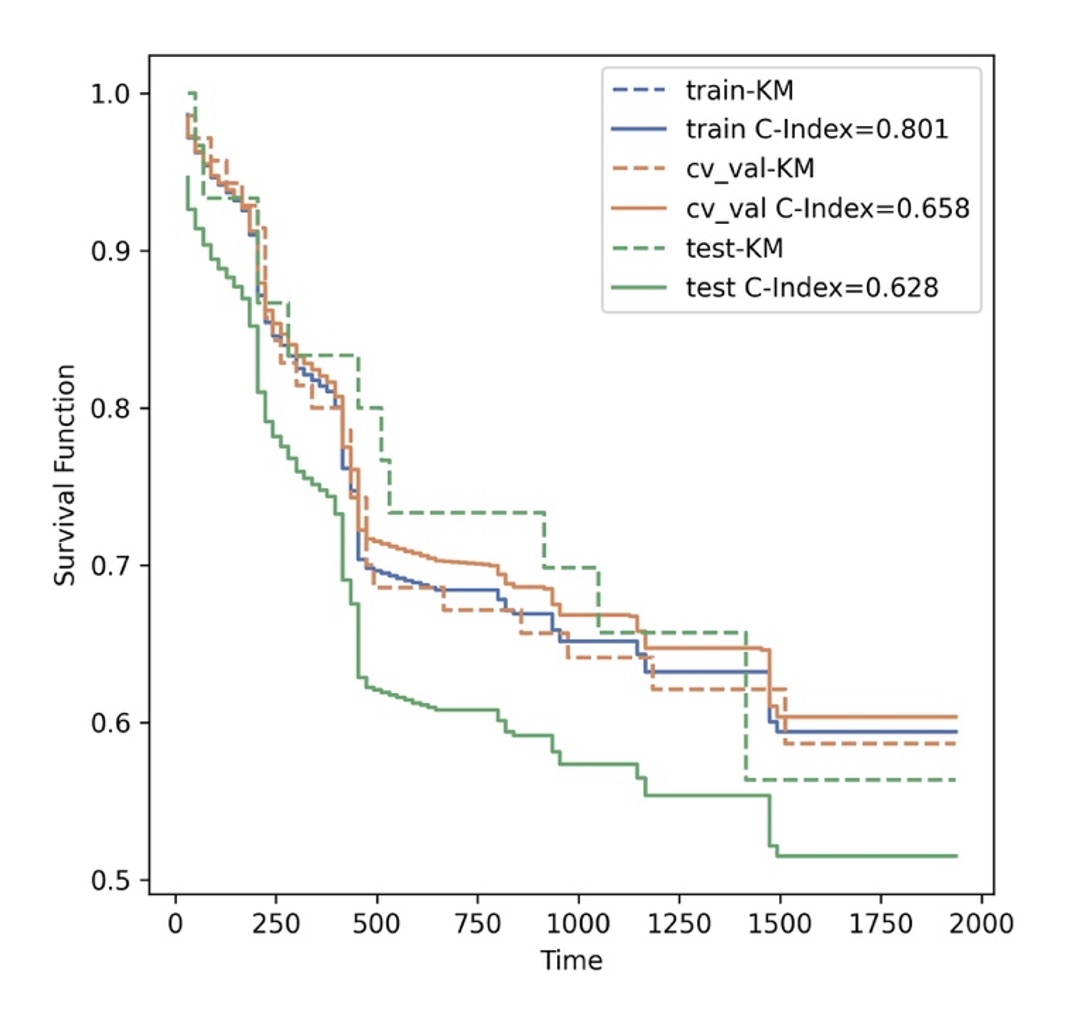
100 patients diagnosed as brain glioma and treated in our hospital from July 2017 to January 2020 were enrolled in this study. All patient’s pathological types and grades confirmed by pathology after surgery were collected. The clinical features about gender, age, tumor related imaging characteristics, overall survival (OS), history of radiotherapy and chemotherapy, and genotype status of the patients were counted by following up and consulting medical records and evaluating PACS system images. A total of 535 radiomic features were extracted, which were divided into training sets and test sets according to the ratio of 7:3 and input into survival analysis module of the Python (3.7.6) based FeAture Explorer Pro (FAE, V0.5.2) software. After the application of multifactor COX regression analysis, eight features with statistically significant differences were finally screened, and the corresponding HR values were used to evaluate the risk prediction of radiomic features on the OS (Fig.1). 77 out of 100 patients had completely genotype status information, including IDH, MGMT, TERT, 1p/19q. Kaplan-Meier curve and Log-Rank test were used to analyze the difference of survival time among the above four genotypes, gender, age, history of radiotherapy and chemotherapy, and WHO classification. Finally, the clinical and imaging characteristics, multisequence radiomic features and genotype features with statistically significant differences (P<0.05) were included as risk factors, and Cox proportional risk model was constructed to analyze and explore the risk factors affecting the OS of patients.Results
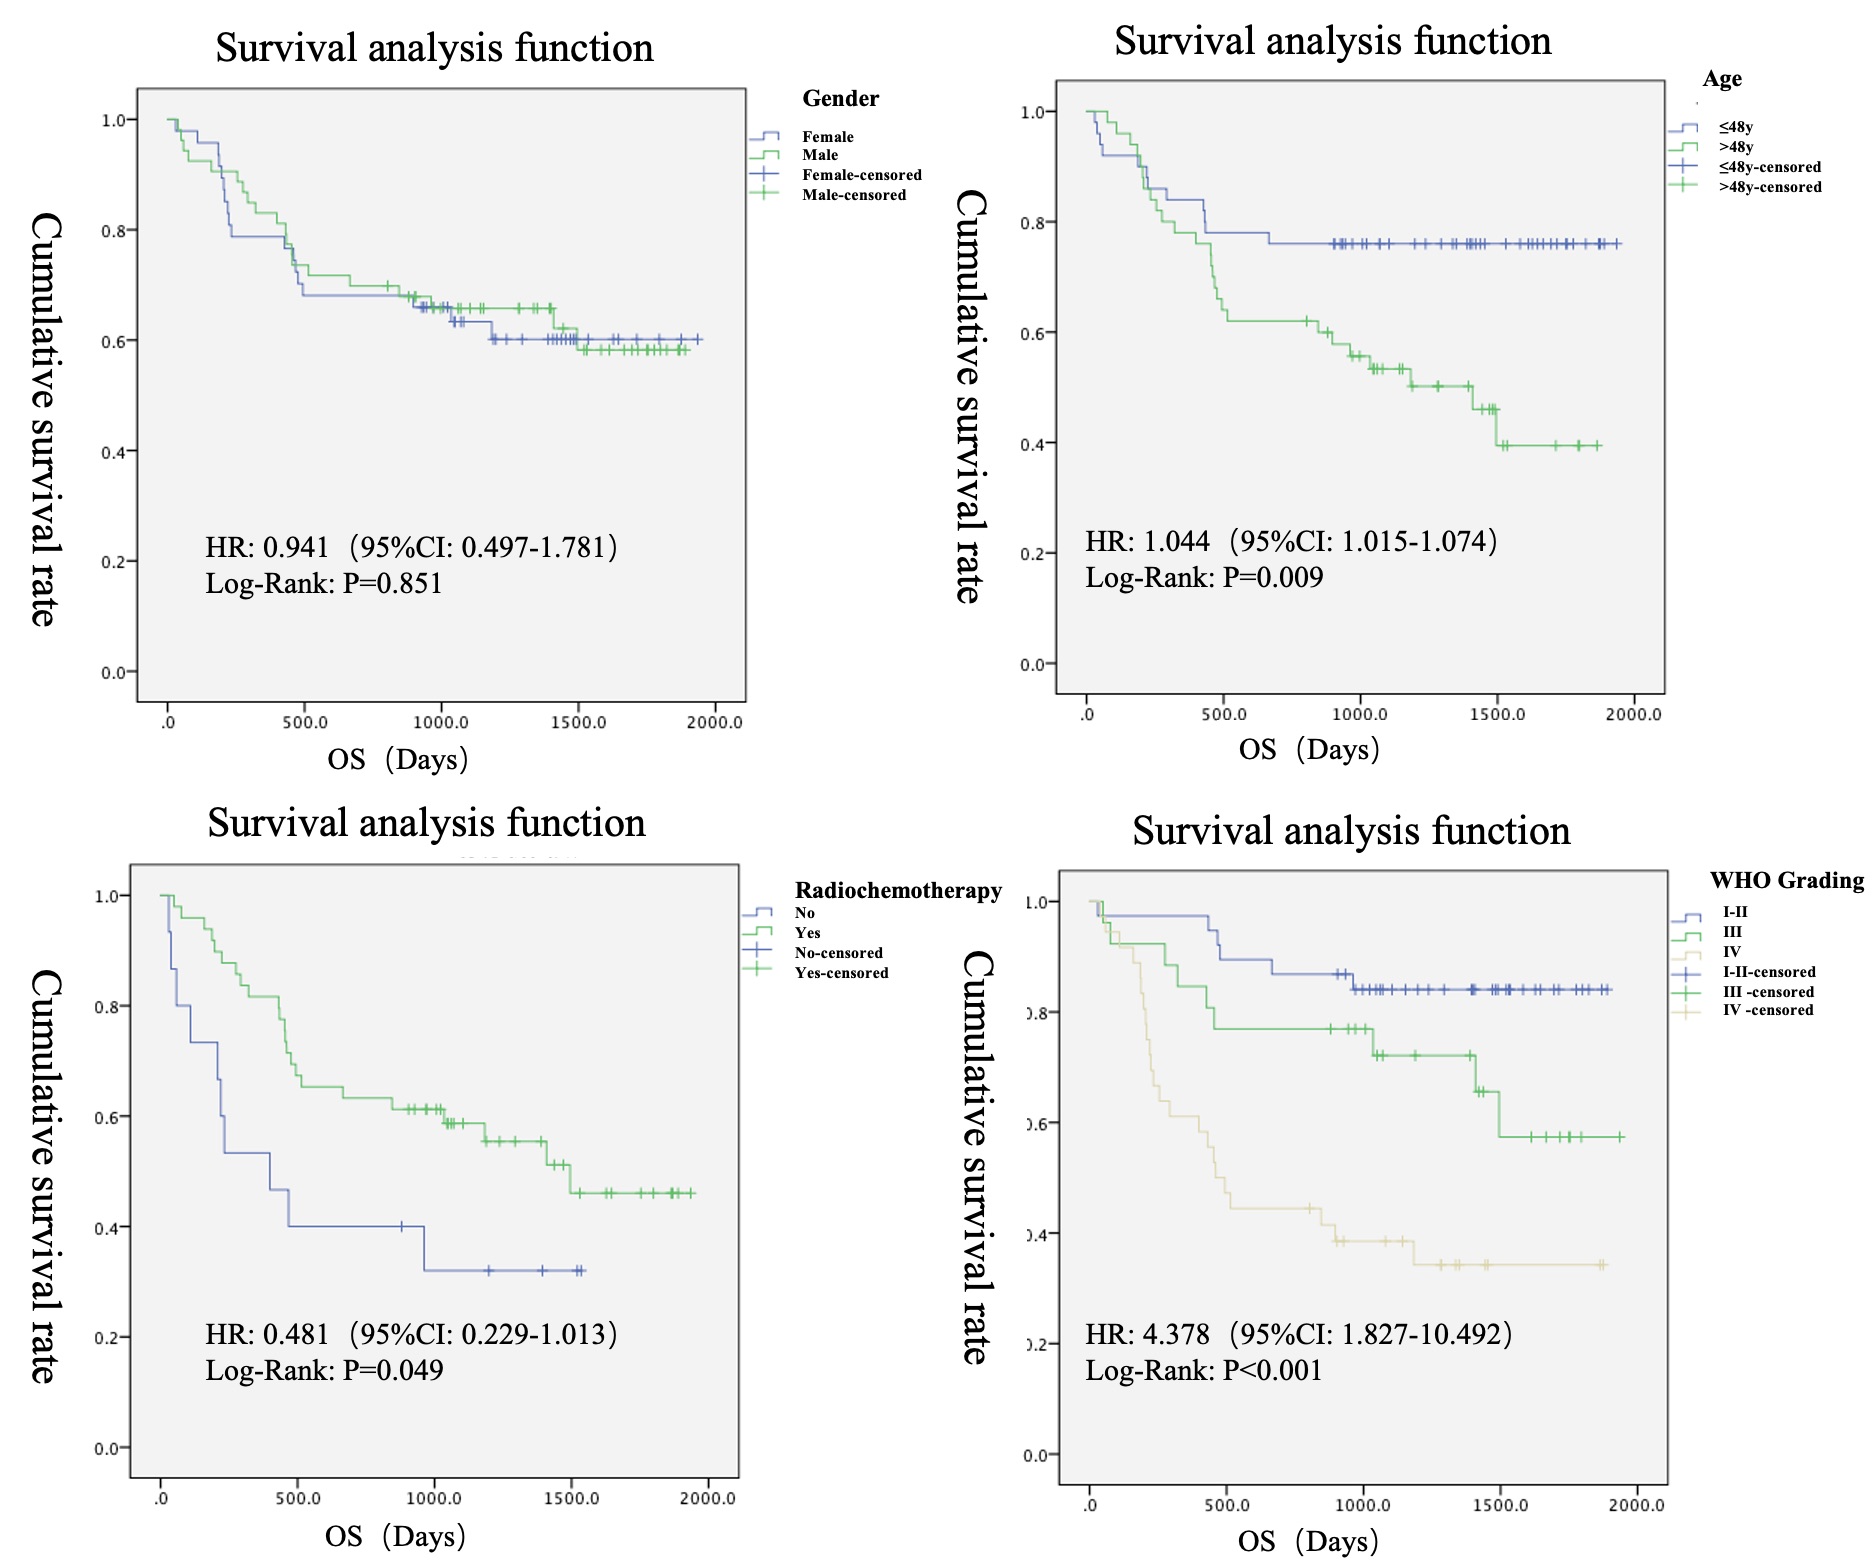
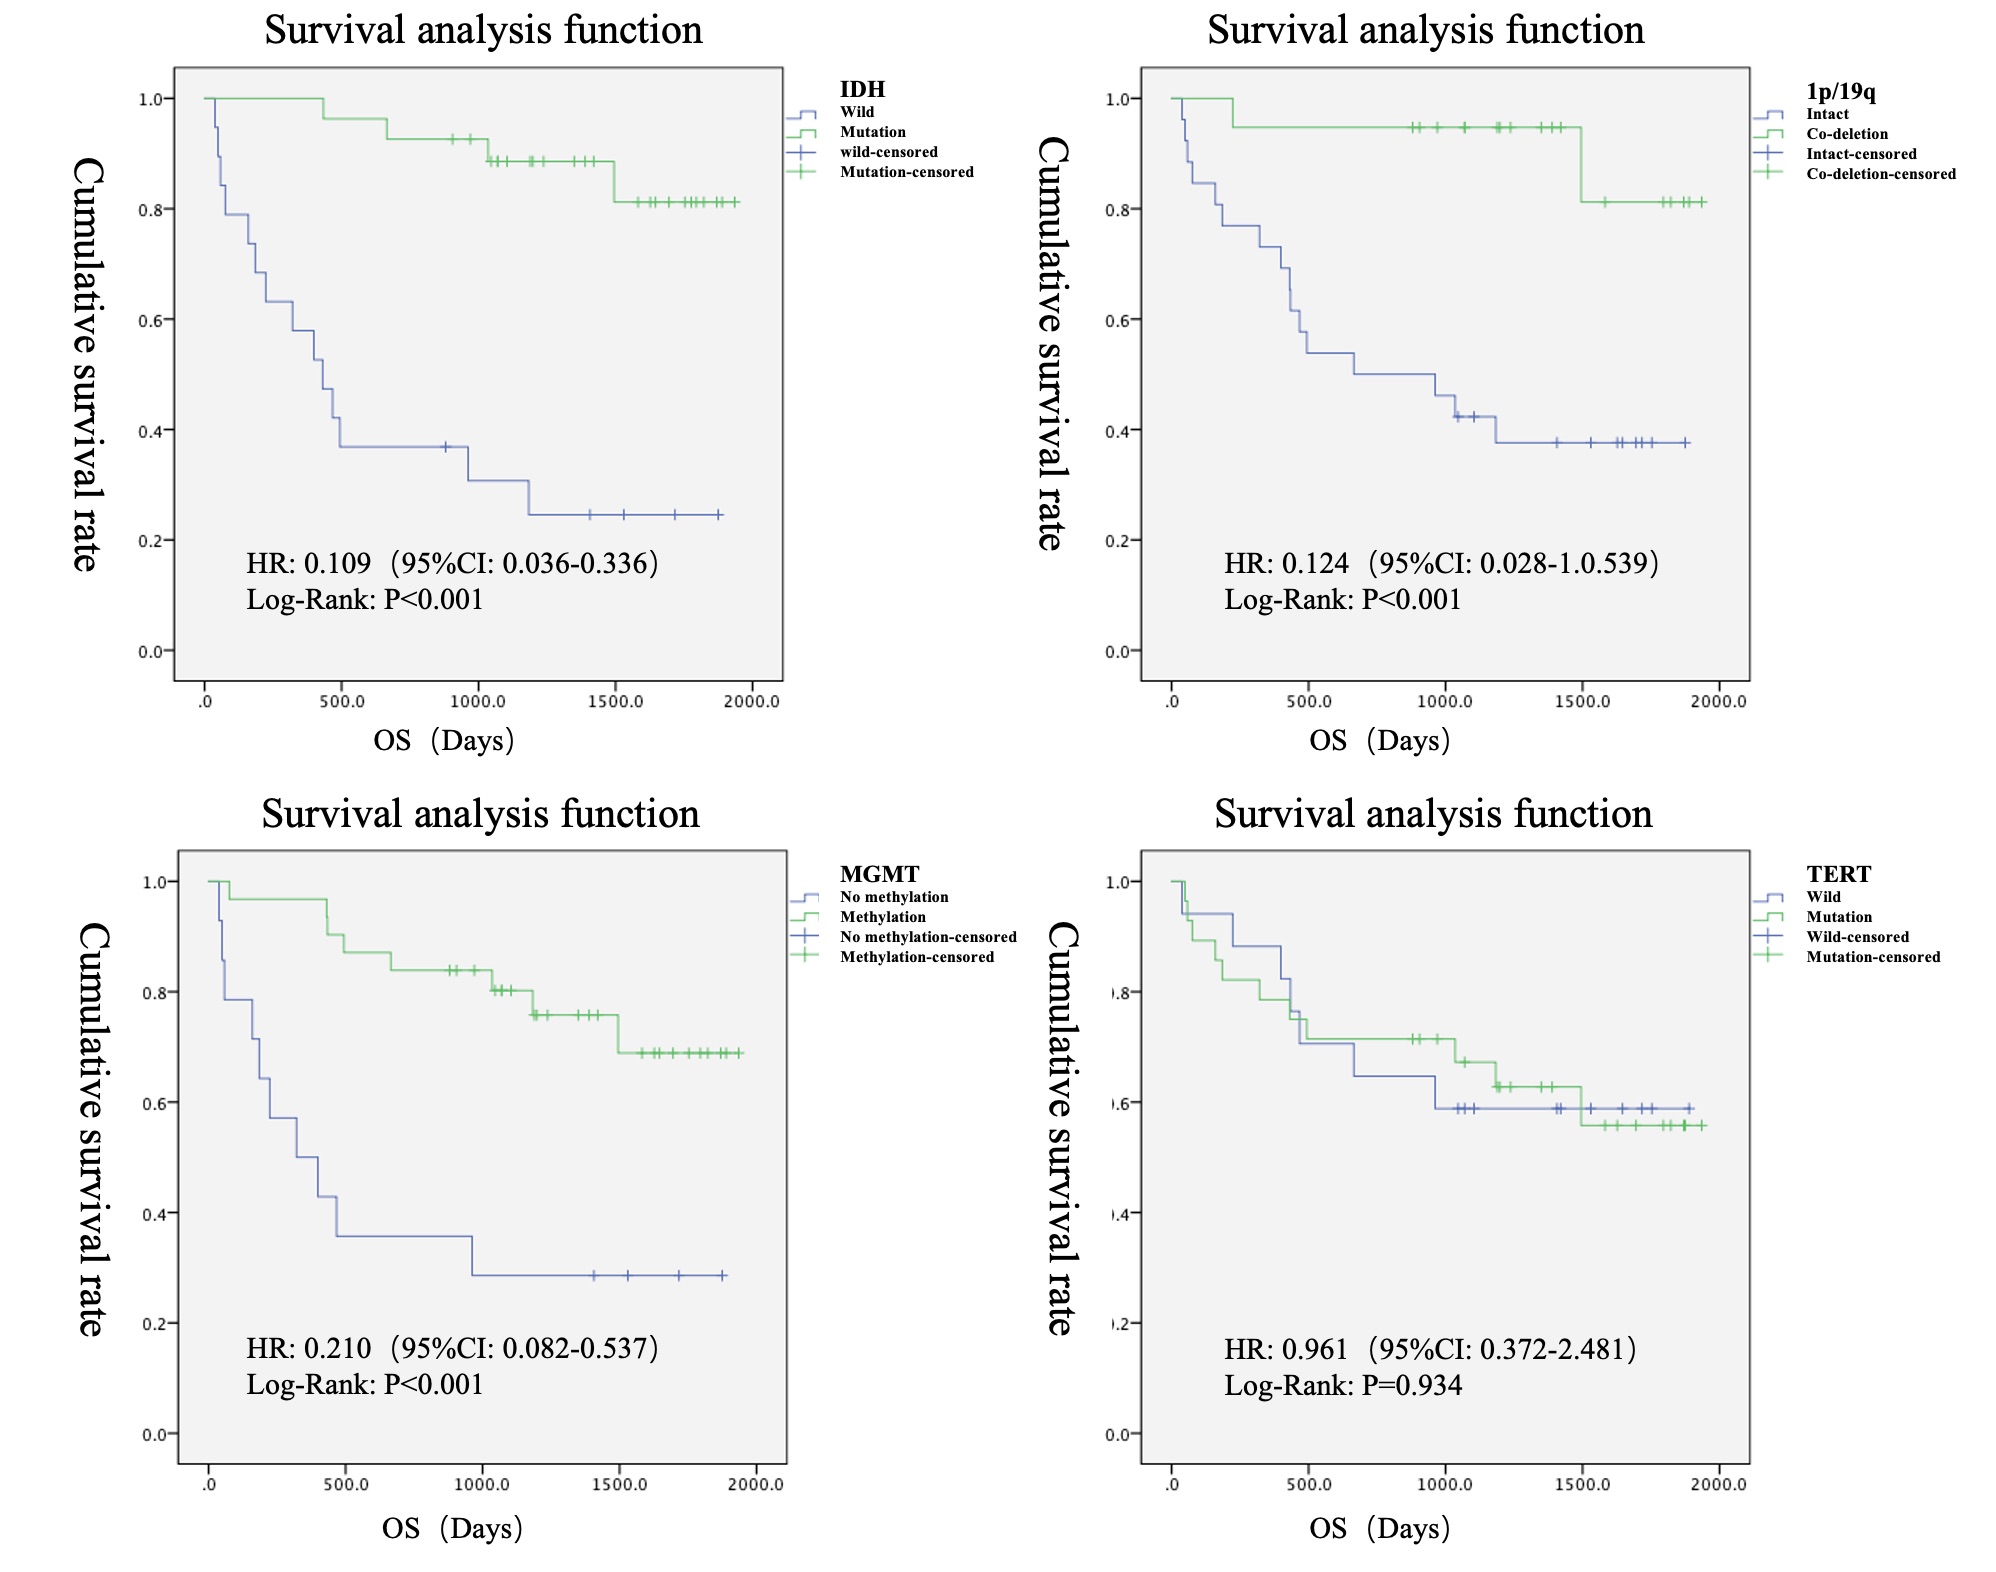
Among the clinical factors, there was a statistically significant difference (P<0.05) in the survival time between the groups of patients' age, history of radiotherapy and chemotherapy, and WHO classification (Fig.2). Among the genotype factors, the survival time difference of IDH gene, MGMT gene and 1p/19 chromosome in different states was statistically significant (P<0.05) (Fig.3). Among the multiple sequence radiomics features, two features had significant statistical significance in the prediction of glioma survival risk (P<0.05) (Fig.4,5). The Cox proportional risk model constructed with clinical and imaging characteristics, polygenetic status, and multisequence radiomic features showed that the WHO grading of glioma had a statistically significant impact on survival time (HR=1.989, 95% CI 1.068-3.704, P=0.03); The effect of postoperative radiotherapy and chemotherapy on survival time was statistically significant (HR=0.209, 95% CI 0.074-0.592, P=0.003); T1_original_gldm_DependenceVariance on survival time was statistically significant (HR=1.067, 95% CI 1.014-1.123, P=0.013); radiomic Feature T2_original_glszm_LargeAreaEmphasis on survival time was also statistically significant (HR=1.001, 95% CI 1.0-1.001, P=0.009); The methylation of MGMT gene was more significant than that of non methylation, which had a statistically significant effect on survival time (HR=0.012, 95% CI 0.001-0.134, P<0.001); The co-deletion status of 1p/19q had a statistically significant effect on survival time (HR=0.122, 95% CI 0.022-0.694, P<0.05); TERT gene mutation had a statistically significant effect on survival time compared with wild type (HR=25.707, 95% CI 3.654-180.851, P<0.001).Conclusion
The clinical and imaging characteristics, radiomics features, and genotype status were important risk factors for glioma survival. The combination of multiple factors can better predict and evaluate the prognosis of glioma. Multi sequence based radiomics combined with clinical and imaging features and genotype status can better reflect the heterogeneity and prognosis of glioma. More extensive application in the future will help to diagnosis, prognosis evaluation and treatment decision-making of glioma.Acknowledgements
We thanks Bo Li, Peng Wang and Zhiyue Hao for their efforts in data collection and processing.References
[1] F Bray, J Ferlay, I Soerjomataram, et al. Global cancer statistics 2018: GLOBOCAN estimates of incidence and mortality worldwide for 36 cancers in 185 countries[J]. CA Cancer J Clin. 2018; 68 (6): 394-424.
[2] Q T Ostrom, G Cioffi, H Gittleman, et al. CBTRUS Statistical Report: Primary Brain and Other Central Nervous System Tumors Diagnosed in the United States in 2012-2016[J]. Neuro Oncol. 2019; 21 (Suppl 5): v1-v100.
[3] D N Louis, A Perry, G Reifenberger, et al. The 2016 World Health Organization Classification of Tumors of the Central Nervous System: a summary[J]. Acta Neuropathol. 2016; 131 (6): 803-820.
[4] R Stupp, S Taillibert, A Kanner, et al. Effect of Tumor-Treating Fields Plus Maintenance Temozolomide vs Maintenance Temozolomide Alone on Survival in Patients With Glioblastoma: A Randomized Clinical Trial[J]. JAMA. 2017; 318 (23): 2306-2316.
[5] M T Ballo, N Urman, G Lavy-Shahaf, et al. Correlation of Tumor Treating Fields Dosimetry to Survival Outcomes in Newly Diagnosed Glioblastoma: A Large-Scale Numerical Simulation-Based Analysis of Data from the Phase 3 EF-14 Randomized Trial[J]. Int J Radiat Oncol Biol Phys. 2019; 104 (5): 1106-1113.
[6] D N Louis, H Ohgaki, O D Wiestler, et al. The 2007 WHO classification of tumours of the central nervous system[J]. Acta Neuropathol. 2007; 114 (2): 97-109.
[7] L Macyszyn, H Akbari, J M Pisapia, et al. Imaging patterns predict patient survival and molecular subtype in glioblastoma via machine learning techniques[J]. Neuro Oncol. 2016; 18 (3): 417-425.
[8] S Bakas, M Reyes, A Jakab, et al. Identifying the best machine learning algorithms for brain tumor segmentation, progression assessment, and overall survival prediction in the BRATS challenge[J]. arXiv [Preprint]. 2018; arXiv1811: 02629.
[9] N Cancer Genome Atlas Research, D J Brat, R G Verhaak, et al. Comprehensive, Integrative Genomic Analysis of Diffuse Lower-Grade Gliomas[J]. N Engl J Med. 2015; 372 (26): 2481-2498.
[10] Y Tan, S T Zhang, J W Wei, et al. A radiomics nomogram may improve the prediction of IDH genotype for astrocytoma before surgery[J]. European Radiology. 2019; 29 (7): 3325-3337.
Figures