2117
Grading brain astrocytoma using convolutional neural network: contrast-enhanced T1 and susceptibility-weighted imaging1National Sun Yat-Sen University, Kaohsiung, Taiwan, 2National Taiwan University of Science and Technology, Taipei, Taiwan, 3Kaohsiung Veterans General Hospital, Kaohsiung, Taiwan, 4National Yang-Ming University, Taipei, Taiwan
Synopsis
Keywords: Tumors, Susceptibility
Susceptibility-weighted imaging (SWI) has shown its potential to discriminate between high-grade and low-grade astrocytoma. In this study, we developed a fully automatic diagnosis system for astrocytoma grading by using convolutional neural network with contrast-enhanced T1-weighted images and SWI, separately or jointly, as input data. The results show that the model with both imaging modalities as input data provides high accuracy in astrocytoma grading and is potentially helpful for clinical diagnosis.
Introduction
Susceptibility-weighted imaging (SWI) has shown its potential to discriminate between high-grade and low-grade brain astrocytoma because of its sensitivity to paramagnetic substances, such as angiogenesis and intratumoral hemorrhage. 1 In this study, we implement a deep-learning method for automatic segmentation of the tumor region as well as tumor grading on astrocytoma. Contrast-enhanced T1-weighted images (CE-T1WI) and/or SWI are provided as the input data for the convolutional neural network. The performance of tumor segmentation and grading with different input images is compared.Methods
This study was approved by the local institutional review board, and written informed consents were obtained from all patients. We collected datasets from 65 patients with astrocytoma on a 1.5-T scanner (Signa HDx, GE Healthcare, Milwaukee, WI). Tumors were classified into two groups based on pathological reports: high-grade (n = 50, WHO grade III and grade IV) and low-grade astrocytoma (n = 15, WHO grade II). Pre-contrast SWI was obtained by using a 3D flow-compensated gradient-echo sequence with TR/TE: 50/39 ms, flip angle: 18 degrees, FOV: 220 mm, matrix size: 288×256, slice thickness: 2.5 mm, slice number: 28-38. CE-T1WI was acquired by inversion-prepared 3D spoiled gradient echo sequence with TR/TE/TI = 92/4.2/400 ms, flip angle: 20 degrees, FOV: 240 mm, matrix size = 288×160×124, and slice thickness: 1.2 mm. The SWI reconstruction consisted of 2D high-pass Gaussian filtering, normalization, and four times of phase-mask multiplications. 2 CE-T1WI was co-registered to SWI by a rigid-body model to avoid inter-scan motion, and the co-registered CE-T1WI was resampled to match the image resolution and coverage of SWI. The signal intensity of each 3D volume was normalized to a range of 0 to 1. All tumors were manually outlined by an experienced neuroradiologist on the co-registered images. After these pre-processing steps, we had 1830 images in each of the SWI, CE-T1WI, and tumor ROI datasets.The deep-learning-based segmentation and classification were implemented using the TensorFlow framework and the Python environment. We adapted the 2D SegNet 3 model for pixel-wise tumor classification. Subjects were equally divided into five groups to perform five-fold cross validation. In the training phase, image augmentation using random rotation and flipping was utilized to prepare high-grade images, low-grade images, and images containing no tumor in a number ratio of 2:2:1 from the original ratio of 1:3.6:3.4. Three models (i.e., CE-T1WI only, SWI only, and CE-T1WI+SWI) were trained independently by using optimizer: Adam, the L2 regularization: 10-7, and training steps: 100,000. The output of each model was the corresponding tumor mask labeled as 0 (non-tumor/background), 1 (low grade), and 2 (high grade). The testing results of all slices from one patient was merged to determine the tumor grade, either high grade or low grade, of each patient by majority voting. Accuracy, sensitivity, and precision of cross validation was calculated to evaluate the performance of proposed models.
Results
Figure 1 showed the segmentation results of one high-grade and one low-grade astrocytoma using the CE-T1WI+SWI combined model. The predicted regions of the high-grade tumor (white) and low-grade tumor (gray) matched the manually delineated ROI (outlined in red). Table 1 listed the sensitivity, precision, and overall accuracy of identifying high-grade and low-grade astrocytoma by three configurations of input datasets mentioned above. Among the three types of the input data, the CE-T1WI+SWI model provided the best performance of tumor grading. In addition, the CE-T1WI-only SegNet model outperformed the SWI-only one prominently, especially for low-grade astrocytoma. In general, the sensitivity and precision of the high-grade tumor were obviously better than those of the low-grade tumor, suggesting discrimination of low-grade tumor remains challenging.Discussion
Our results showed that the model trained with both CE-T1WI and SWI exhibits better discrimination between high-grade and low-grade astrocytomas than the model trained with only one of them. Previous studies indicate that the intra-tumoral susceptibility signal assessed by SWI is promising for astrocytoma grading. 4 However, the sensitivity of low-grade astrocytoma for the SWI model is only 0.47 in this study. The discrepancy may result from the unclear tumor boundary of low-grade astrocytoma in SWI. The whole classification procedure in this study is fully automatic, which means the SegNet model has to determine the tumor region and its grading result simultaneously. Nonetheless, the CE-T1WI image usually helps delineation of tumor, especially high-grade one, with enhanced boundary. As a result, the combination of CE-T1WI and SWI improves the sensitivity of low-grade tumor from 0.47 (SWI-only) and 0.73 (CE-T1WI only) to 0.80 and precision from 0.64 (SWI-only) and 0.79 (CE-T1WI only) to 0.86. In summary, the CE-T1WI+SWI model providing the high accuracy of astrocytoma grading is potentially helpful for clinical diagnosis.Acknowledgements
This work was supported by the National Science and Technology Council (Taiwan) research grants (110-2221-E-110-006-MY2) and Kaohsiung Veterans General Hospital (VGHKS109-144) in Taiwan.References
1. Wang XC, Zhang H, Tan Y, et al. Combined value of susceptibility-weighted and perfusion-weighted imaging in assessing who grade for brain astrocytomas. J Magn Reson Imaging, 2014;39:1569-1574.
2. Lai PH, Chung HW, Chang HC, et al. Susceptibility-weighted imaging provides complementary value to diffusion-weighted imaging in the differentiation between pyogenic brain abscesses, necrotic glioblastomas, and necrotic metastatic brain tumors, European Journal of Radiology, 2019;117: 56 – 61.
3. Badrinarayanan V, Kendall A, Cipolla R. SegNet: A deep convolutional encoder-decoder architecture for image segmentation. IEEE Trans Pattern analysis and machine intelligence, 2017;39(12): 2481-2495.
4. Chuang TC, Chen YL, Shui WP, et al. Intra-tumoral susceptibility signal: a post-processing technique for objective grading of astrocytoma with susceptibility-weighted imaging. Quant Imaging Med Surg, 2022;12(1):558-567.
Figures
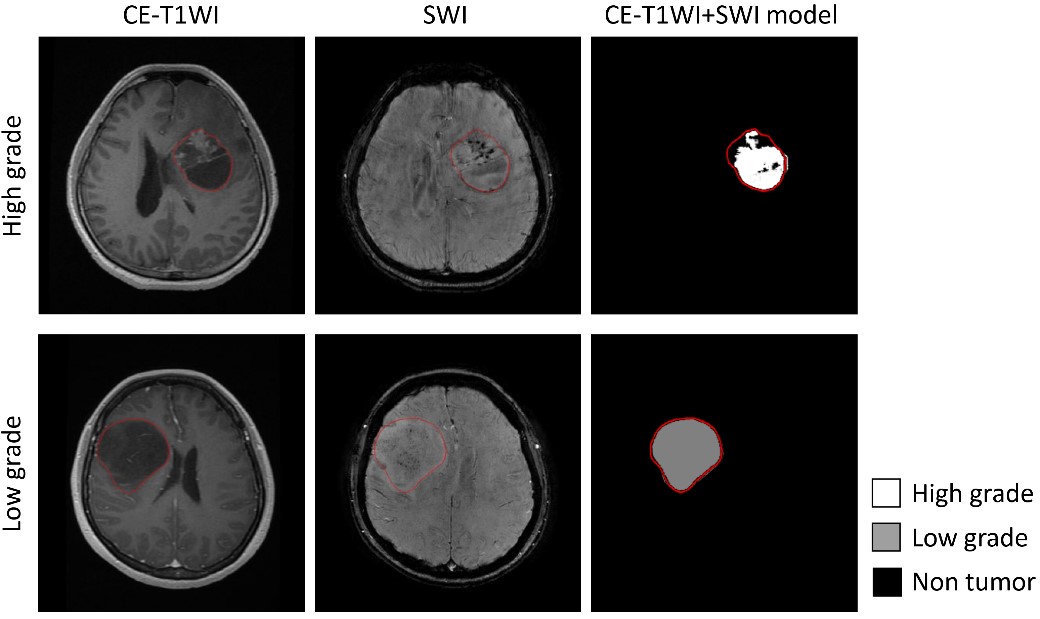

Table 1 Sensitivity, precision, and overall accuracy of tumor grading of three proposed models