2115
Texture analysis of mean apparent propagator-magnetic resonance imaging in distinguishing glioblastoma and solitary brain metastasis
Guohua Zhao1, Yizhou Su2, Yusong Lin2, Jie Dong3, Eryuan Gao1, Xiaoyue Ma1, Jie Bai1, Huiting Zhang4, Xu Yan4, Guang Yang5, and Jingliang Cheng1
1The Department of Magnetic Resonance Imaging, The First Affiliated Hospital of Zhengzhou University, Zhengzhou, China, 2Collaborative Innovation Center for Internet Healthcare, Zhengzhou, China, 3School of Information Engineering, North China University of Water Resources and Electric Power, Zhengzhou, China, 4MR Scientific Marketing, Siemens Healthineers, Shanghai, China, 5Shanghai Key Laboratory of Magnetic Resonance, East China Normal University, Shanghai, China
1The Department of Magnetic Resonance Imaging, The First Affiliated Hospital of Zhengzhou University, Zhengzhou, China, 2Collaborative Innovation Center for Internet Healthcare, Zhengzhou, China, 3School of Information Engineering, North China University of Water Resources and Electric Power, Zhengzhou, China, 4MR Scientific Marketing, Siemens Healthineers, Shanghai, China, 5Shanghai Key Laboratory of Magnetic Resonance, East China Normal University, Shanghai, China
Synopsis
Keywords: Tumors, Diffusion/other diffusion imaging techniques
Preoperative differentiation between glioblastomas (GBM) and solitary brain metastases (SBM) would aid in appropriate treatment planning and follow-up. Mean apparent propagator (MAP) MRI is effective in evaluating the inhomogeneity of brain microstructure. Texture analysis can be used to extract and quantify these inhomogeneities. In this study, we extracted the texture features from MAP-MRI, and validated the candidate features in discriminating between GBM and SBM. The RTAP model achieved the best discriminative power for the single metric model, and performed similarly to the MAP-MRI combined model. Texture analysis based on MAP-MRI has great potential to distinguish between the two entities.Introduction
Glioblastoma multiforme (GBM) and solitary brain metastasis (SBM) are the most commonly reported brain tumors in adults. Accurate preoperative differentiation between GBM and SBM is critical, given the significant differences in the clinically recommended treatment guidelines for the two entities. Routine MRI is the primary imaging modality used for diagnosing brain tumors. However, routine MRI is sometimes inadequate in differentiating GBM from SBM, due to their similar radiological appearances [1]. As an advanced diffusion imaging technique, mean apparent propagator (MAP)-MRI can visualize the degree of diffusional movement of water molecules in tissues, and is more likely to capture previously obscured inherent microstructural features of neuronal tissues[2]. Texture analysis is an assessment method that identifies changes in the signal intensities and neighboring positions of pixels and/or voxels. Thus, MRI-based texture analysis is a sensitive technique for quantifying heterogeneity in tissue composition, which is invisible to the human eye. Previous studies have shown that texture features in GBM and SBM are associated with heterogeneity of peri-enhancing edema, and the identification of these two entities can moderately benefit from the texture features of routine MRI[3]. The purpose of this study was to explore the usefulness of texture features of MAP-MRI in distinguishing GBM from SBM.Materials and Methods
This retrospective study was approved by our Institutional Ethics Committee, which waived the requirement for informed consent. The study was conducted in accordance with the Declaration of Helsinki. Data from 254 patients diagnosed with cerebral GBM and SBM between November 2015 and June 2022 were collected, and finally data from 112 patients were included and analyzed. The inclusion and exclusion criteria are presented in Figure 1. All patients underwent diffusion weighted imaging (DWI) and routine MRI examinations using a 3T MR scanner (MAGNETOM Prisma; Siemens Healthcare, Erlangen, Germany) with a 64-channel head–neck coil. Seventy-nine patients were randomly selected as the training cohort, while the remaining twenty cases were used as the testing cohort.DWI data were acquired using 6b values (0, 500, 1000, 1500, 2000, and 2500 s/mm2), and every nonzero b value was performed in 30 encoding directions. The MAP-MRI metric maps were estimated directly from DWI data using NeuDilab, a software developed in-house with Python, based on the free DIPY Toolbox (https://www.dipy.org/). Finally, MAP-MRI metric maps, including mean squared displacement (MSD), non-Gaussianity (NG), non-Gaussianity axis (NGAx), non-Gaussianity radius (NGRad), return-to-the-origin probability (RTOP), return-to-the-plane probability (RTPP), return-to-the-axis probability (RTAP), and Qspace inverse variance (QIV), were constructed.
The flow diagram of the study is shown in Figure 1. MAP-MRI metric maps were spatially registered to FLAIR images. Subsequently, the peri-enhancing edema region, as a region of interest (ROI), was manually segmented on the axial FLAIR image using the ITK-SNAP (http://www.itksnap.org) software. The key steps, such as feature extraction, feature selection, and model construction, were processed using the FAE software[4]. Based on tumor segmentation, we extracted 93 texture features from each ROI. Features defined by the FAE developer were as follows:18 first-order statistical features, 75 second-order features from the gray-level co-occurrence matrix (GLCM), neighborhood gray-level difference matrix (NGLDM), gray-level run-length matrix (GLRLM), gray-level size zone matrix (GLSZM), and gray-level zone length matrix (GLZLM).
Three feature selection methods and two classifiers were utilized to construct texture feature prediction models on individual maps from MAP-MRI metric maps. Simultaneously, a combined MAP-MRI model was constructed using the candidate features of each metric map. Fivefold cross-validation was used to demonstrate the model performance, which was evaluated using the receiver operating characteristic (ROC) curve, accuracy, area under the ROC curve (AUC), sensitivity, and specificity in the testing cohort.
Results
Detailed clinical characteristics of the patients are summarized in Table 1. No significant difference was found between the two groups in terms of sex (P = 0.884) and age (P = 0.853).Figure 2 and Table 2 depict the performance of the eight MAP-MRI metric map models and the combined model. The RTAP model achieved the best discriminative power (accuracy:84.85%, AUC:0.92, sensitivity:70.59%, and specificity:100.00%) for the single metric model, and performed similarly to the MAP-MRI combined model (accuracy:87.88%, AUC:0.92, sensitivity:82.35%, and specificity:93.75%).
Figure 3 shows the candidate features used to build various texture analytic models. In combined model, two second-order features of RTOP and skewness features of RTPP, NGRad, and MSD played crucial roles in discriminating GBM from SBM, whereas the discriminative model benefitted from the combination of two first-order statistical features and three second-order features of RTAP.
Discussion
Previous studies have shown that textural features are associated with heterogeneity of peri-enhancing edema regions in GBM and SBM[3]. This conclusion is also confirmed by our results. As an additional finding, texture features from MAP-MRI appeared to have better discriminative power compared to texture features from routine MRI[3]. MAP-MRI assesses the dispersion distribution of water molecules by measuring the probability density function of spin displacements in complex microstructures of brain tissue and accurately characterizes diffusion anisotropy by quantifying the non-Gaussian nature of the diffusion process[5,6]. Fortunately, texture analysis can easily extract the diffusion information, and use it to quantify tumor heterogeneity.Conclusion
Texture analysis based on MAP-MRI has immense potential for discriminating GBM from SBM.Acknowledgements
No acknowledgement found.References
[1] Austin-John, Fordham, Caitlin-Craft, et al. Differentiating Glioblastomas from Solitary Brain Metastases: An Update on the Current Literature of Advanced Imaging Modalities. Cancers. 2021;13(12).[2] Mao J, Zeng W, Zhang Q, et al. Differentiation between high-grade gliomas and solitary brain metastases: a comparison of five diffusion-weighted MRI models. BMC Med Imaging. 2020;20(1):124.[3] Dong F, Li Q, Jiang B, Zhu X, Zeng Q, Huang P, Chen S, Zhang M. Differentiation of supratentorial single brain metastasis and glioblastoma by using peri-enhancing oedema region-derived radiomic features and multiple classifiers. Eur Radiol. 2020;30(5):3015-3022.[4] Song Y, Zhang J, Zhang YD, et al. FeAture Explorer (FAE): A tool for developing and comparing radiomics models. PLoS One. 2020;15(8):e0237587.[5] Sun Y, Su C, Deng K, Hu X, Xue Y, Jiang R. Mean apparent propagator-MRI in evaluation of glioma grade, cellular proliferation, and IDH-1 gene mutation status. Eur Radiol. 2022;32(6):3744-3754.[6] Benjamini D, Komlosh ME, Williamson NH, Basser PJ. Generalized Mean Apparent Propagator MRI to Measure and Image Advective and Dispersive Flows in Medicine and Biology. IEEE Trans Med Imaging. 2019;38(1):11-20.Figures
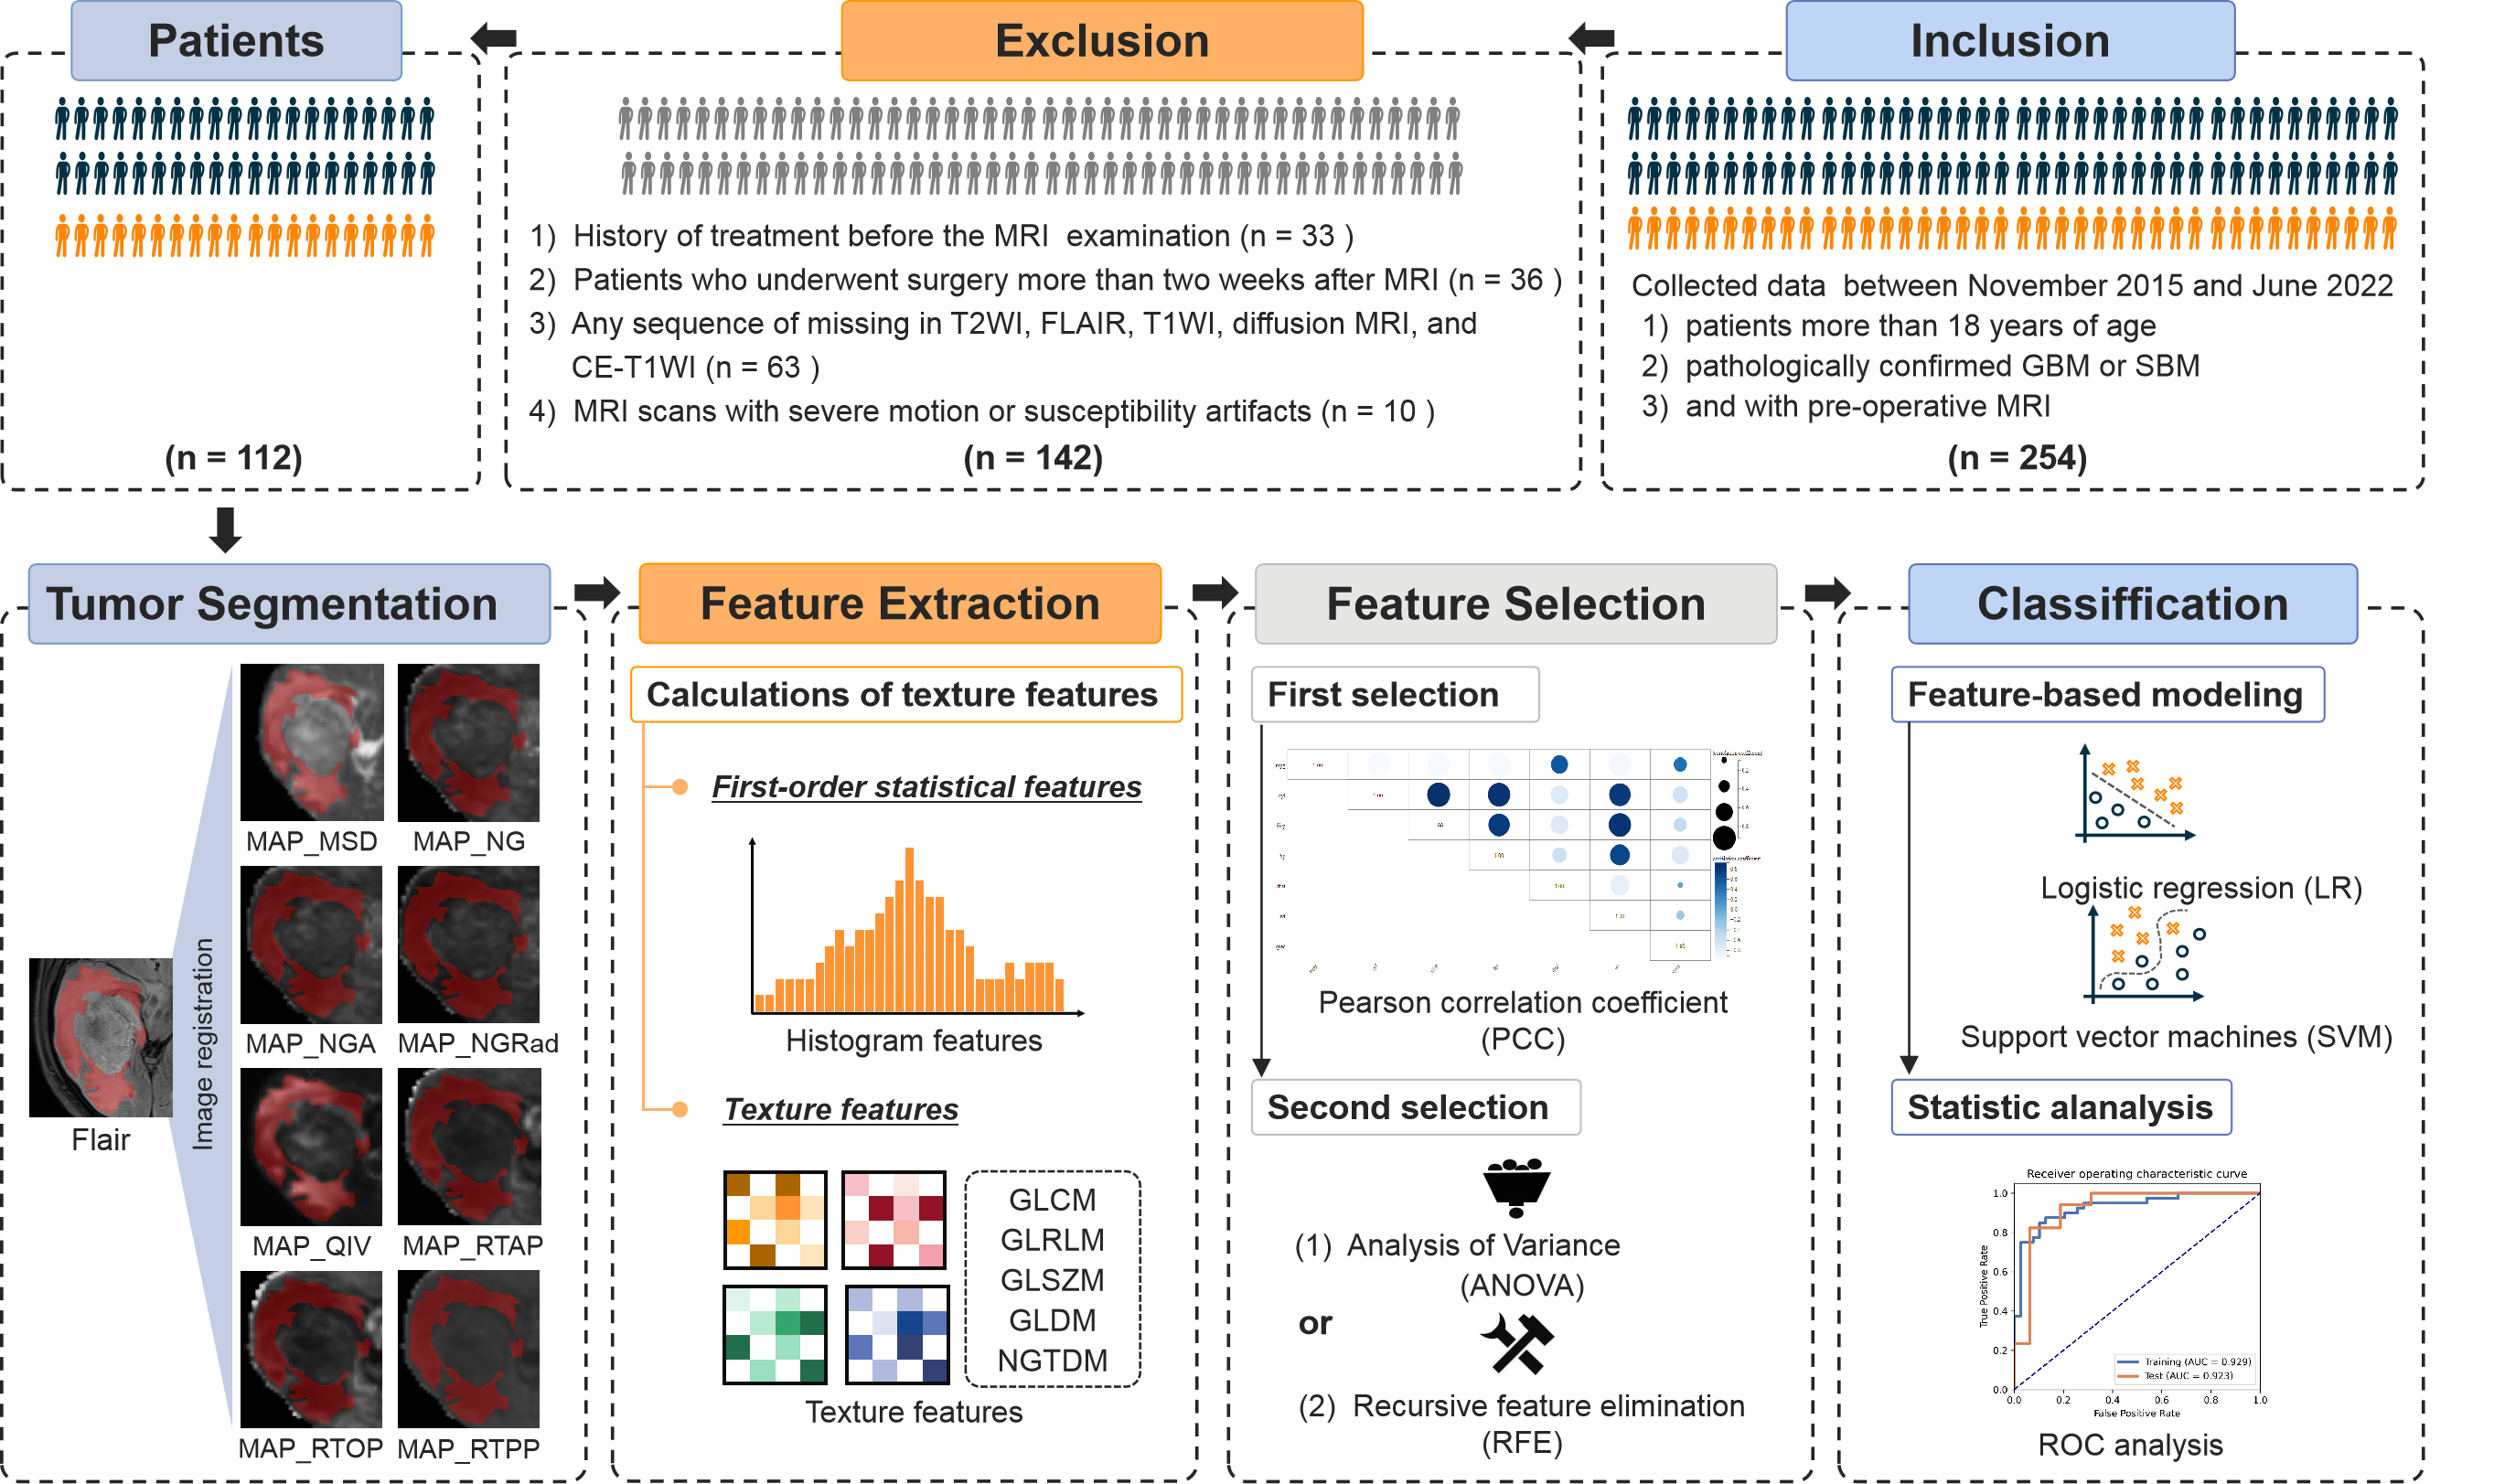
Figure 1. Summary of the modular pipeline for differentiating GBMs from SBMs.

Table 1. Patient Characteristics.
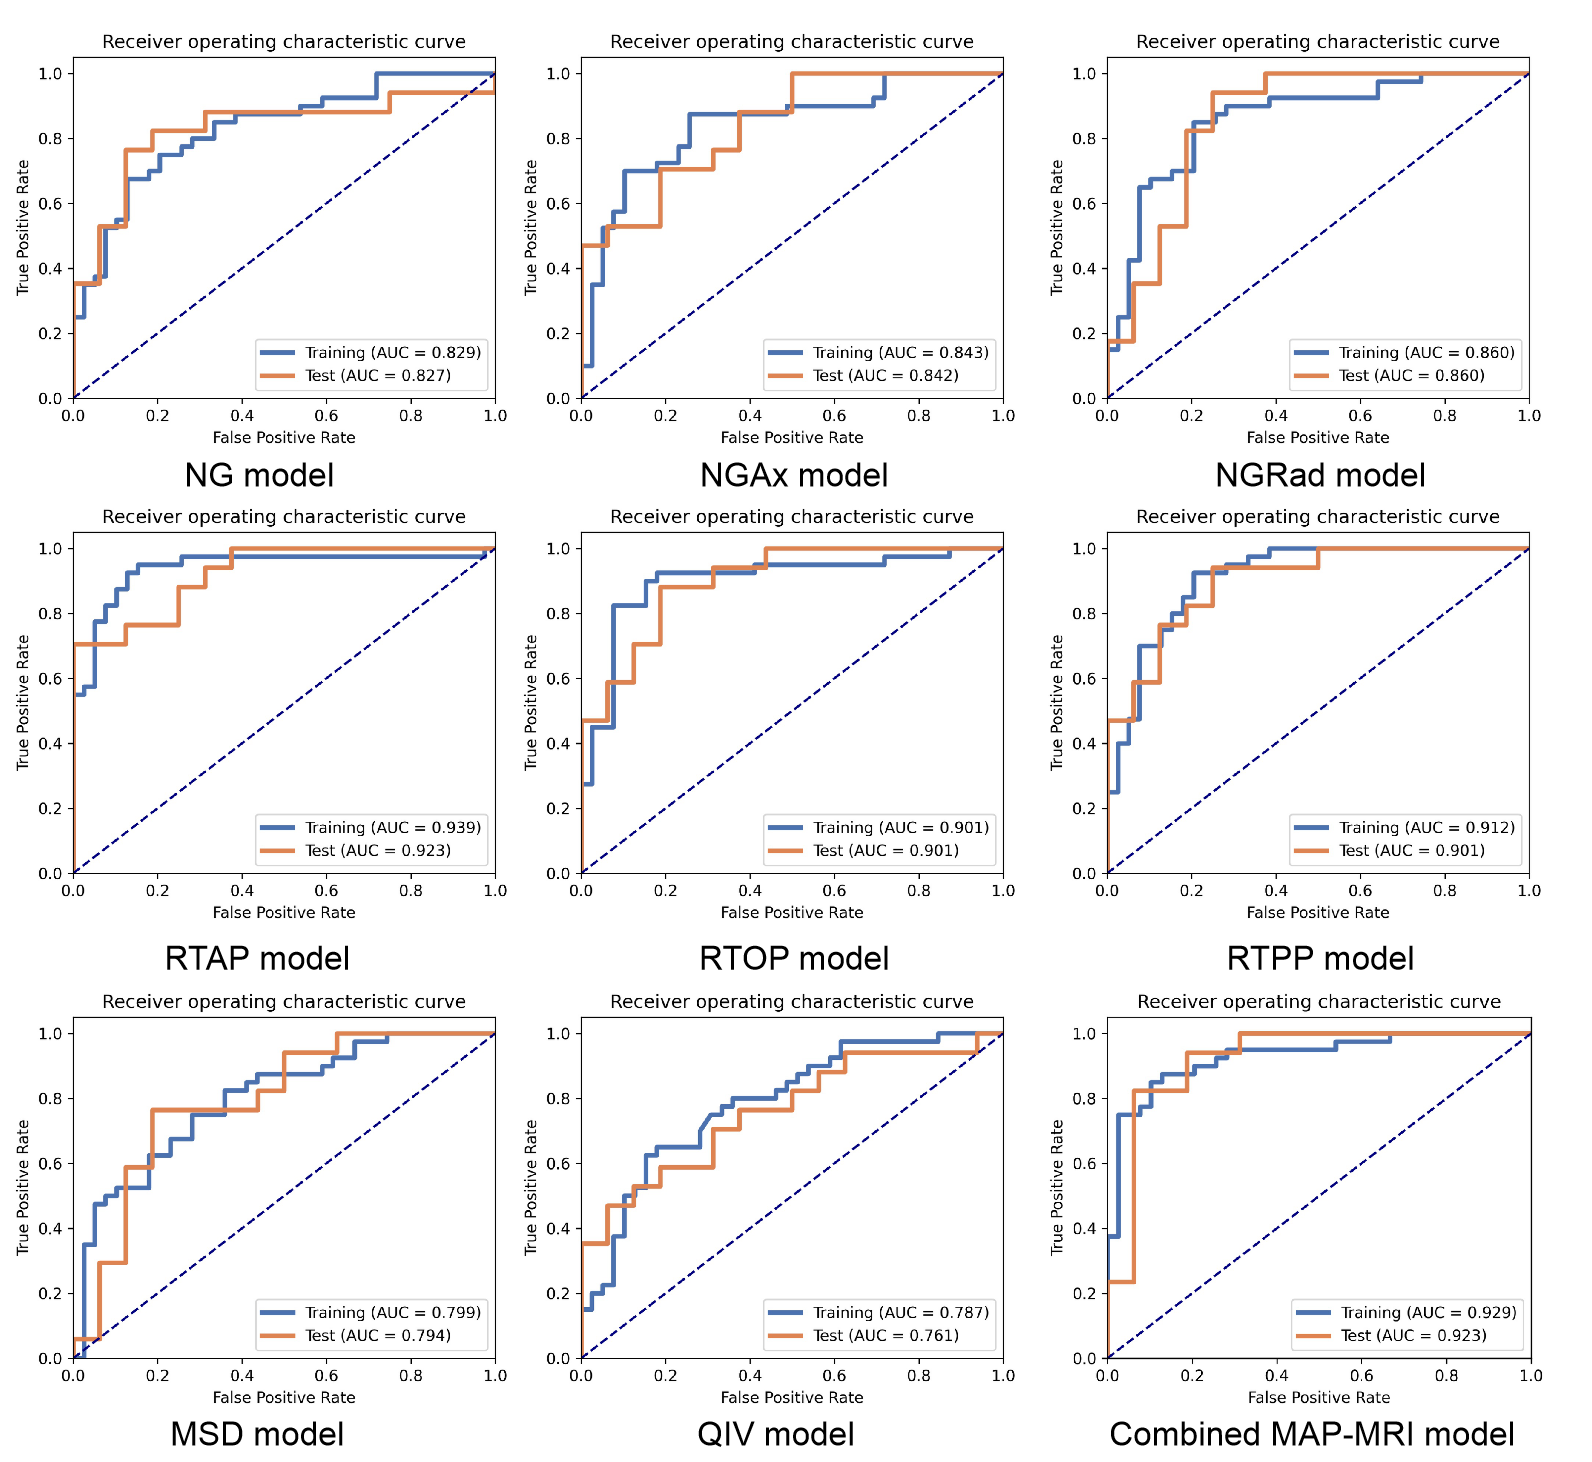
Figure 2. Receiver operating characteristic curve of training and test sets for each texture analysis model.

Table 2. Performance of the models.
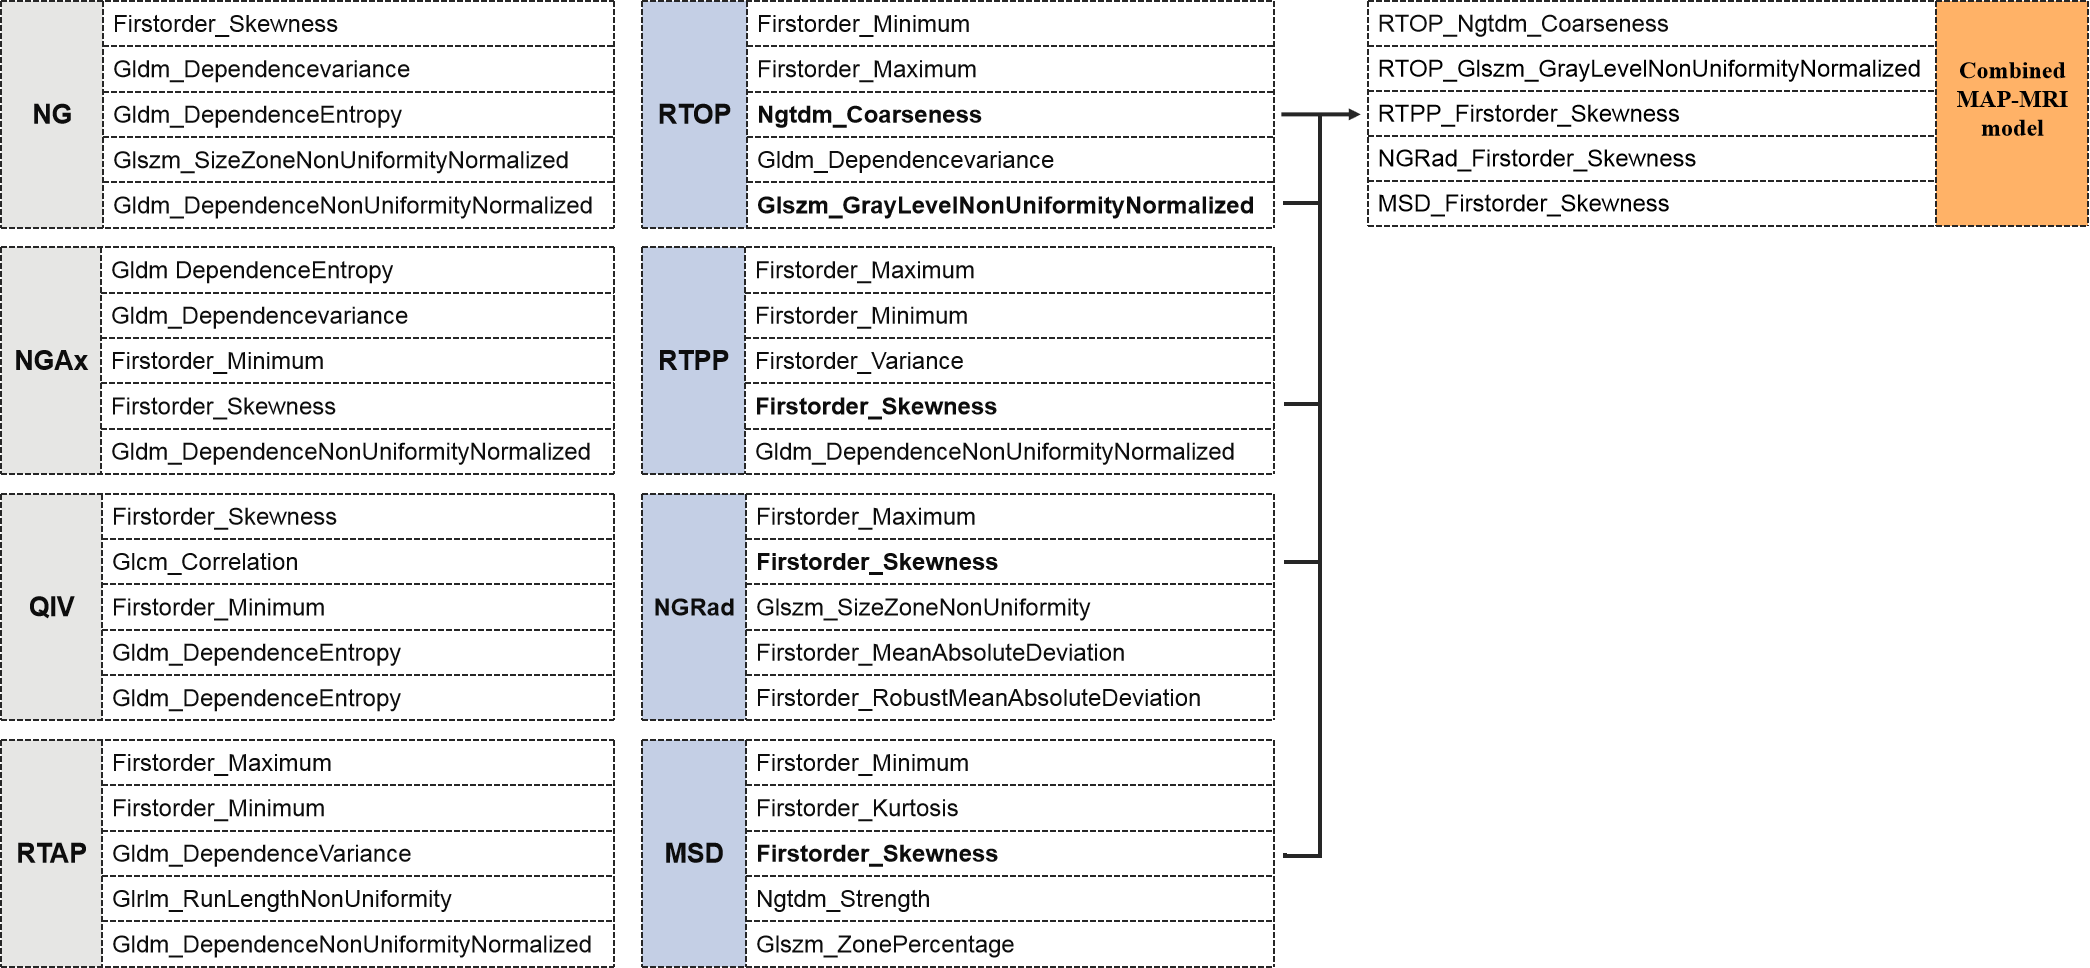
Figure 3. Each texture analysis model was constructed based on five candidate features. Interestingly, the candidate features of RTAP are not selected when building the combined model.
DOI: https://doi.org/10.58530/2023/2115