2111
Evaluation of progressive evolution of oxygen extraction fraction in the brain during acute stroke by using quantitative susceptibility mapping1Emory University, Atlanta, GA, United States
Synopsis
Keywords: Stroke, Brain, Oxygen extraction fraction
Oxygen extraction fraction (OEF) has been suggested to be an effective measure to assess the oxygen metabolism and viability of tissue at risk. The preliminary results in a monkey model of stroke demonstrated progressive OEF reduction in both grey matter and white matter after pMCAO, in agreement with the neuron loss and fiber denegation as indicated by diffusion MRI indices following stroke. The findings suggest QSM derived OEF could provide additional information about the oxygen metabolism of the tissue and may be used to assess the ischemia-induced damage of the brain during acute stroke.Introduction
Oxygen extraction fraction (OEF) has been suggested to be an effective measure to assess the oxygen metabolism of the brain tissue and the viability of tissue at risk after stroke[1]. Recent studies demonstrated that OEF derived by quantitative susceptibility mapping (QSM), could be used to examine the ischemic tissue and showed comparable results with PET which is considered as a gold standard [2]. Also, the previous results suggested OEF could improve the specification of ischemic penumbra compared to that defined by diffusion and perfusion MRI[2]. In the present study, a monkey model of stroke was employed to evaluate the progressive evolution of OEF in the brain during acute stroke by using QSM.Methods and Materials
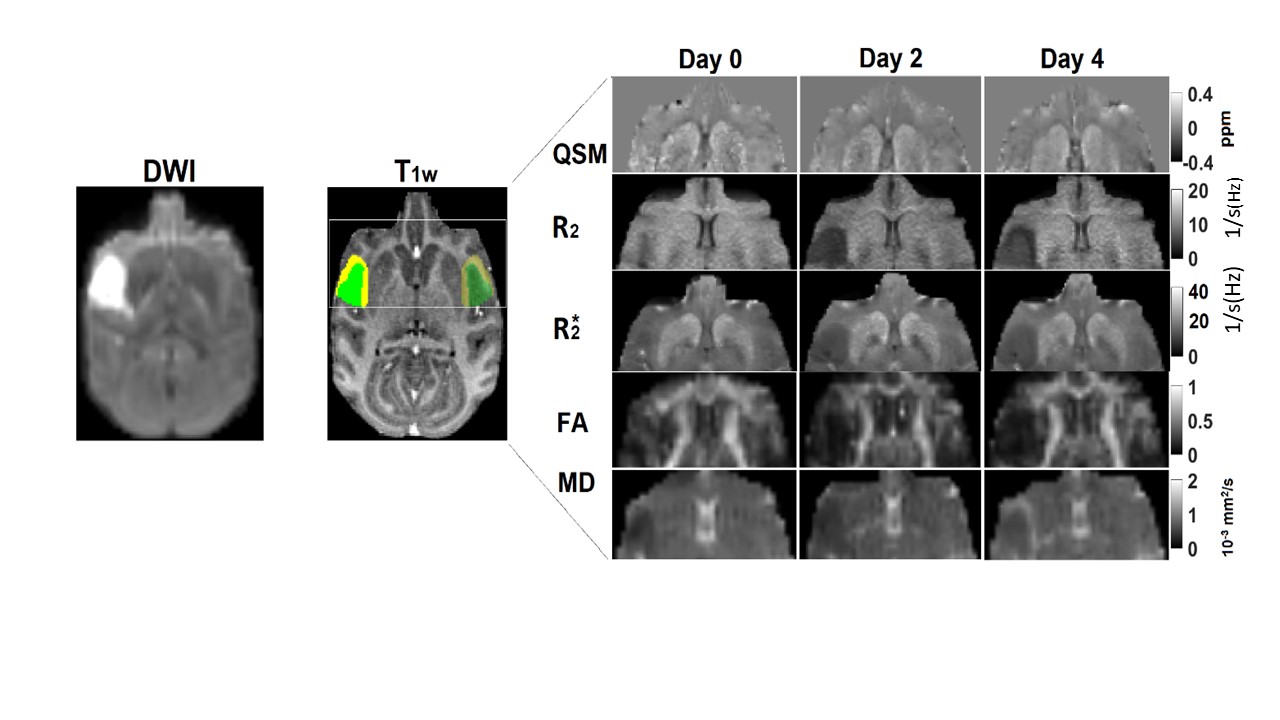
Adult rhesus monkeys (n=8) were utilized in the study. Ischemic stroke was induced by the permanent middle cerebral artery occlusion (pMCAO) with the interventional approach. DTI, SWI, T1, T2, and T2* weighted images were collected using a Siemens 3T scanner with an eight channel array coil on Day 0, Day 2, Day 4 post stroke. Animals were anesthetized with 1-1.5% isoflurane and monitored continuously during scanning. The MCAO lesion regions were identified and extracted from the diffusion weighted images (DWI) lastly acquired and by incorporating automated segmentation tool with the FSL software. The maps of QSM, R2, R2*, FA, and MD were registered to the baseline T1w images and their values were extracted and averaged from the grey matter and white matter in lesion areas and the corresponding regions in the contralateral side. OEF was estimated with QSM by using the procedure reported previously [3]. Progressive changes of QSM and OEF in grey matter (GM) and white matter (WM) were examined and compared with the changes of estimated transverse relaxations and diffusion metrics during acute stroke.Results
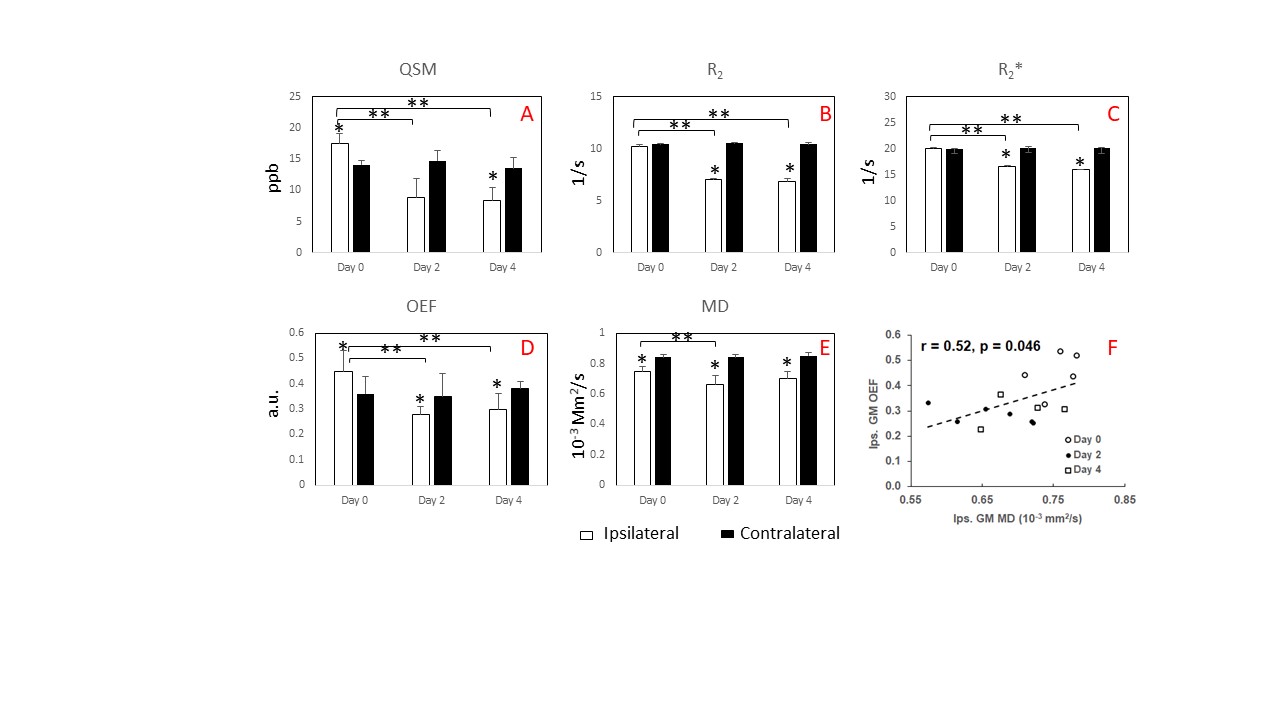
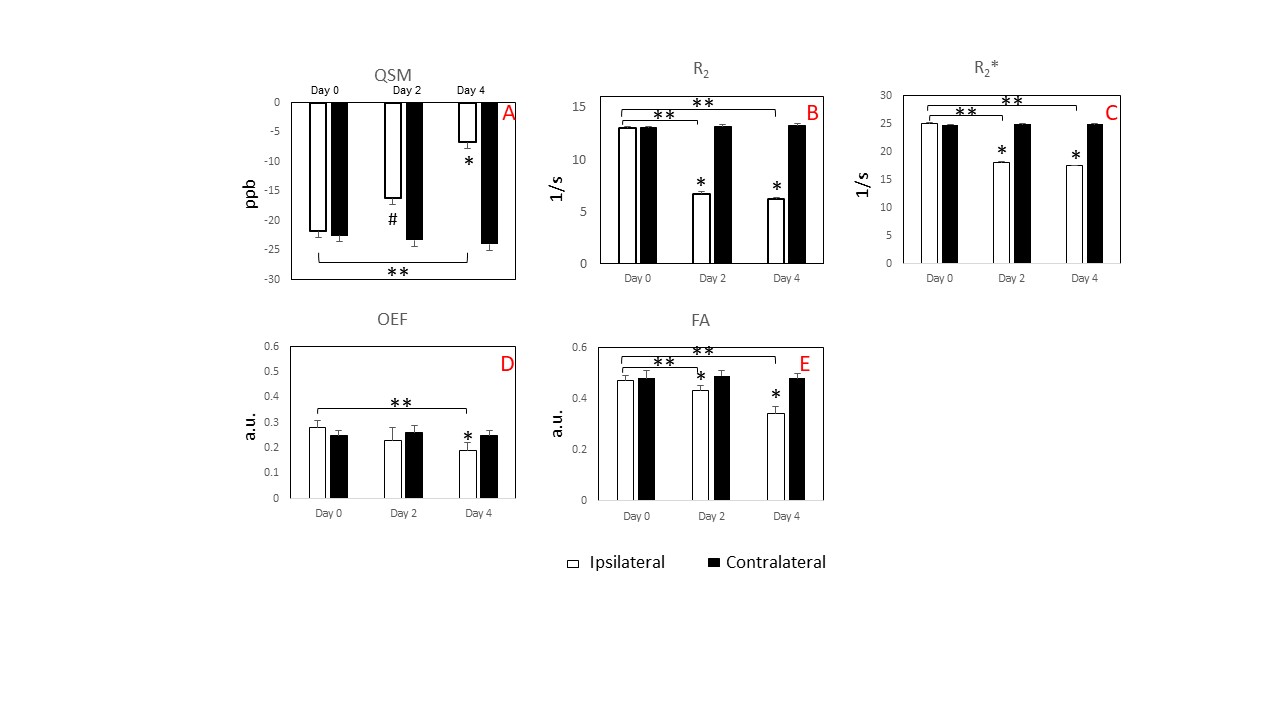
Results: Stroke lesions were seen in all animals and identified by diffusion-weighted images, susceptibility, R2, R2*, FA, and MD maps at each time point (Fig. 1). No hemorrhage was seen in any animals. Decreased susceptibility (QSM) in GM and increased magnetic susceptibility in WM were observed in the lesion area post stroke. Significant OEF reduction was seen at 48 and 96 hours in GM and at 96 hours in WM following stroke (Fig 2 and 3). The susceptibility and OEF changes are in agreement with those in R2, R2*, MD or FA. In particular, the OEF changes in GM were associated temporally with the MD changes during acute stroke (r = 0.52; p = 0.046) (Fig 2F).Discussion
Discussion: Previous DTI studies have demonstrated that both grey matter and white matter were affected progressively during acute stroke and the lesion in GM and WM is associated with prediction of outcome[4, 5]. OEF can provide additional information regarding the oxygen metabolism, and the viability of tissue at risk could be sustained by the increased extraction of oxygen from blood to the brain tissue. As seen in the present study, OEF reduction was more significant in GM than that in WM at 48 hours post stroke, probably because the susceptibility in GM is very different from WM with abundant myelin and different hemodynamic response as well. Progressive OEF reduction in both GM and WM after pMCAO are in agreement with the neuron loss and white matter degeneration as indicated by MD or FA changes following stroke. In particular, the temporal correlation between OEF and MD in GM during acute stroke might suggest the association of the oxygen metabolism with microstructural alteration in the brain tissue post stroke.Conclusions
Stroke brains can be examined using multi-parameter MRI techniques and the tissue at risk is potentially salvageable and mainly aimed in drug discovery studies. The preliminary results suggest QSM derived OEF could provide additional information about the oxygen metabolism of the lesion area and may be used to assess the ischemia-induced damage in the GM and WM during acute stroke. QSM and OEF may provide new insight to understand the neuropathology of stroke injury and facilitate translational research and therapeutic discoveries.Acknowledgements
the Office of Research Infrastructure Programs of NIH (OD P51OD011132).References
1. Little, P.V., et al., Oxygen metabolism MRI - A comparison with perfusion imaging in a rat model of MCA branch occlusion and reperfusion. J Cereb Blood Flow Metab, 2020. 40(11): p. 2315-2327.
2. Uwano, I., et al., Noninvasive Assessment of Oxygen Extraction Fraction in Chronic Ischemia Using Quantitative Susceptibility Mapping at 7 Tesla. Stroke, 2017. 48(8): p. 2136-2141.
3. Kudo, K., et al., Oxygen extraction fraction measurement using quantitative susceptibility mapping: Comparison with positron emission tomography. J Cereb Blood Flow Metab, 2016. 36(8): p. 1424-33.
4. Wong, K.K., et al., Automatic Segmentation in Acute Ischemic Stroke: Prognostic Significance of Topological Stroke Volumes on Stroke Outcome. Stroke, 2022. 53(9): p. 2896-2905.
5. Pinter, D., et al., Early Progressive Changes in White Matter Integrity Are Associated with Stroke Recovery. Transl Stroke Res, 2020. 11(6): p. 1264-1272.
Figures