2106
Automated Analysis of Dynamic Diffusion Abnormalities and Infarct Growth Following Ischemic Injury1Center for Neuroscience and Regenerative Medicine, Bethesda, MD, United States, 2The Henry M. Jackson Foundation for the Advancement of Military Medicine, Inc., Bethesda, MD, United States, 3Allegheny-Singer Research Institute, Pittsburgh, PA, United States, 4Radiology, Harvard Medical School, Charlestown, MA, United States, 5Radiology, Stanford University School of Medicine, Palo Alto, CA, United States, 6Radiology and Radiological Sciences, Uniformed Services University, Bethesda, MD, United States, 7Radiology and Imaging Sciences, Clinical Center, National Institutes of Health, Bethesda, MD, United States, 8CerebroScope, Pittsburgh, PA, United States
Synopsis
Keywords: Stroke, Diffusion/other diffusion imaging techniques, Peri-infarct depolarization, dynamic diffusion MRI
An automated analysis pipeline was developed to detect and analyze the trajectories of dynamic diffusion abnormalities (DDAs) in a rat model of severe ischemic injury. DDAs were detected in both hemispheres of the brain and perilesional DDAs propagated along the infarct boundary. Infarct volume, quantified using apparent diffusion coefficient (ADC), increased during the recording period concomitantly with detected DDAs. Our approach could provide the means to explore the causal relationship between DDAs hypothesized to correspond with peri-infarct depolarizations and secondary expansion of infarcted tissue.Introduction
Peri-infarct depolarizations (PIDs) are waves of spreading depolarization (SD) in cortical gray matter that have been associated with worse outcome following ischemic brain injury1,2. However, the role of PIDs in the expansion of infarct volume remains unclear, likely because clinical monitoring of PIDs is currently performed using electrocorticography which lacks the spatial resolution to measure the 3D trajectory of the propagating wave across the cortex. Diffusion MRI is a clinically feasible imaging method used to assess cellular edema and restriction of extracellular space3,4. Dynamic diffusion abnormalities (DDAs), occurring as propagating waves of transiently reduced apparent diffusion coefficient (ADC), have been observed in animal models of brain injury that elicit SDs5,6, but these observations have typically been performed using manual region of interest (ROI) based methods to detect show that they propagate in a manner corresponding to electrophysiologically measured PIDs. We describe an automated methodology to detect DDAs and implement the approach in an animal model of ischemic injury.Methods
Previously acquired diffusion data (TR/TE = 2500/45 ms, b = 1000 s/mm2, 0.5mm isotropic voxels) from five male Sprague Dawley rats following ischemic stroke injury7 were processed using TORTOISE to correct for motion and eddy current distortions8. ADC time series maps were computed with a temporal resolution of ten seconds.To identify DDAs likely representing PIDs, a sliding window analysis was used to measure a peak correlation coefficient (Rpeak) of the dynamic ADC within each intracranial voxel with a test kernel representing a one minute transient reduction in ADC consistent with previous measurements of dynamic diffusion during triggered SD9. Voxels with Rpeak greater than 0.80 were defined as falling within the trajectory of at least one DDA. The dynamic ADC of voxels within spatially contiguous ROIs with detected DDAs was smoothed temporally by using a Savitzky-Golay filter and applying the findpeaks function in Matlab (Mathworks, 2022) to the smoothed signal to detect local minima. Evolution of the infarct volume was assessed using a threshold-based approach by measuring the volume of intracranial voxels with ADC<500 μm2/s10 across time.
Results
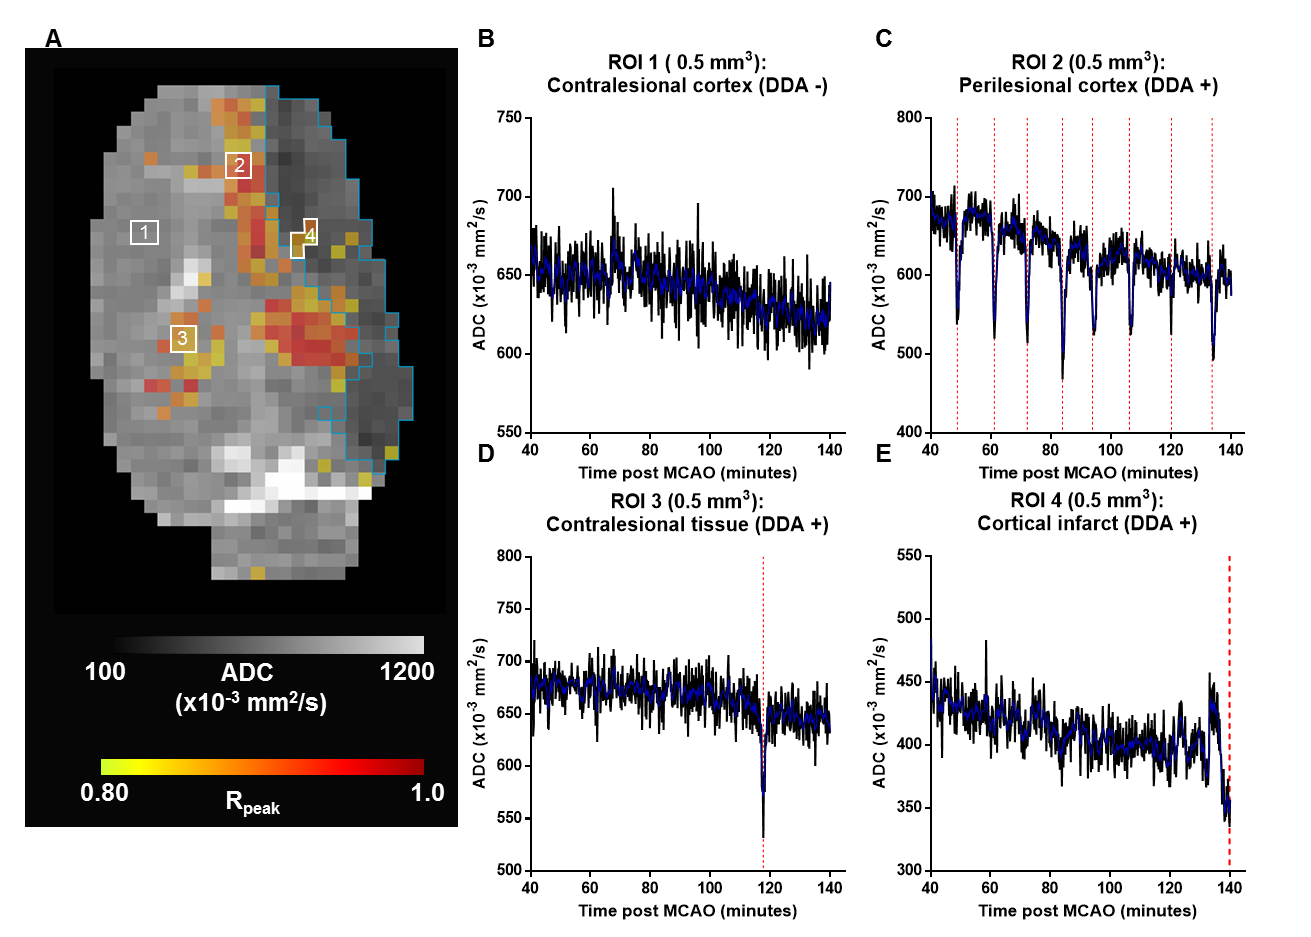
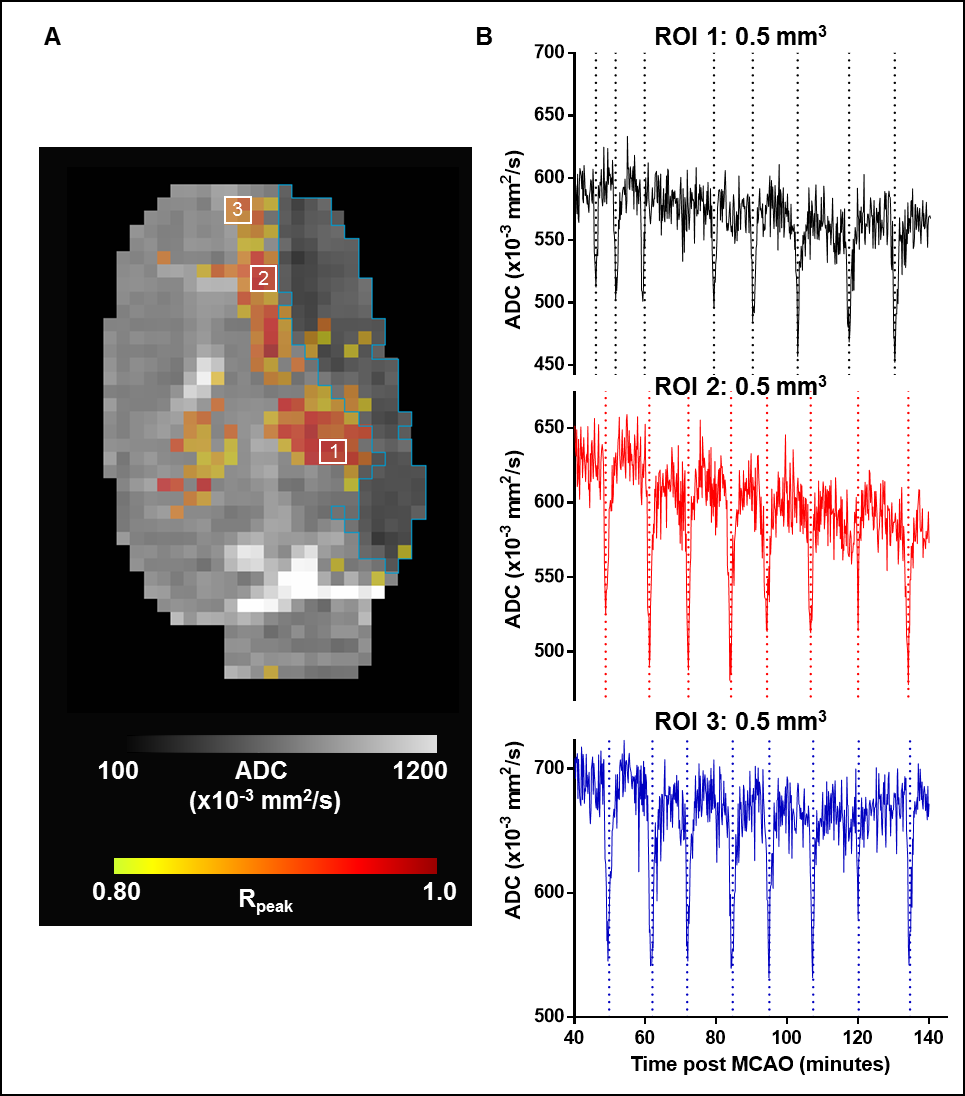
Figure 1A shows DDAs (warm colors) superimposed on the temporally averaged ADC with infarcted voxels (blue contour) in an exemplar animal (Animal ID 4). Regions of interest without detected DDAs were primarily located in the contralesional hemisphere. The temporal ADC in these voxels remained above the infarct threshold during the imaging time (Figure 1B). The blue trace shows the smoothed signal used for detection of local minima. The majority of voxels with detected DDAs (red dashed lines) were located along with peri-infarct boundary, and multiple DDAs occurred with a recoverable ADC that remained above the infarct threshold (Figure 1C). Infrequently, but in all animals, DDAs were detected in the contralesional hemisphere in voxels where the ADC tended to remain above the infarct threshold (Figure 1D). Although DDA positive voxels were present in infarcted tissue they occurred near to the lesion boundary and the fluctuations in ADC made their relationship to a presumptive PID unclear (Figure 1E).The temporal relationship between detected DDAs in ROIs placed along the peri-infarct boundary, along the rostral to caudal direction within a single slice, in the same exemplar animal is shown in Figure 2A. The eight DDAs in ROI 1 slightly preceded DDAs in ROIs 2 and 3 in time, indicating that the DDAs were propagating across the tissue slice (Figure 2B). However, detected DDAs in the remaining four animals did not maintain a consistent propagating trajectory.
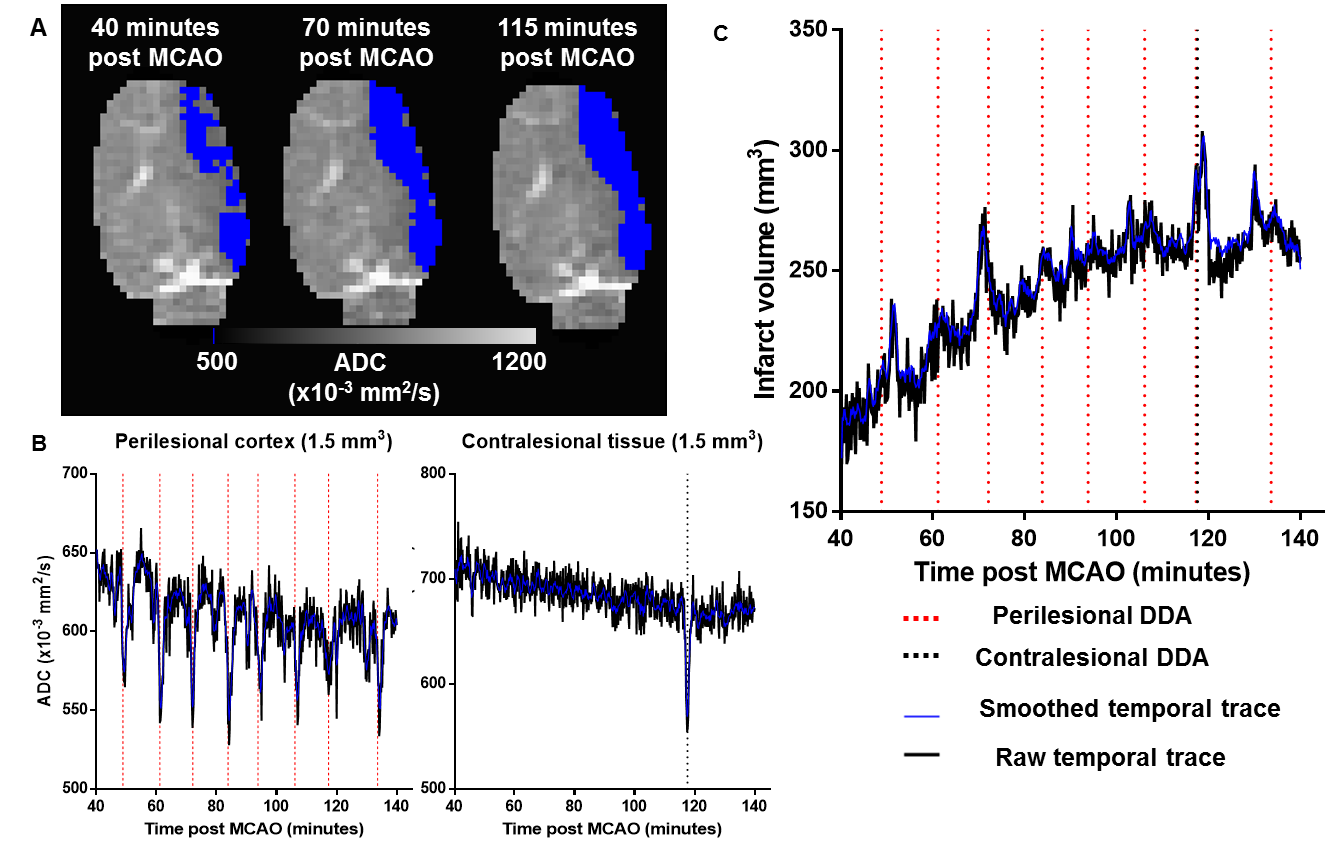
The evolution of infarct volume in the same exemplar animal is shown in Figure 3A. The infarct volume increased over time and plateaued towards the end of the imaging time course. Figure 3B shows plots of the temporal ADC averaged across 1.5mm3 perilesional and contralesional ROIs with detected DDAs (dashed lines). Evolution of infarct volume over imaging time is plotted in Figure 3C. The volume increases are punctuated by transient bursts in lesion volume that temporally correspond with DDAs in perilesional (red dashed lines) and contralesional (black dashed lines) regions where the ADC in voxels were transiently reduced below the defined infarct threshold. In all five animals, the lesion volume increased relative to the baseline by a mean of 17±9% per hour in a similar pattern over the full recording time.
Discussion
The proposed analysis detected DDAs in ipsilesional tissue, both within the developing infarct and along the perilesional boundary, but also in contralesional tissue. Consistent with electrophysiologically measured PIDs11, DDAs in perilesional tissue were preferentially located along the infarct boundary. The mechanism of DDA propagation to the contralesional hemisphere has yet to be determined and is worth further investigation. An ROI based analysis of the spatiotemporal relationship between the trajectory of perilesional DDAs and the expansion of infarct volume would determine whether the incremental increase in lesion volume that is associated with PIDs occurs as part of PID initiation or during their subsequent propagation.Conclusion
Dynamic diffusion imaging has potential to noninvasively measure PIDs. Monitoring the trajectory of DDAs in perilesional tissue may provide a valuable prognostic marker of vulnerable tissue subject to secondary growth of infarcted regions following ischemic brain injury.Acknowledgements
Support for data analysis was provided by the Center for Neuroscience and Regenerative Medicine Military TBI Fellowship (CNRM-92-11216) and NIH NS092181. Data acquisition was funded through NIH NS30839 and NS66292. We are thankful to Dr. Cenk Ayata for helpful feedback and discussion.
Disclaimer: The view(s) expressed herein are those of the author(s) and do not reflect the official policy or position of the Henry M. Jackson Foundation for the Advancement of Military Medicine Inc., Brooke Army Medical Center, the U.S. Army Medical Department, the U.S. Army Office of the Surgeon General, the Department of the Army, the Department of the Air Force, the Department of Defense, or the U.S. Government.
References
1. Dreier, J. P. et al. Spreading depolarizations in ischaemia after subarachnoid haemorrhage, a diagnostic phase III study. Brain 145, 1264-1284, doi:10.1093/brain/awab457 (2022).
2. Dreier, J. P. The role of spreading depression, spreading depolarization and spreading ischemia in neurological disease. Nat Med 17, 439-447, doi:10.1038/nm.2333 (2011).
3. Van Harreveld, A. & Khattab, F. I. Changes in cortical extracellular space during spreading depression investigated with the electron microscope. J Neurophysiol 30, 911-929, doi:10.1152/jn.1967.30.4.911 (1967).
4. Bai, R., Stewart, C. V., Plenz, D. & Basser, P. J. Assessing the sensitivity of diffusion MRI to detect neuronal activity directly. Proc Natl Acad Sci U S A 113, E1728-1737, doi:10.1073/pnas.15198901131519890113 [pii] (2016).
5. Hartings, J. A., Carroll, C. P. & Lee, G. Spreading Diffusion-Restriction Events in the Gyrencephalic Brain After Subarachnoid Hemorrhage Revealed by Continuous Magnetic Resonance Imaging. Neurocrit Care 37, 60-66, doi:10.1007/s12028-021-01376-0 (2022).
6. Kao, Y. C. et al. Dynamic perfusion and diffusion MRI of cortical spreading depolarization in photothrombotic ischemia. Neurobiol Dis 71, 131-139, doi:10.1016/j.nbd.2014.07.005 S0969-9961(14)00199-5 [pii] (2014).
7. V.E. Yushmanov, A. K., S.R. Yutzy, P.G. Menon, P.A. Schornack, E.C. Wiener, F. E. Boada, S.C. Jones. in ISMRM 20th Annual Meeting.
8. Pierpaoli, C., Walker, L., Irfanoglu, M. O., Barnett, A., Basser, Chang, P.L-C., Koay, C., Pajevic, S., Rohde, G., Sarlls, J., Wu, M. in ISMRM 18th annual meeting.
9. Hasegawa, Y., Latour, L. L., Formato, J. E., Sotak, C. H. & Fisher, M. Spreading waves of a reduced diffusion coefficient of water in normal and ischemic rat brain. J Cereb Blood Flow Metab 15, 179-187, doi:10.1038/jcbfm.1995.23 (1995).
10. Sah, R. G. et al. Diffusion-Weighted MRI Stroke Volume Following Recanalization Treatment is Threshold-Dependent. Clin Neuroradiol 29, 135-141, doi:10.1007/s00062-017-0634-4 (2019).
11. Hartings, J. A., Rolli, M. L., Lu, X. C. & Tortella, F. C. Delayed secondary phase of peri-infarct depolarizations after focal cerebral ischemia: relation to infarct growth and neuroprotection. J Neurosci 23, 11602-11610 (2003).
Figures