2105
Quantitative susceptibility mapping reveals an association between iron load in gray matter nuclei and different cerebral perfusion patterns1Radiology, The First Affiliated Hospital of Shandong First Medical University&Shandong Provincial Qianfoshan Hospital, Jinan, China, 2MR Research, GE Healthcare, Beijing, China
Synopsis
Keywords: Stroke, Perfusion
The main purpose was to explore iron alterations in gray matter (GM) nucleus of patients with unilateral middle cerebral artery (MCA) stenosis or occlusion with varied cerebral perfusion states using quantitative susceptibility mapping (QSM). Sixty-one patients with unilateral MCA stenosis or occlusion were divided into three groups based on different cerebral perfusion patterns and examined with QSM. Iron-related susceptibility of GM nucleus subregions were assessed. The results showed that iron deposition in bilateral putamen and globus pallidus at the lesion side significantly increased in patients with extensive impaired but not hypo- or normal cerebral perfusion.Introduction
Intracranial artery stenosis (ICAS) is the main cause of ischemic stroke, especially in middle cerebral artery (MCA)1. For unilateral MCA stenosis or occlusion,cerebral perfusion may be impaired, causing a series of pathophysiological reactions, such as iron deposition mediated oxidative stress2.Iron is an essential trace element for human body. The imbalance of iron homeostasis can cause neurotoxicity through different mechanisms3. The quantitative determination of iron content is crucial to evaluate the level of normal neurophysiological function. Quantitative susceptibility imaging (QSM) is a promising MRI technique for quantifying iron distribution in biological tissues4. It has been reported that after long-term ICAS, abnormal iron metabolism may occur in multiple subregions of gray matter (GM) nucleus5. Vascular stenosis may cause decrease cerebral blood flow (CBF) with different patterns. The effect of different cerebral perfusions on brain iron metabolism is however, still unclear6.
Therefore, the main purpose of this study was to explore the feasibility of QSM in evaluating the iron changes of GM nuclear subregions for patients with long-term unilateral MCA stenosis or occlusion but with different cerebral perfusion statues.
Materials and Methods
Subjects61 MCA stenosis or occlusion patients were included in this study and measured with 3D arterial-spin-labeling (ASL)for CBF assessment. Applying the Alberta-Stroke-Program-Early-CT (ASPECTS) score system based on CBF measures for counting numbers of hypoperfusion subregions7, all patients were divided into extensive hypoperfusion group (11 males and 8 females, 57.16±11.43 years), regional hypoperfusion group (13 males and 7 females, 51.25±13.35 years) and normal group (12 males and 10 females, 52.95±11.04 years).
MRI experiments
All experiments were performed on a 3T clinical scanner (Discovery 750w, GE Healthcare, USA) equipped with a 32-channel coil. Conventional DWI and magnetic-resonance-angiography (MRA) were measured. 3D-ASL and 3D spoiled-gradient-echo based QSM imaging were performed for each participant. The scan parameters were of TR/TE=4632/10.54ms, matrix=128×128, slice thickness=4mm, FOV=240mm×240mm, post-labeling delay time=2050ms, scanning time = 4 minutes 41 seconds for 3D-ASL, and TEs = 8 (first TE = 3.0 msec, TE interval = 3.1 msec), TR = 28.1 msec, FOV = 240 mm × 240 mm, flip angle = 20°, matrix size = 240 × 240, slice thickness = 2 mm, number of slices = 120, scanning time = 2 minutes 31 seconds for QSM.
Image Analysis
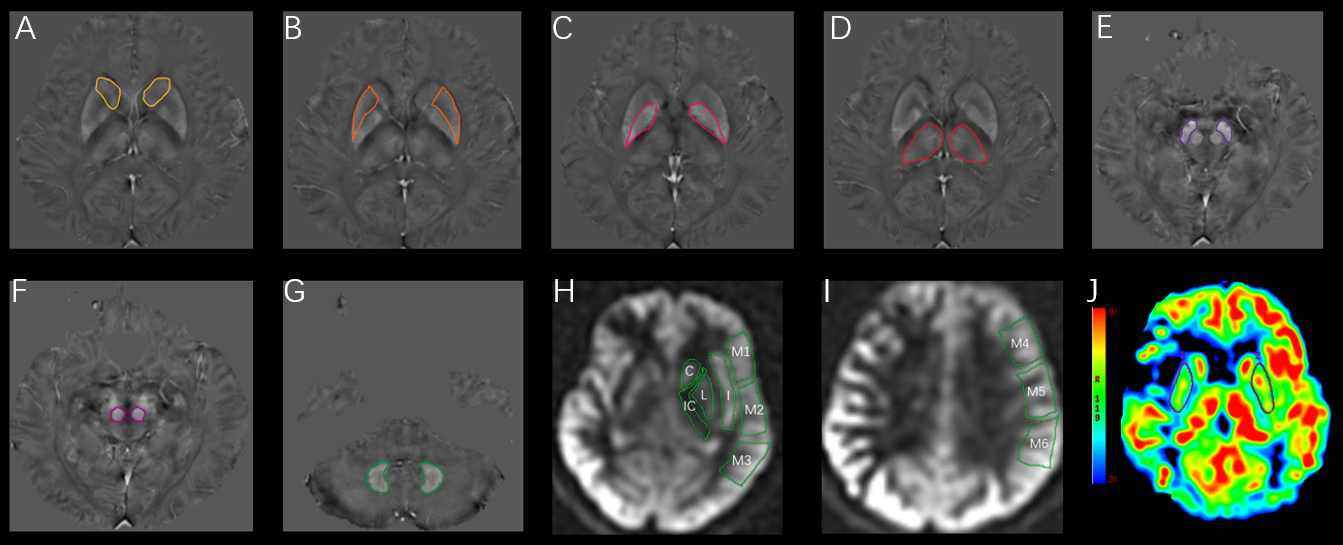
3D-ASL derived CBF mapping was obtained, using a vendor-provided post-processing software on AW4.6 workstation (GE, USA). According to the ASPECTS system, for each patient, the perfusion area of MCA was divided into ten regions-of-interest (ROI)s per hemisphere(Fig.1), of which each region was counted for 1 point. When hypoperfusion was found, the point for this area was subtracted from 10 points. The final score was obtained for each patient, including 10 scores for normal group, 6-9 scores for regional hypoperfusion group, and 0-5 for extensive- hypoperfusion group. The relative CBF was calculated based on the following equation: rCBF=ischemic area CBF/contralateral mirror image CBF. The resultant rCBFs of 0.8-1.20 and < 0.80 were considered normal, and hypoperfusion, respectively7. STI-Suite embedded in MATLAB (MathWorks, Natick, MA) was applied for QSM calculation8. The obtained QSM derived susceptibility maps were used to manually draw ROIs in GM nucleus area, including bilateral caudate nucleus (CN), putamen (PU), globus pallidus (GP), thalamus (TH), substantia nigra (SN), red nucleus (RN) and dentate nucleus (DN) (Fig.1). The mean CBF and susceptibility values of each ROI as measured by two observers were obtained.
Statistical analysis
All statistical analyses were performed in Graphpad prism and IBM SPSS 26.0. Paired t-test was used to compare susceptibility between bilateral GM nucleus subregions of three groups. If comparable susceptibility was found between the affected and contralateral side, the mean level was used in further statistical analyses. If a difference exited, the affected and contralateral side were analyzed separately. The susceptibilities of GM nucleus in three groups were compared by using ANOVA, and post-hoc t test was further applied with Bonferroni correction for multiple comparisons. Significant threshold was set as p < 0.05.
Results
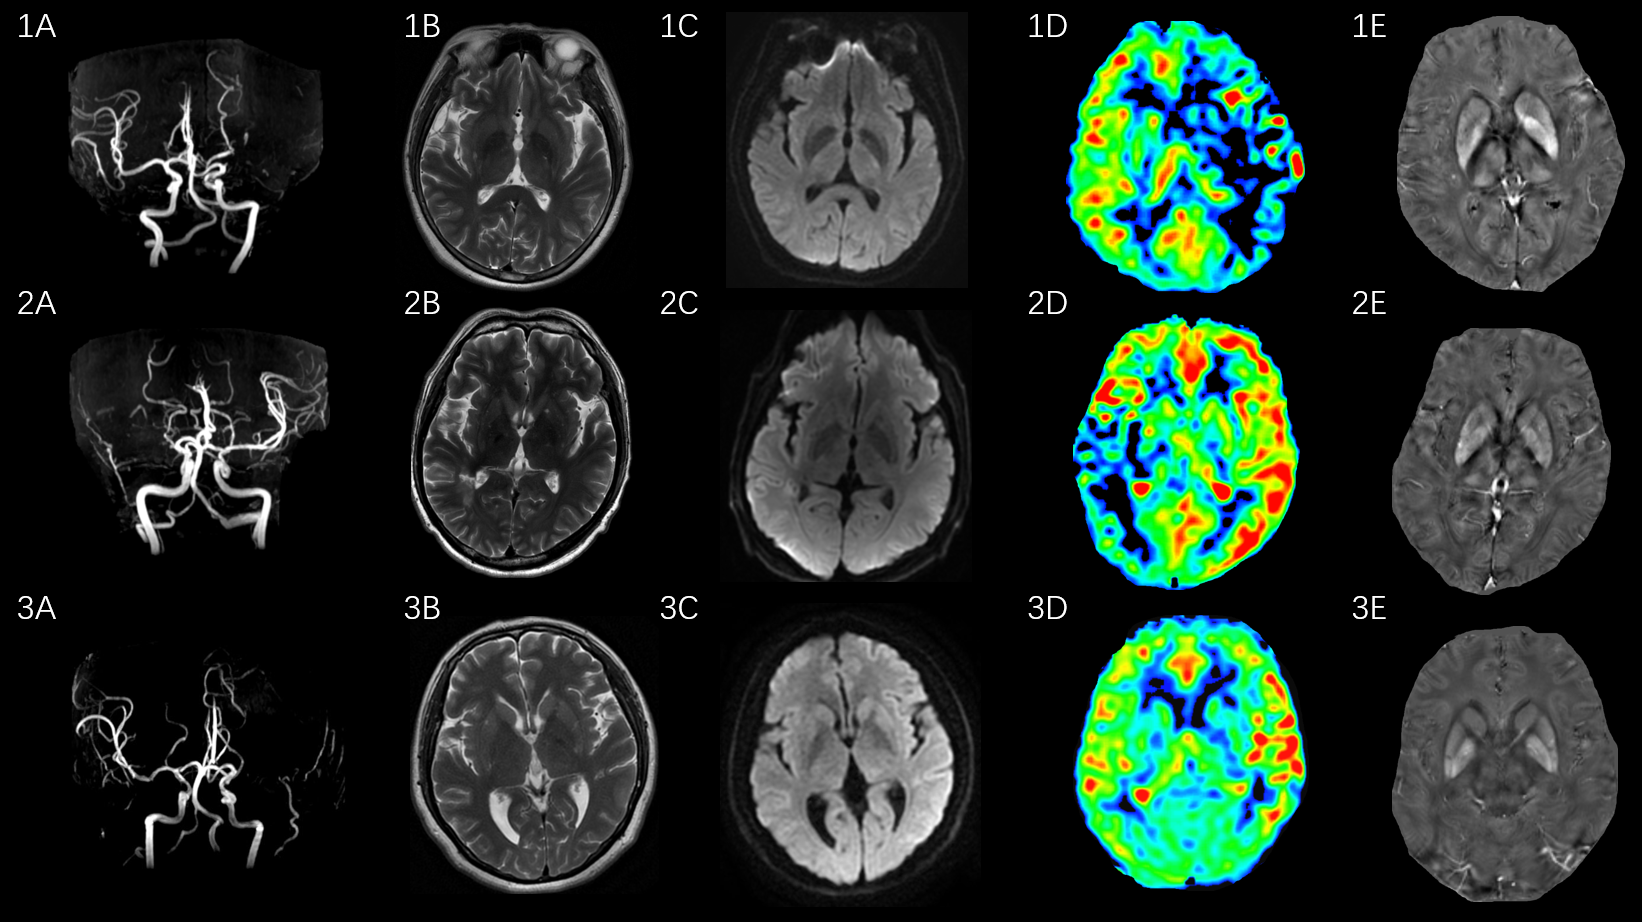
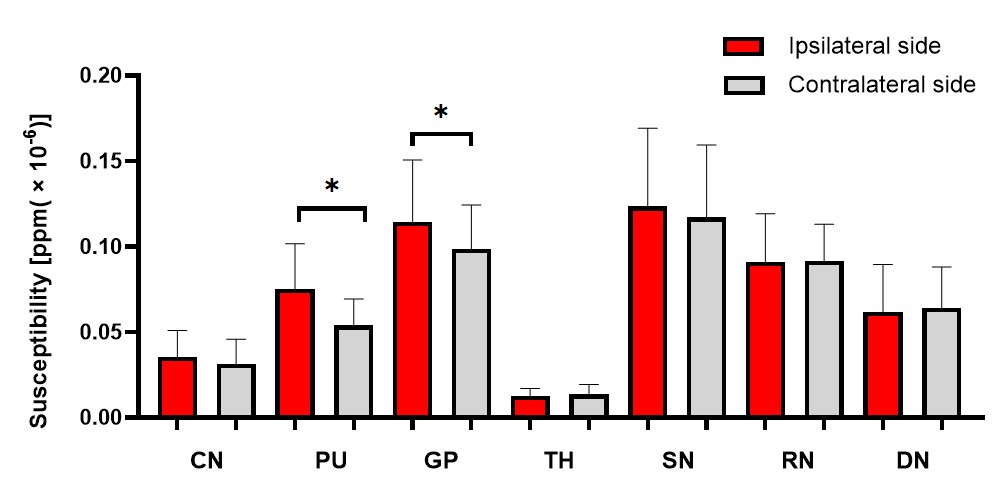
Paired t-test showed that PU and GP exhibited significantly higher susceptibilities in the affected than contralateral sides in extensive-hypoperfusion group (both P < 0.05;Fig.2,3), respectively.Using one-way ANOVA, susceptibilities in PU and GP were significantly different among three groups, respectively (F = 9.079, 3.815, all P<0.05). With post-hoc t tests, for extensive-hypoperfusion group, significantly increased susceptibilities were found in PU and GP at the lesion side relative to normal and regional-hypoperfusion group (all P<0.05;Fig.2,4).
Discussion and conclusions
In this study, QSM was used to investigate the difference of iron content in GM nuclei of patients with long-term unilateral MCA stenosis or occlusion who were measured with varied cerebral perfusion statuses by 3D-ASL. The results showed that the iron deposition of PU and GP on the lesion side increased in patients with extensive impaired cerebral perfusion rather than normal or regional hypoperfusion,indicating that abnormal iron metabolism might be caused by intracranial hypoperfusion.In conclusion, with QSM imaging, excessive iron deposition in certain functional GM nuclei regions may suggest extensive cerebral ischemia hypoperfusion in patients with MCA stenosis or occlusion.
Acknowledgements
We thank Weiqiang Dou from GE Healthcare for this valuable support on QSM imaging.References
1. Banerjee C, Chimowitz MI. Stroke Caused by Atherosclerosis of the Major Intracranial Arteries. Circ Res. 2017;120(3):502-513.
2. Sekerdag E, Solaroglu I, Gursoy-Ozdemir Y. Cell Death Mechanisms in Stroke and Novel Molecular and Cellular Treatment Options. Curr Neuropharmacol. 2018;16(9):1396-1415.
3. Hubler MJ, Peterson KR, Hasty AH. Iron homeostasis: a new job for macrophages in adipose tissue? Trends Endocrinol Metab. 2015;26(2):101-109.
4. Vinayagamani S, Sheelakumari R, Sabarish S, et al. Quantitative Susceptibility Mapping: Technical Considerations and Clinical Applications in Neuroimaging. J Magn Reson Imaging. 2021;53(1):23-37.
5. Mao H, Dou W, Wang X, et al. Iron Deposition in Gray Matter Nuclei of Patients With Intracranial Artery Stenosis: A Quantitative Susceptibility Mapping Study. Front Neurol. 2021;12:785822. 6. Lan L, Leng X, Ip V, et al. Sustaining cerebral perfusion in intracranial atherosclerotic stenosis: The roles of antegrade residual flow and leptomeningeal collateral flow. J Cereb Blood Flow Metab. 2020;40(1):126-134.
7. Wang X, Dou W, Dong D, et al. Can 3D Pseudo-Continuous Territorial Arterial Spin Labeling Effectively Diagnose Patients With Recanalization of Unilateral Middle Cerebral Artery Stenosis? J Magn Reson Imaging. 2021;54(1):175-183.
8. Li W, Avram AV, Wu B, Xiao X, Liu C. Integrated Laplacian-based phase unwrapping and background phase removal for quantitative susceptibility mapping. NMR Biomed. 2014;27(2):219-227.
Figures